Publisher’s version / Version de l'éditeur:
Vous avez des questions? Nous pouvons vous aider. Pour communiquer directement avec un auteur, consultez la première page de la revue dans laquelle son article a été publié afin de trouver ses coordonnées. Si vous n’arrivez pas à les repérer, communiquez avec nous à PublicationsArchive-ArchivesPublications@nrc-cnrc.gc.ca.
Questions? Contact the NRC Publications Archive team at
PublicationsArchive-ArchivesPublications@nrc-cnrc.gc.ca. If you wish to email the authors directly, please see the first page of the publication for their contact information.
https://publications-cnrc.canada.ca/fra/droits
L’accès à ce site Web et l’utilisation de son contenu sont assujettis aux conditions présentées dans le site LISEZ CES CONDITIONS ATTENTIVEMENT AVANT D’UTILISER CE SITE WEB.
Surface & Coatings Technology, 202, 16, pp. 3954-3959, 2008-02-07
READ THESE TERMS AND CONDITIONS CAREFULLY BEFORE USING THIS WEBSITE. https://nrc-publications.canada.ca/eng/copyright
NRC Publications Archive Record / Notice des Archives des publications du CNRC :
https://nrc-publications.canada.ca/eng/view/object/?id=38dcd9e1-771d-4348-b5f4-8789f566333e
https://publications-cnrc.canada.ca/fra/voir/objet/?id=38dcd9e1-771d-4348-b5f4-8789f566333e
NRC Publications Archive
Archives des publications du CNRC
This publication could be one of several versions: author’s original, accepted manuscript or the publisher’s version. / La version de cette publication peut être l’une des suivantes : la version prépublication de l’auteur, la version acceptée du manuscrit ou la version de l’éditeur.
For the publisher’s version, please access the DOI link below./ Pour consulter la version de l’éditeur, utilisez le lien DOI ci-dessous.
https://doi.org/10.1016/j.surfcoat.2008.02.011
Access and use of this website and the material on it are subject to the Terms and Conditions set forth at
Thermo-physical properties of plasma sprayed Yttria stabilized Zirconia
coatings
Thermo-physical properties of plasma sprayed
Yttria Stabilized Zirconia Coatings
R. Soltani
a,⁎
, T.W. Coyle
a, J. Mostaghimi
a, R.S. Lima
b, C. Moreau
b aCentre for Advanced Coating Technologies, University of Toronto, Toronto, Ontario, Canada
b
Industrial Materials Institute, National Research Council Canada, Boucherville, Québec, Canada Received 21 December 2006; accepted in revised form 7 February 2008
Available online 23 February 2008
Abstract
This article investigates the thermo-physical properties of plasma sprayed zirconia coatings produced by agglomerates of submicron size particles as the feedstock. The microstructure of these deposits is consisted of splats and non-molten particles. This bimodal structure generally shows a better performance than conventional coatings. The agglomerated feedstock with internal submicron size porosity may significantly affect porosity related properties, such as the thermal diffusivity. In this study different process parameters were used to deposit yttria stabilized zirconia coatings with conventional and bimodal structures. Results showed a good correlation between the shape and distribution of pores and thermal diffusivity of the coatings.
© 2008 Elsevier B.V. All rights reserved.
Keywords: Bimodal structure; Zirconia coatings; Plasma spray; Thermal diffusivity
1. Introduction
Thermal diffusivity in plasma sprayed coatings mainly depends on microstructural features such as pore size and distribution as well as chemical and phase composition[1,2]. In plasma spray technique the powder particles are heated to the melting point and at the same time accelerated to velocities up to 250 m/s. These in-flight particles produce disc shape structures upon their impact onto the substrate named “splat”. Solidifica-tion of these splats happens in a very small fracSolidifica-tion of second (b10 µs)[3]. Successive splats in many layers result in a coating with lamellae structure. It has been shown that the density of inter-lamellae pores, known as planar voids/gaps, has the strongest effect on determining thermal diffusivity/conductivity of the deposit[1,4–6].
In conventional coatings the cross section size of these pores is comparable to the mean free path of the gas molecules inside
them. Therefore the contribution of conductive heat transfer could be negligible. However, at elevated temperatures the radiative heat transfer across the pores results in a higher coefficient of thermal conductivity[2,7–9].
The thickness of splats could be a representative of the inter-lamellae pores density. This thickness is inversely proportional to the flattening ratio (the ratio of splat diameter to particle diameter); the higher the flattening ratio the thinner the splats. In addition to higher temperature and velocity, hollow spherical particles can improve the melting (no partially melted particles) and flattening behaviour of particles during deposition. These particles can be melted more easily in the plasma stream than solid particles and produce thinner splats than a solid particle of the same diameter. The resulting coating is then made up of thin splats and consequently a high density of planar interlamellar pores. It has been shown that this structure posses a very low thermal conductivity/diffusivity[10–12].
Agglomerated powders possessing internal submicron size pores offer the possibility of increasing the amount or changing the distribution of pores in coatings. By carefully controlling the deposition conditions, a portion of non-melted particles may be retained in the coating[13–15]. This bimodal structure would be expected to affect the thermal diffusivity, because in addition
Surface & Coatings Technology 202 (2008) 3954 – 3959
www.elsevier.com/locate/surfcoat
⁎ Corresponding author. Department of Materials Science and Engineering, University of Toronto, 184 College Street, Toronto, ON, Canada M5S 3E4. Tel.: +1 905 629 3779; fax: +1 905 629 2997.
E-mail address:rsoltani@dateccoating.com(R. Soltani).
0257-8972/$ - see front matter © 2008 Elsevier B.V. All rights reserved. doi:10.1016/j.surfcoat.2008.02.011
to the porosity typical of thermal spray coatings, the non-melted zones would retain the porosity of the agglomerated feedstock in the coating microstructure.
In this study, the influence of the structure and morphology of the feedstock powder particles on the coating structure and thermal diffusivity have been examined. Particular emphasis was placed on the size, shape, and density of inter splat pores. 2. Experimental procedure and results
Two types of yttria stabilized zirconia powder were used as feedstock for the air plasma spray (APS) deposition of coatings using SG-100 torch (Miller, US). Both powders contained 7–8 wt.% Y2O3. One commercially available
powder consisted of hollow spherical particles ranging in size from 45 to 75 µm (204B-NS HOSP™, Sulzer Metco, Westbury, NY, US). The second powder consisted of porous spherical agglomerates of submicron (b200 nm) particles (Nanox S4007, Inframat Corp., Willington, CT, US). The size of agglomerates ranged from 15 to 150 µm. Figs. 1 and 2
show the morphology of HOSP and Nanox feedstocks, respectively. Fig. 3 shows the fracture surface of a Nanox
coating illustrating conventional splats next to the non-melted submicron size particles.
The deposition parameters used for these powders are listed in Table 1. Since the HOSP powder is a commercial feedstock, the best parameters provided by supplier was used to produce the coating while the Nanox feedstock was sprayed with a wider range of parameters to obtain the bimodal structure. During deposition the mean velocity and temperature of in-flight particles were measured by DPV 2000 (Tecnar, QC, Canada); listed in Table 1. The current, hydrogen flow rate, and powder injection location (internal or external) were varied to control the temperature and velocity of in-flight particles and consequently to change the microstructure and properties of the Nanox coatings. The substrates were carbon steel plates 45 × 50 × 4 mm (L × W × H), degreased and grit blasted before coating with alumina grit (grit #24). The thickness of the coatings was in the range of 200–300 µm.
Samples were then cut to 8 × 8 mm and substrates were removed by dissolving in concentrated nitric acid for thermal diffusivity measurements. Additional specimens were prepared for mercury intrusion porosimetry and image analysis. To prepare samples for image analysis specimens were impregnated
Fig. 2. Cross section of an agglomerated particle (left) and agglomerated submicron particles (right) of Nanox feedstock. Showing the nano size pores inside the particle.
Fig. 3. Columnar grains of conventional splat (up) next to the non-melted submicron size particles of an agglomerated particle producing the bimodal structure in a coating produced by Nanox powder as feedstock.
Fig. 1. Hollow spherical particle of HOSP powder showing the typical thickness of the particles wall.
3955 R. Soltani et al. / Surface & Coatings Technology 202 (2008) 3954–3959
with epoxy resin to minimize the surface damage during cutting, grinding and polishing.
Mercury intrusion porosimetry (MIP) experiment was conducted to determine the pore size distribution (Auto Pore III, Micromeritics Instrument Corp., GA, USA). The maximum applied pressure was 207 MPa (30 ksi), allowing pores as small as 10 nm in average diameter to be detected. The incremental intrusion of mercury into open pores versus the pores diameter are plotted inFig. 4.
Based on ASTM standard[16], 20 high resolution images at a magnification of 500× were taken from each sample by scanning electron microscopy (SEM, 2500 Hitachi, Tokyo, Japan); then employing Clemex Vision Professional software (Clemex, QC, Canada) the average porosity and non-melted nano particle percentage of each sample were obtained and listed inTable 2.
The Laser flash method was used to determine the thermal diffusivity of coatings at room temperature (Table 2). Both surfaces of the samples were coated with a thin layer of gold– palladium by sputtering to increase the heat absorption of the ceramic.
3. Discussion
The influence of process parameters on the velocity and temperature of in-flight particles can be found in Table 1. In
samples A1, A2 and A3 (Nanox coatings) a predictable increase in velocity and temperature is observed with increasing the power. The same trend is seen for samples A5, A6 and A7, except that in this set the powder was injected externally, which caused a dramatic drop in temperature and the velocity of the particles, compared to internal injection; though these differ-ences are less pronounced at higher powers. In general the higher temperatures and velocities of the in-flight particles result in lower porosity in the coatings; this trend can be seen in most of the results inTable 2.
The higher porosity level generally means lower thermal diffusivity, however, if the shape or distribution of pores are changed then this trend may not be completely correct. The pores size and distribution, based on incremental mercury intrusion (Fig. 4), could give some internal information about pores in each sample. Some features of these graphs could be listed as follow:
– A8 coating (HOSP sample with 11.2% porosity) has a very small peak at 0.6 μm pore diameter. Comparing with the other wide distributed Nanox samples (except A5) and even the other HOSP sample (A9), this coating shows a relatively low thermal diffusivity (6.12E-7 m2/s) in spite of having lower porosity.
– Almost all of the pore size distribution of samples (Nanox and HOSP) fall in a very similar range; 0.1 to 1 µm.
Fig. 4. Incremental intrusion volume of mercury into the open porosity of coatings showing the pore size distribution in different deposits (A1–A7 Nanox and A8–A9 HOSP).
Table 1
The process parameters used to deposit coatings for Nanox and HOSP feedstocks Sample code Feed powder Power (kW) Current (A) Ar (slpm) H2 (slpm) Injection method Distance (cm) Carrier gas (Ar-slpm) In-flight particle Velocity (m/s) Temp. (°C) A1 Nanox 17 500 50 0.5 internal 6.5 7 159 2908 A2 Nanox 22 600 50 1.0 internal 6.5 7 169 2975 A3 Nanox 27 700 50 1.5 internal 6.5 7 179 3021 A4 Nanox 26 740 40 2.0 internal 6.5 8 149 2958 A5 Nanox 17 500 50 0.5 external 6.5 7 130 2533 A6 Nanox 22 600 50 1.0 external 6.5 7 135 2589 A7 Nanox 26 700 50 1.5 external 6.5 7 162 2801 A8 Metco 26 740 40 2.0 internal 6.5 8 140 2809 A9 Metco 25 600 50 2 external 6.5 6.5 158 2767
– The Nanox samples A1, A3 and A5 show high mercury intrusion in the area of big pores which is an indication of large open porosities. A5 has higher amount of mercury intrusion than the other two samples indicating highest porosity level which is consistent with porosity measure-ments by image analysis.
Fig. 5shows that the amount of total porosity can not explain the differences between thermal diffusivities of HOSP and Nanox coatings on its own. This graph illustrates that for Nanox
samples, increasing the porosity results in reduction in the thermal diffusivity; however same trend can not be observed for HOSP coatings exactly. In the latter case (HOSP deposits, A8 and A9), increasing the total porosity level did not result in a lower thermal diffusivity. As Fig. 5 shows some Nanox samples with higher porosity than the HOSP coatings show higher thermal diffusivity, as well.
Tetragonal to monoclinic phase transformation could affect conductivity of zirconia materials, too. Therefore X-ray diffraction patterns were prepared (D5000, Siemens, WI, U.S. A) from coatings. Results showed no phase changes and the only phase presented was tetragonal. Since both materials are the same, therefore only the amount with the morphology of pores can explain the thermal diffusivities differences.
The literature shows that layered porosity is more effective in blocking heat conduction than isolated porosity. Experiments of Kulkarni et al. [17], show the well layered microstructure of alumina deposited by high velocity oxy-fuel (HVOF) illustrates lower thermal conductivity than that of atmospheric plasma sprayed coating. Wang et al[11] quantified the effect of splat interfaces and reached the same conclusion. This is also supported by the NASA experiments through sintering and removing splat interfaces[18].
Studying the microstructures of Nanox and HOSP samples shows that the number of globular pores in the Nanox coating is much higher than the HOSP deposits, which as discussed can result in an increase in thermal diffusivity if the total porosities are in the same range. In Fig. 6 the microstructure of HOSP coating (A8) is compared to a Nanox sample (A1). Table 2
shows that total porosity of A1 is higher than A8 and surprisingly thermal diffusivity is higher too.
Generally the contact of non-melted particles with the surrounding area is not very good and it is possible to distinguish a lot of small globular pores in between, on the other hand, there are many large pores around non-melted particles and when the impact velocity of particles is low these pores are larger and more frequently observed. To reach to the same level of diffusivity as the HOSP samples, the spraying parameters for the Nanox feedstock were changed. The desired result came along with expense of ~ 4% increase in total porosity (Fig. 7).
Fig. 5. Thermal diffusivity vs total porosity amount for Nanox and HOSP coatings; there is not a significant difference in thermal diffusivities of HOSP samples with different porosities.
Table 2
Physical properties of the Nanox and HOSP coating produced by the process parameters provided inTable 1
Sample Diffusivity (m2/s)
Image analysis
Porosity% Non-melted area % A1 6.68 E-7 14.9 ± 1 4 ± 1 A2 7.06 E-7 13.6 ± 1 3 ± 1 A3 7.74 E-7 12.3 ± 1 4 ± 2 A4 7.24 E-7 12 ± 1 1.5 ± 1 A5 5.09 E-7 17.5 ± 1 4.5 ± 1 A6 6.13 E-7 14.4 ± 2 4 ± 1.5 A7 6.78 E-7 13.5 ± 1 5 ± 1.5 A8 6.12 E-7 11.2 ± 1 – A9 6.31 E-7 13.5 ± 1 –
Fig. 6. Microstructure of HOSP coating A8 (Left); Nanox coating A1 (Right). In spite of higher porosity in Nanox the thermal diffusivity is higher than the HOSP sample.
3957 R. Soltani et al. / Surface & Coatings Technology 202 (2008) 3954–3959
It was only after subsequent reduction in the power of spraying that lead to lower thermal diffusivity for Nanox coating; A5 compared to HOSP deposit A8 (Fig. 8). Many large globular pores with less splats interfaces can be found in the Nanox A5 deposit.
Therefore, to have the same or even lower thermal diffusivity in Nanox samples, compared to HOSP coatings, higher porosity with different morphology may be needed. Referring to splat thickness, the average size of feedstock particles should be considered, too; Nanox with 15–150 µm of agglomerated particle size has a higher average diameter than
that of HOSP with 45–75 µm size of hollow particles. This may lead to thinner splats in conventional coating and increasing the density of interfaces, which results in a decrease in diffusivity.
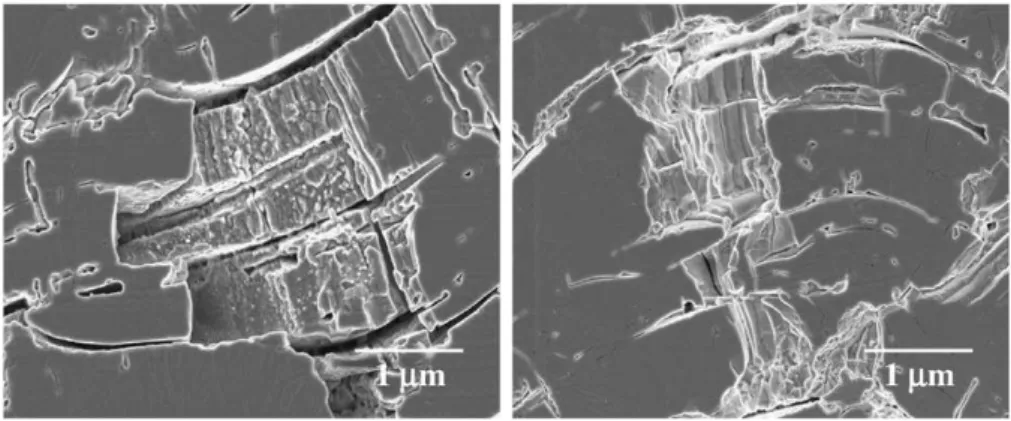
To observe and measure the real splat thickness in coatings, extensive SEM investigation was conducted. To reveal the splat boundaries, etched (in hot H3PO4) and/or fractured
surfaces have to be used. The accuracy of the etching method to expose the thickness of splats drastically depends on the sample preparation; if not all the splat boundaries are revealed by etching then the measured thickness would be higher than the real values.Fig. 9clearly shows this problem. The broken surfaces reveal the splats boundaries beneath them, which illustrate the presence of thinner splats rather than thick ones. Therefore, the fractured surfaces were examined to determine the splat thickness. Twenty images were taken from each sample and the average thickness of splats in all images was calculated.
Results showed that splat thickness of Nanox A5 and HOSP A8 coatings are 2.8 ± 0.3 and 1.8 ± 0.2 µm, respectively. This measurement indicates that the density of inter splat boundaries of Nanox sample could be significantly lower than that in HOSP deposit. Therefore HOSP samples have thinner splats hence more interface and lower conductivity. In the contrary the interfaces are more distinct in Nanox and can have equal thermal conductivity with HOSP by having more porosity.
Fig. 8. Microstructures of Nanox coating (A5), with the lowest thermal diffusivity. The over all volume of globular pores is much higher than the HOSP samples. Fig. 7. Microstructure of Nanox sample A6 with similar diffusivity as the HOSP
A8 coating; arrows show some of the non-melted particle areas.
4. Summary
Two different feedstock powders, one nanostructured (Nanox) and one with hollow sphere particles (HOSP), were used to produce zirconia coatings employing atmospheric plasma spray method. As the most important property, thermal diffusivity of several deposits with different process parameters were measured and compared to each other. Results showed that in spite of having higher porosity in some Nanox samples thermal diffusivity was higher than that in HOSP coatings, too and in order to have lower diffusivity, higher total porosity is needed with employing the nanostructured feedstock to build up a deposit compared to the conventional HOSP.
Several reasons were discussed for the observed behaviour of coatings such as types of pores, inter splats pores/interfaces density, thickness of splats and crystallographic structures. SEM investigation showed that in Nanox samples the density of splats interfaces / pores are less than that in conventional deposits while globular pores are more frequently observed. HOSP powder is consisted of hollow particles (HOSP) which may create thinner splats. This will result in a lower diffusivity as well.
References
[1] F. Cernuschi, P. Bianchi, M. Leoni, P. Scardi, J. Therm. Spray Technol. 8 (1) (1999) 102.
[2] R. McPherson, Thin Solid Films 112 (1984) 89. [3] R.C. Ruhl, J. Mater. Sci. Eng. 1 (1967) 313.
[4] F. Cernuschi, S. Ahmaniemi, P. Vuoristo, T. Mantyla, J. Eur. Ceram. Soc. 24 (2004) 2657.
[5] A. Kulkarni, Z. Wang, H. Herman, J. Allen, J. Acta Mater. 51 (2003) 2457. [6] S. Boire-Lavigne, C. Moreau, R.G. Saint-Jacques, J. Therm. Spray
Technol. 4 (3) (1995) 261.
[7] J.R. Nicholls, K.J. Lawson, A. Johnstone, D.S. Rickerby, Surf. Coat. Technol. 151–152 (2002) 383.
[8] S.A. Tsipas, I.O. Golosnoy, R. Damani, T.W. Clyne, J. Therm. Spray Technol. 13 (3) (2004) 370.
[9] B. Leclercq, R. Mevrel, V. Liedtke, W. Hohenauer, Mat.Wiss. u. Werkstofftech. 34 (2003) 406.
[10] A.A. Kulkarni, S. Sampath, A. Sampath, H. Herman, in: Berndt, Khor, Lugsheider (Eds.), The 1th International Thermal Spray conf., Montreal, QC, Canada, ASM International, Materials Parr, OH, USA, 2000. [11] Z. Wang, A. Kulkarni, S. Deshpande, T. Nakamura, J. Acta Mater. (2003)
5319.
[12] A. Kulkarni, Z. Wang, H. Herman, J. Allen, J. Acta Mater. 51 (2003) 2457.
[13] R.S. Lima, A. Kucuk, C.C. Berndt, J. Mater. Sci. Eng. A327 (2002) 224.
[14] L. Shaw, D. Goberman, R. Ren, M. Gell, Surf. Coat. Technol. 130 (2000) 1.
[15] M. Gell, E.H. Jordan, Y.H. Sohn, D. Goberman, Surf. Coat. Technol. 146– 147 (2001) 48.
[16] ASTM E2109-00, 2003.
[17] A. Kulkarni, J. Gutleber, S. Sampath, A. Goland, J. Mater. Sci. Eng. A369 (2004) 124.
[18] D. Zhu, R.A. Miller, NASA/TM (1999) 209069.
3959 R. Soltani et al. / Surface & Coatings Technology 202 (2008) 3954–3959