Publisher’s version / Version de l'éditeur:
Proceedings of ATEM'11, 2011-09-19
READ THESE TERMS AND CONDITIONS CAREFULLY BEFORE USING THIS WEBSITE. https://nrc-publications.canada.ca/eng/copyright
Vous avez des questions? Nous pouvons vous aider. Pour communiquer directement avec un auteur, consultez la première page de la revue dans laquelle son article a été publié afin de trouver ses coordonnées. Si vous n’arrivez pas à les repérer, communiquez avec nous à [email protected].
Questions? Contact the NRC Publications Archive team at
[email protected]. If you wish to email the authors directly, please see the first page of the publication for their contact information.
Archives des publications du CNRC
This publication could be one of several versions: author’s original, accepted manuscript or the publisher’s version. / La version de cette publication peut être l’une des suivantes : la version prépublication de l’auteur, la version acceptée du manuscrit ou la version de l’éditeur.
Access and use of this website and the material on it are subject to the Terms and Conditions set forth at
Effect of misalignment on residual stress in carbon steel socket welded
joint
Hayashi, M.; Root, John H.
https://publications-cnrc.canada.ca/fra/droits
L’accès à ce site Web et l’utilisation de son contenu sont assujettis aux conditions présentées dans le site LISEZ CES CONDITIONS ATTENTIVEMENT AVANT D’UTILISER CE SITE WEB.
NRC Publications Record / Notice d'Archives des publications de CNRC:
https://nrc-publications.canada.ca/eng/view/object/?id=22857030-3359-4063-bbbc-175e7f220c17 https://publications-cnrc.canada.ca/fra/voir/objet/?id=22857030-3359-4063-bbbc-175e7f220c17
Effect of Misalignment on Residual Stress
in Carbon Steel Socket Welded Joint*
M. Hayashi** and John H. Root*** **Ibaraki Prefectural Government 162-1 Shirakata, Tokai, Ibaraki, Japan
E-mail:[email protected] *** Canadian Neutron Beam Center, NRC
Chalk River, Ontario, Canada
Abstract: Residual stress remarkably affects the fatigue strength of welded socket joint. In carbon and austenitic stainless steel the fatigue strength of socket welded joint is about half of base metal. This is caused by the residual stress at the root of socked weld. In this study the variation of residual stress distribution near the weld start and end points, effects of miss-alignment on the residual stress distribution and the principal strain and stress were examined using the neutron diffraction method. As a result, the effects of misalignment are negligibly small and the residual stress at the weld root is almost the same with that of normally welded joint. The deviations of principal axes from the specimen directions are not so much large and the principal stresses almost agree with those of specimen axes.
Key words: Residual stress, Neutron diffraction, Socket weld, Carbon steel
1. Introduction
The X-ray diffraction technique widely used to accurately measure residual stress in various kinds of materials has been standardized by the Committee on X-ray Study for Deformation and Fracture of Solid of The Society of Materials Science, Japan [1]. Since the penetration depth of X-ray is only about m from the surface, residual stresses inside the structure can not be measured. On the other hand, the penetration depth of neutron is sufficiently deep and the neutron diffraction technique is the only method available to non-destructively determine residual stresses inside weldments [2,3]. The neutron diffraction technique has also been applied to the stress distribution measurement at the fatigue crack tip of specimens under loaded and unloaded conditions [4].
Residual strains were measured in almost all of the previous studies on neutron diffraction. Residual stress distributions have to be measured to evaluate the fatigue strength of structural components. Elastic constants are needed to convert residual strains to residual stresses. Since elastic constants depend on diffraction planes, we have studied this dependency for ferritic steel [5]. Based on our research and previous studies, (211) lattice plane was recognized as the most appropriate plane for measuring residual stresses. The authors also examined the spatial distribution of residual stresses in a socket weld in which a short sleeve is aligned and welded to two tubes [6]. The residual stress at the root of the weld metal in the socket welded joints was about 130MPa. This is about 65% of the estimated value from the fatigue test results of as-welded and stress-relieved socket joints. In the previous experiment, we measured the residual stress distributions in the socket welded specimens in which the axes of socket and pipe was correctly aligned each other. In this study, the effect of misalignment between the socket and the pipe on the maximum axial residual stress was examined. Furthermore, the residual strain distributions near the weld start and end positions, and the principal strains and stresses were also examined.
2. Experimental Procedure
2.1 Specimen
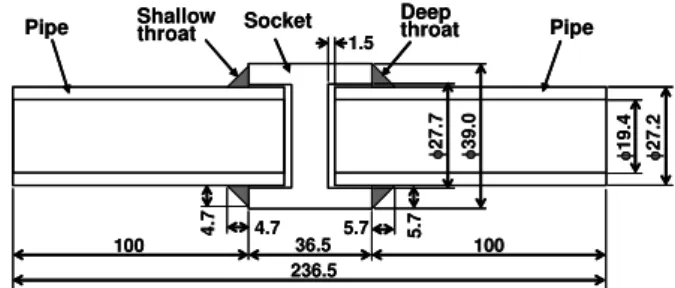
Shape and dimensions of socket welded specimen is shown in Fig.1. Pipes with outside
Copyright 2011 by the Japan Society of Mechanical Engineers, [No. 11-203]
diameter of 27.2mm and inside diameter of 19.4mm are inserted into socket with outside diameter of 39.0mm and inside diameter of 27.7mm and welded each other. Material of pipe is carbon steel JIS STPT410 and that of socket is JIS S25C. Chemical compositions and mechanical properties of both materials are shown in Table 1. Weld throat depths are 4.7mm and 5.7mm to examine the effect of throat depth on the residual stress.
As mentioned later, stress free lattice spacing has to be measured for the residual stress measurement using neutron diffraction. Sampling positions of reference materials for stress free lattice spacing is shown in Fig.2. The stress free samples are cut from base metal, weld metal and heat affected zone. The size is about 5mm cubic. These samples are heat treated at 625℃ for 2 hours to relieve the residual stress due to the welding.
Fig.1 Shape and dimensions of socket welded specimen. Table 1. Chemical compositions and mechanical properties.
Fig.2 Sampling positions of reference materials for stress free lattice spacing. 2.2 Neutron Diffraction Apparatus
An optical system near the diffractometer is shown in Fig.3. The L3 neutron diffractometer at Chalk River Laboratories of National Research Council, Canada was configured to produce a neutron beam with a wavelength of 0.16532 nm by the 115 diffraction of a squeezed single crystal germanium monochromator. Strains were determined from shifts in the angular position of the 112 diffraction peak, which occurred at a diffraction angle of about 89.7 deg. For the measurement of all strains, the incident and diffracted beam were shaped, by slits in cadmium masks, to a width of 1 mm and a height of 3 mm. Since the angle between the incident and diffracted beams was nearly 90 degree, the intersection of the beams defined a sampling volume that was nearly a rectangular prism.
A photograph of a socket welded pipe mounted on the XZ -translator in an orientation suitable for measuring the radial strain components is shown in Fig. 4. The socket welded joint specimen is hold in specially designed jig and it is mounted on the translator. A rotary
5. 0 3. 9 5.0 5.7 5. 7 5. 0 5.0 5. 0 5. 0
Base Metal Weld Metal Heat affected Zone
5. 0 3. 9 5.0 5. 0 3. 9 5.0 5.7 5. 7 5. 0 5.7 5. 7 5. 0 5.0 5. 0 5. 0 5.0 5. 0 5. 0
Base Metal Weld Metal Heat affected Zone
4.7 4.7 5.7 5.7 100 36.5 100 236.5 1.5 27 .7 39 .0 19 .4 27 .2
Pipe Shallowthroat Socket Deepthroat Pipe
4.7 4.7 5.7 5.7 100 36.5 100 236.5 1.5 27 .7 39 .0 19 .4 27 .2
Pipe Shallowthroat Socket Deepthroat Pipe
0.15 Cu 0.11 Cr 0.04 Ni 0.015 0.028 P 0.014 0.47 0.22 0.24 S25C 0.003 0.61 0.19 0.21 STPT420 S Mn Si C Material 0.15 Cu 0.11 Cr 0.04 Ni 0.015 0.028 P 0.014 0.47 0.22 0.24 S25C 0.003 0.61 0.19 0.21 STPT420 S Mn Si C Material 126 Hardness (HB) 36.0 470 333 S25C 49.0 519 392 STPT420 Elongation (%) Tensile strength B(MPa) Yield stress y(MPa) Material 126 Hardness (HB) 36.0 470 333 S25C 49.0 519 392 STPT420 Elongation (%) Tensile strength B(MPa) Yield stress y(MPa) Material
drive unit permits the automatic selection of circumferential positions for examination, while the linear translators permit the automatic selection of various depths and axial locations in the weldment. The specimen can be moved under computer control at a precision of ±0.005 mm to scan the sampling volume throughout a two-dimensional slice through the wall of the weldment. Thus, a spatial map of strain is constructed.
Fig.3 Optical system near diffractometer.
Fig.4 Appearance of residual stress measurement in socket welded joint.
Residual stress measured positions in the vertical cross section is shown in Fig.5 The residual stress distribution through-throat thickness is measured from ① to . Position
is weld root. The residual stress distribution along the pipe surface is measured from to ⑧. Position ⑧ is weld toe.
Fig.5 Residual stress measurement locations. Monochromater Goniometer Diffractometer Socket Welded Joint Incident Slit Diffracted Slit Reactor Monochromater Goniometer Diffractometer Socket Welded Joint Incident Slit Diffracted Slit Reactor 1 2 3 4 5 6 7 8 D 5.65mm 0.5mm Weld metal Pipe 3.9mm OD=27.2mm L Socket 1 2 3 4 5 6 7 8 D 5.65mm 0.5mm Weld metal Pipe 3.9mm OD=27.2mm L Socket
2.3 Neutron Diffraction Measurements
Neutron diffraction is a method for measuring the spacing, d, between the atomic planes of a crystal lattice. A neutron beam of a known wavelength is diffracted from its incident direction by a scattering angle 2 according to Bragg's law,
=2d sin . (1)
By scanning a detector through a range of scattering angles, a profile of neutron counts versus 2 is obtained, as shown in Fig.6. A Gaussian function is fitted to the raw data to obtain the mean scattering angle, also known as the lattice spacing. The peak was collected in about 50 minutes. FWHM is obtained as 0.403 degree. This means that typical precision of the mean scattering angle is ±0.003deg. The value of d in most engineering materials ranges from 0.1nm to 0.3nm. They are determined by Eq.(1) to a precision of about ± 1x10⁻⁵ nm.
Elastic strain, , is determined by comparing the measured value of d to the value measured in a suitable stress-free reference d0 through the relation,
= (d/d0 -1). (2)
Fig.6 Typical neutron diffraction profile.
Actually, d0 are measured in small samples, as shown in Fig.2. d0 for three positions almost
agree with each other and 0.11707±0.00001 nm.
With the three strain measurements at each location, residual stresses can be calculated through a generalized Hook's law,
= ───[H + ─── (H+R+A)] (3)
where E is Young's modulus, is Poisson's ratio and the radial, axial and hoop components of stress, R, A and H, respectively, are obtained by cyclic permutation of the indices in
Eq.(3).
The elastic constants E and , needed to convert the measured strain to the stress, depend on the hkl diffraction plane. Hayashi et al. revealed that the appropriate elastic constants were E=243±5GPa and =0.28±0.01 for strain determined from shifts in the 112 diffraction peak for ferritic steel weldments [5].
3. Experimental Results and Discussion
3.1 Residual strain near the weld start and end points
Since the heat sequence at the weld start and end points is complicated, the residual strain distribution there seems to show extraordinary pattern[2]. Thus the hoop directional residual strain distributions near the weld start and end points were measured. The result obtained at the weld root (Position 4) in the socket welded joint with the shallow throat is shown in Fig.7. The measured region covers ±6mm from center of the start and end points. In the figure the maximum, the mean and the minimum hoop strain measured every 90 degrees in the circumferential direction are indicated for reference. The range of residual
E (1+) (1-2) 800 600 400 200 89.0 88.5 0 89.5 90.0 90.5
Diffraction angle 2 (deg)
Int e nsit y ( c o unt s) Gaussian + Sloping Background FWM=0.403deg 800 600 400 200 89.0 88.5 0 89.5 90.0 90.5
Diffraction angle 2 (deg)
Int e nsit y ( c o unt s) Gaussian + Sloping Background FWM=0.403deg
strains at the weld start and end points exceeds that for circumferential values. However, any characteristic strain distributions can not be found.
The hoop directional residual strain distributions near the weld start and end points in the deep throat socket end points at position 4 joint is shown in Fig.8. In this case only the residual strain at center of end point exceeds the maximum value for circumferential values.
-2.0 0.0 2.0 4.0 6.0 8.0 -8 -6 -4 -2 0 2 4 6 8
Distance from weld center (mm)
R e si d u al str a in (x10 4) Center:Start Center:End Position 4 Max. Min. Mean
Shallow throat (As-welded)
-2.0 0.0 2.0 4.0 6.0 8.0 -2.0 0.0 2.0 4.0 6.0 8.0 -8 -6 -4 -2 0 2 4 6 8
Distance from weld center (mm)
R e si d u al str a in (x10 4) Center:Start Center:End Position 4 Max. Min. Mean
Shallow throat (As-welded)
Fig.7 Residual strain distributions near the weld start and end points at position 4 in socket welded joint with shallow throat.
-2.0 0.0 2.0 4.0 6.0 8.0 -8 -6 -4 -2 0 2 4 6 8
Distance from weld center (mm)
Resi dual s tr a in (x10 4) Center:Start Center:End Position 4 Max. Min. Mean
Deep throat (As-welded)
-2.0 0.0 2.0 4.0 6.0 8.0 -2.0 0.0 2.0 4.0 6.0 8.0 -8 -6 -4 -2 0 2 4 6 8
Distance from weld center (mm)
Resi dual s tr a in (x10 4) Center:Start Center:End Position 4 Max. Min. Mean
Deep throat (As-welded)
Fig.8 Residual strain distributions near the weld start and end points at position 4 in socket welded joint with deep throat.
-2.0 0.0 2.0 4.0 6.0 8.0 -8 -6 -4 -2 0 2 4 6 8
Distance from weld center (mm)
Re si dual s tr a in (x10 4) Center:Start Center:End Position 5 Max. Min. Mean Shallow throat (As-welded)
-2.0 0.0 2.0 4.0 6.0 8.0 -2.0 0.0 2.0 4.0 6.0 8.0 -8 -6 -4 -2 0 2 4 6 8
Distance from weld center (mm)
Re si dual s tr a in (x10 4) Center:Start Center:End Position 5 Max. Min. Mean Shallow throat (As-welded)
Fig.9 Residual strain distributions near the weld start and end points at position 5 in socket welded joint with shallow throat.
-2.0 0.0 2.0 4.0 6.0 8.0 -8 -6 -4 -2 0 2 4 6 8
Distance from weld center (mm)
R e si d u al str a in (x10 4) Center:Start Center:End Position 5 Max. Min. Mean Deep throat (As-welded)
-2.0 0.0 2.0 4.0 6.0 8.0 -2.0 0.0 2.0 4.0 6.0 8.0 -8 -6 -4 -2 0 2 4 6 8
Distance from weld center (mm)
R e si d u al str a in (x10 4) Center:Start Center:End Position 5 Max. Min. Mean Deep throat (As-welded)
Fig.10 Residual strain distributions near the weld start and end points at position 5 in socket welded joint with deep throat.
The hoop directional residual strain distributions obtained at just beneath the weld root (Position 5) in the socket welded joint with the shallow throat is shown in Fig.9 for reference. The residual strain exceeds at only one point at 4mm from the center of end point. The hoop residual strain distributions in deep throat socket welded joint is shown in Fig.10. The residual strain at the center of end point is the almost same the maximum of circumferential values. Almost all the residual strains near the weld start and end points at Point 5 range in the circumferential values. The absolute values of hoop residual strains are a little bit larger at Point 5 than that at Point 4.
The axial and radial directional residual strain distributions could not be measured. However, since the residual stress distributions in the weld metal exhibit static-stress-like, the maximum axial residual stress seems to be larger value than the previously measured. 3.2 Residual stress in misaligned socket welded joint
In the previous study the socket welded joints were precisely manufactured based on the design drawing. This means that the axes of pipes are arranged to match their centers with that of socket. In the actual nuclear and thermal power plants, it is very difficult to match their centers because of very narrow and complicated working conditions. In order to fit the actual conditions the socket welded joint was prepared without any jig to maintain the alignment. On the contrary, the pipe was set to take the maximum angle against the socket, as shown in Fig.11. Because the pipes are not parallel to the socket, there is a circumferential variation of the clearance distance between the outer diameter of each pipe, 27.2 mm, and the inner diameter of the socket, 27.7 mm.
The circumferential position in this specimen is described as an angle, , from the start point of the weld. The weld was made in two passes, beginning at the same start point, =0 degree, but traveling in opposite directions (denoted by the sign of ) around the perimeter of the pipe to reach the end point at =180 degree. The position of maximum clearance is at =45 degree, while the position of minimum clearance is at =-135 degree. Measurements were made to characterize the variation of lattice strain with , in steps of 22.5 degree from =0 degree. At each value of , the strain was measured near the root of the fusion zone, as shown in Fig.11. In the figure, filled circles indicate circumferential positions of sampling volume.
The measurement uncertainties of strains in the axial, hoop and radial directions are ± 0.5x10⁻⁴, ±1.0x10⁻⁴ and ±0.6x10⁻⁴ respectively. These uncertainties are related to the goodness-of-fit of the model function to the raw neutron data, counts versus scattering angle. The typical uncertainties in the calculates stresses are ±17MPa, ±22MPa and ±18MPa for the axial, hoop and radial directions, respectively.
The circumferential variation of axial strain is shown in Fig.12 for example. The residual stress distributions in the axial, hoop and radial directions are shown in Fig.13. As an overall, the strains and stresses are a little bit small, compared with the previous socket welded joint. There are significant variations of strain over a short range in . As evidence that these variations are not simply statistical fluctuations, measurements of the axial strain
Hoop Radial Axial Incident Neutron Beam Diffracted Beam Socket Fusion zone Pipe Sampling volume Hoop Radial Axial Incident Neutron Beam Diffracted Beam Socket Fusion zone Pipe Sampling volume Fig.11 Specimen orientations for misaligned axial centers.
were repeated at some circumferential locations and are presented in Fig.12. The agreement between the two sets of measurements is well within the uncertainty of the measurements. Since this uncertainty is much less than the amplitude of the strain variations, the short-range rapture of the strain variations must be a true feature of the socket welded joint. The distribution of the stresses exhibits a complicated structure, and few features can be related definitely to key locations such as the start and end points or the positions of the minimum and maximum clearance. The effects at these key locations produce residual stress patterns that interfere with each other, since the extreme of clearance are offset by 4 degree from the extreme of the weld path. As in the previous investigation of a socket weld[6], the hoop stresses at the root of the weld exhibit minimum at locations mid-way between the start and end points, near =90 degree and =-90 degree. The largest tensile stress, 115 MPa, is found in the axial direction and occurs at =-135 degree, the position of the minimum clearance between the socket and the pipe. At the start point of the weld, the axial stress exhibits a substantial change of sign. There seem to be no other meaningful correlations to make between physical locations and stress values.
The main surprise in these results is that the residual stresses are low in magnitude at all circumferential positions. This observation seems to be inconsistent with the formation of fatigue cracks in the actual nuclear power plants. The absence of large axial stresses may be explained in two possible ways. First, it may be that the root of the weld is not the location of maximum axial stress. To test this explanation, a new series of measurements should be
-1.0 0.0 1.0 2.0 3.0 4.0 5.0 -180 -120 -60 0 60 120 180 Angle (deg) Re sid u al s train (x 1 0 4)
Axial direction Start
Maximum gap =+45deg End -1.0 0.0 1.0 2.0 3.0 4.0 5.0 -1.0 0.0 1.0 2.0 3.0 4.0 5.0 -180 -120 -60 0 60 120 180 -180 -120 -60 0 60 120 180 Angle (deg) Re sid u al s train (x 1 0 4)
Axial direction Start
Maximum gap =+45deg End Start Maximum gap =+45deg End
Fig.12 Axial residual strain distribution in the circumferential direction in misaligned socket welded joint.
Fig.13 Circumferential variations of axial, hoop and radial stresses at the root of the fusion zone in misaligned socket welded joint.
Fig.14 Residual stress distributions in correctly aligned socket welded joint
made elsewhere in the fusion zone of the weldment. Second, it may be that the axial, hoop and radial directions are not principal axes of the stress field, and therefore the measurements do not show the highest magnitudes of strain. To test this explanation, measurements in directions other than axial, hoop and radial have been made, to search for the principal axes.
The residual stress distributions in correctly aligned socket welded joint are shown in Fig.14. The axial, radial and hoop stresses take the similar change at all the measured positions, and the residual stress is static-stress like. The maximum residual stress is generated at weld root (Position 4) and about 130MPa. Since the largest tensile stress in the misaligned socket welded joint is 115MPa, the effect of misalignment on the residual stress is found to be small.
3.3 Determination of principal axes of stress
To determine the principal axes and the values of the principal stresses, measurements of lattice strain must be made in more than six directions in the specimen. A direction in the specimen is described by , the angle of tilt from the radial direction and , the azimuthal angle from the axial direction, as shown in Fig.15. The six independent elements of a strain tensor, ij, can be determined by a least-squares fit of the strains measured in each direction,
(, ), the relation is,
(,)=i,j ℓi ℓj . (4)
In Eq.(4), the indices i and j assume values for three specimen axes: 1=axial, 2=hoop and 3=radial. Note that ij=ji, since the tensor is symmetric. The functions ℓ1 are direction
cosines: ℓ1=sincos, ℓ2=sinsin and ℓ3=cos.
The principal values of the strain tensor are the eigenvalues, x, y and z, and are
-100 -50 0 50 100 150 R e s idu al str e ss (M P a ) -180 -120 -60 0 60 120 180 Angle (deg) Axial Hoop Radial -100 -50 0 50 100 150 -100 -50 0 50 100 150 R e s idu al str e ss (M P a ) -180 -120 -60 0 60 120 180 -180 -120 -60 0 60 120 180 Angle (deg) Axial Hoop Radial Axial Hoop Radial Direction Axial Radial Hoop
As-welded Stress Relief
䐟 䐠 䐡 䐢 䐣 䐤 䐥 䐦 200 100 -200 -100 0 Position Resid u al s tress (M Pa) Weld root Outside surface Toe Direction Axial Radial Hoop
As-welded Stress Relief
䐟 䐠 䐡 䐢 䐣 䐤 䐥 䐦 200 100 -200 -100 0 Position Resid u al s tress (M Pa) Weld root Outside surface Toe
Fig.15 Definition of direction in a tubular specimen by the angles and . determined by solving the cubic equation:
(11-x) 12 13
12 (22-y) 23 = 0 (5)
13 23 (33-z)
The corresponding eigenvectors are the principal axes of strain, denoted as x*, y* and z*. The principal stresses may be calculated through an algebraic relation that is analogous to Eq.(3).
The same specimen as described in Section 3.2 provided the data needed to determine the principal axes of strain in the socket weld. At the circumferential position =0 degree, measurements of strain were made in the axial, radial and hoop directions, and in 9 other directions, which were specified by the angles (, ). At least seven measurements of strain, (, ), required to determine a least-squares solution for the elements of the strain tensor through Eq.(4). To obtain an accurate solution, the values of (, ) should be chosen to sample a wide range of directions in the specimen. However, as a result of the way in which the specimen was mounted on the diffrarctometer, the values of (, ) were confined either to the plane perpendicular to the axial direction or the plane perpendicular the hoop direction. Because of this confinement, the variations of strain about the radial direction were not well mapped, and the value of 12 could not be determined very precisely. To find
a strain tensor from Eq.(4) a reasonable strain value of zero was included in the data set for the intermediate direction (, )=(70°, -45°). This fictitious datum was assigned a large uncertainty, ±1x10⁻⁴, so it would not greatly influence the strain tensor.
The fitted strain tensor is
2.8±0.5 0.5±3.1 -0.6±1.2
= 0.5±3.1 0.0±0.8 0.7±1.0 (6) -0.6±1.2 0.7±1.0 -1.8±0.5
Solving Eq.(5), the principal strains are x = 3.0 x 10⁻⁴
y = 0.2 x 10⁻⁴ (7)
z = -2.1 x 10⁻⁴
and the principal axes, in terms of the original coordinate system (Axial, Hoop, Radial) are x* = ( 0.984, 0.136, -0.113)
y* = (-0.088, 0.930, 0.357) (8) z* = ( 0.154, -0.342, 0.927)
The directions of the principal axes may be related to the original coordinate system by the angle of tilt from the radial direction, , and by the azimuthal angle from the axial direction, . The directions, (, ) for the x*, y* and z* axes are (96°,8°), (69°,85°) and (22°,-66°) respectively.
The principal axes deviate a little bit from the axial, hoop and radial directions. The angular separation between the axial direction and x* is about 10 degrees. The angular separation between the hoop direction and y* is about 22 degrees, which is the same as the angular separation between the radial direction and z*. However, the principal strains are nearly the same as the analogous strains measured in the axial, hoop and radial directions: 2.7x10⁻⁴, 0.4x10⁻⁴ and 2.7x10⁻⁴ respectively. From Eq.(3) and (7), the principal components
of stress are calculated to be x=65MPa, y=16MPa and z=-25MPa, values that agree with
the stresses in the axial, hoop and radial directions at =0 degree.
At the start point of the weld, it has been shown that the principal components of stress are essentially equal to those that were determined by assuming that the axial, hoop and radial directions were the principal axes. Therefore, the low values of residual stress represent the true stress state in the weldment and do not result from the approximation that the principal axes are axial, hoop and radial.
4. CONCLUSIONS
Neutron diffraction has provided a detailed map of the circumferential variation of residual stresses at the root of the fusion zone in a socket welded joint. Obtained results are summarized as follows:
1) The hoop directional residual strains at the weld start and end points slightly exceed the maximum strain measured in the circumferential directions. However this seems not to explain the fatigue strength of socket welded joint.
2) The effect of misalignment between pipe and socket is negligibly small. The highest tensile stress is 115 MPa in the axial direction at the location of minimum clearance between the pipe and the socket. This value almost agrees with that measured in the socket welded joint to mach the centers of pipe and socket.
3) The principal axes and principal strain and stress are determined for the root of the fusion zone at the weld start point. The deviations of the principal axes from the specimen-fixed directions, axial, hoop and radial are not so much substantial and the maximum deviation is 22 degrees. This validates the assumption that the axial, hoop and radial directions approximate the principal axes, for the calculation of residual stresses from measured lattice strains. The principal stresses well agree with the stresses in the axial, hoop and radial directions at =0 degree
ACKNOWLEDGEMENTS
The technical assistance of J. Fox and L. McEwan are important for the measurements. Discussions with Dr. T. M. Holden are of great value in the development of a computer program to analyze the principal components of strain from measurements.
References
1. Standards for X-ray Stress Measurement, The Society of Materials Science, Japan (1987)
2. A. J. Allen, M. T. Hutchings, C. G.Windsor and C. Andreani, Advances in Physics, 34 (1985) 445. 3. S. R. McEwan, T. M. Holden, R. R. Hobsons and A. G. Cracknell, Proc. 9th Structural Materials in
Reactor Technology (1987) 183.
4. J. H. Root, J. Katsaras, and J. Porter, Proc. 5th Int. Conf. on Residual Stresses (1997) 616.
5. M. Hayashi, M. Ishiwata, N. Minakawa, S. Funahashi and J. H. Root, J. Soc. Mat. Sci., Japan, 44 (1995) 1115.