Publisher’s version / Version de l'éditeur:
Collection of Technical Papers : AIAA/ASME/ASCE/AHS/ASC Structures,
Structural Dynamics and Materials Conference, pp. 1-24, 2010-04-15
READ THESE TERMS AND CONDITIONS CAREFULLY BEFORE USING THIS WEBSITE. https://nrc-publications.canada.ca/eng/copyright
Vous avez des questions? Nous pouvons vous aider. Pour communiquer directement avec un auteur, consultez la première page de la revue dans laquelle son article a été publié afin de trouver ses coordonnées. Si vous n’arrivez pas à les repérer, communiquez avec nous à PublicationsArchive-ArchivesPublications@nrc-cnrc.gc.ca.
Questions? Contact the NRC Publications Archive team at
PublicationsArchive-ArchivesPublications@nrc-cnrc.gc.ca. If you wish to email the authors directly, please see the first page of the publication for their contact information.
NRC Publications Archive
Archives des publications du CNRC
This publication could be one of several versions: author’s original, accepted manuscript or the publisher’s version. / La version de cette publication peut être l’une des suivantes : la version prépublication de l’auteur, la version acceptée du manuscrit ou la version de l’éditeur.
For the publisher’s version, please access the DOI link below./ Pour consulter la version de l’éditeur, utilisez le lien DOI ci-dessous.
https://doi.org/10.2514/6.2010-3025
Access and use of this website and the material on it are subject to the Terms and Conditions set forth at
Effects of fastener clearance fit and friction coefficient on the stress
condition in triple-row riveted lap joints
Li, Gang; Shi, Guoqin; Bellinger, Nicholas C.
https://publications-cnrc.canada.ca/fra/droits
L’accès à ce site Web et l’utilisation de son contenu sont assujettis aux conditions présentées dans le site LISEZ CES CONDITIONS ATTENTIVEMENT AVANT D’UTILISER CE SITE WEB.
NRC Publications Record / Notice d'Archives des publications de CNRC:
https://nrc-publications.canada.ca/eng/view/object/?id=1d09053b-9359-4306-a2b5-c47630c2cf12
https://publications-cnrc.canada.ca/fra/voir/objet/?id=1d09053b-9359-4306-a2b5-c47630c2cf12
American Institute of Aeronautics and Astronautics 1
Effects of Fastener Clearance Fit And Friction Coefficient on
the Stress Condition in Triple-Row Riveted Lap Joints
Gang Li,1 Guoqin Shi,2 and Nicholas C. Bellinger3
National Research Council Canada, 1200 Montreal Road, Ottawa, ON, Canada K1A 0R6
Effects of fastener clearance fit, friction coefficient, and corrosion pillowing on the stress state in triple-row riveted lap joints were studied numerically using three-dimensional finite element methods. The material elastoplastic constitutive relationship and geometric non-linear properties, as well as nonnon-linear contact boundary conditions, were included in the numerical simulations. The numerical modeling was validated using experimental measurements of the rivet driven head deformation and in-situ strains. The lap joints were loaded in tension after riveting. Three different clearance fits, three different friction coefficients, and four corrosion pillowing conditions were analyzed. The stress variation along prescribed paths during the tensile loading stage is discussed for each of these conditions. Full-field contours of the friction and maximum principal stresses during the tensile loading stage were investigated. Numerical results showed that a small increase in the clearance fit considerably increased the joint stress magnitude. The clearance fit magnitude also affected the maximum stress location in the vicinity at the top fastener hole. A large friction coefficient increased the contact and friction stresses in the hole vicinity. These results could explain the scatter degree of the fatigue data and could be used to improve the manufacture quality for high fatigue-rated riveted lap joints. Serious corrosion pillowing significantly increased the stress magnitude at both the middle and top hole regions, and led to the co-existence of the two highly-stressed areas in the outer sheet, which greatly decreased the integrity of the aged riveted lap joint due to the occurrence of the multiple-sited damages during cyclic loading.
Nomenclature
C = material parameterD = rivet-shank diameter
Dhole = protruding-hole diameter
Dmax = maximum diameter of the rivet driven head after riveting
Ho = rivet protruding height above the inner-sheet surface before riveting
L = joint length
M = material parameter
R2 = data fit parameter
RSF = rivet squeeze force
t = joint sheet thickness
ε = normal strain
εtrue = true strain
σ = normal stress
σtrue = true stress
σy = initial yield stress
σNRSS = nominal rivet squeeze stress
1
Associate Research Officer, Structures and Materials Performance Laboratory, Institute for Aerospace Research, Gang.Li@nrc-cnrc.gc.ca. Member AIAA.
2
Senior Research Officer, Structures and Materials Performance Laboratory, Institute for Aerospace Research. 3
Structures Group Leader, Structures and Materials Performance Laboratory, Institute for Aerospace Research. 51st AIAA/ASME/ASCE/AHS/ASC Structures, Structural Dynamics, and Materials Conference<BR> 18th
2
I. Introduction
RIPLE-ROW countersunk riveted lap joints, commonly used in aircraft fuselage structures, are subjected to combined loadings from fuselage internal pressurization and secondary bending due to the tensile load path eccentricity. The stress condition is further complicated by stress concentrations in the fastener hole region, due to the existence of the countersunk holes, and residual stresses around the hole induced by the riveting process.1-8 The magnitude of the induced residual stress is directly dependent on the rivet squeeze force.1, 4, 6 Large compressive residual stress in the hole vicinity is created by large rivet squeeze force (RSF), which can greatly improve the joint fatigue life.1, 6, 7 Test results have shown that a certain degree of scatter is present in the fatigue life for the riveted lap joints under the same loading condition.9, 10 The causes of this scatter could be attributed to differences in the clearance fit between the rivet and the fastener hole edge, knife edge hole conditions caused by the countersunk depth in the outer sheet, corrosion pillowing between overlap regions, fastener hole conditions, scatter in the material property, riveting condition, etc. By properly selecting the rivet size, a knife-edge hole can be avoided. The most controllable factor during the manufacturing process should be the clearance fit. When riveted lap joints are subjected to cyclic loading conditions, fretting damage can lead to rough faying surfaces resulting in an increase in the friction coefficient. This large friction coefficient could, in turn, increase the degree of fretting damage. Inevitably, corrosion combined with fatigue damage can form in aircraft, which could lead to catastrophic failure of a structure. The build-up of corrosion products can cause out-of-plane deformations, i.e. pillowing, in the lap joint overlap region, which can significantly increase the stress in lap joints.
Previously, a project on the study of corrosion and its effect in fuselage lap joints of transport aircraft was conducted at the Institute for Aerospace Research. A mathematical model was developed to correlate the pillowing deformation to the degree of corrosion present in a joint.11 Pillowing was simulated using out-of-plane internal pressures caused by the corrosion within the overlap region. Three-dimensional linear finite element methods were carried out to study this effect on lap joints. The actual riveting process was not included and the rivet driven head dimension was artificially set in the FE models. The rivet clamp-up pressure was introduced by applying self-equilibrated compressive stress to the two rivet ends. Insightful results about the stress condition were obtained.10-14 Then, a project was initiated to develop numerical modeling and methodologies to study the riveting process and its effect on riveted lap joints. Effects of the riveting process on the residual stress/strain in joints were studied experimentally and numerically.15-17 Two-dimensional nonlinear FE methods were used to simulate the actual riveting process, and insightful information on the residual stress/strain distribution and drive head dimension versus the applied rivet squeeze force was obtained.16, 17 The effect of the residual stress on the stress variation during tensile loading for countersunk riveted lap joints was successfully studied using 3D FE methods with the aid of relevant experimental tests.18, 19 Both the riveting process and the tensile loading stage were included in these 3D FE analyses. The material elastoplastic constitutive relationship and geometric non-linear properties, as well as nonlinear contact boundary conditions, were included in the numerical models.16-19
A literature review1-19 showed that there was little quantitative study available on the effect of the clearance fit and friction coefficient on the stress/strain variation in triple-row countersunk riveted lap joints. Furthermore, an accurate numerical analysis of the corrosion pillowing effect on the stress state in lap joints is also needed. To achieve an accurate assessment of the joint fatigue performance, the effects of fastener clearance fit, friction coefficient, and corrosion pillowing on the stress condition in the fastener hole vicinity should be understood.
In this paper, three different squeeze forces were used to install the rivets. After riveting, the lap joints were loaded in tension to a maximum remote stress of 98.6 MPa.18, 19 Rivet driven head deformation and measured strain were used to validate the numerical modeling. Then, a parametric study was carried out using the validated 3D nonlinear finite element methods to address issues that could not be looked into directly in the experimental tests. The main objective of this work was to accurately quantify the stress state in riveted lap joints under key factors, to use the obtained stress information to explain existing fatigue data scatter, and then to improve the prediction capability on the fatigue life of fuselage lap joints.
II. Experimental Details
A. Joint and Strain Gauge InformationA total of three strain gauged lap joint specimens were tested in the validation stage for an accurate numerical modeling methodology. Triple-row countersunk riveted 25.4 mm wide lap joints were prepared. Each joint consisted of two 1.60 mm thick Al 2024-T3 alloy bare sheets, riveted with three Al 2117-T4 alloy countersunk-type MS20426AD5-6 rivets. Joint configuration and dimensions are given in Figure 1. The total joint length L was 337.72 mm. Tabs with dimensions of 50×25.4×1.60 mm were clamped with the ends of each joint to eliminate the
T
3
initial secondary bending moment that would be induced when the joints were installed in the load frame. The rivet protruding height, Ho, was 6.06 mm. Based on the optical measurements of nine holes in three lap joints, the sheet mean protruding hole diameter, Dhole, was 4.09 mm. The rivet shank diameter, D, was 3.97 mm, and the mean radial
clearance fit between the rivet and protruding hole was calculated to be 0.06 mm.
(a) Triple-row riveted lap joint
(b) Countersunk rivet before riveting process
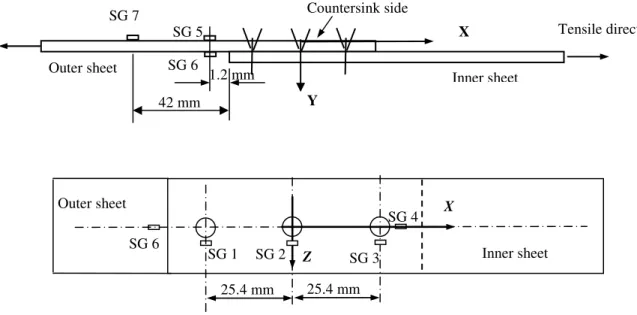
Figure 1. (a) Diagrams of the 25.4 mm wide lap joint with three countersunk rivets and (b) rivet configuration before the riveting process (dimensions: mm).
Micro-strain gauges were used to capture the strain variations during the test.15-19 All the micro-strain gauges pointed in the longitudinal (tensile) direction, as shown in Figure 2. The global coordinate frame origin was set at the middle fastener hole centre. Strain gauges 1 to 4 were mounted on the inner sheet surface before riveting in order to capture the strain variation during the riveting process. Strain gauges 5 to 7 were mounted after riveting. Micro-strain gauges 1 to 3 were MM EA-13-031DE-350 type with a gauge factor of 2.06±1.0% and transverse sensitivity of (1.2±0.2)% at 24oC. Micro-strain gauges 4 to 7 were MM EA-13-031EC-350 type with a gauge factor of 2.09±1.0% and transverse sensitivity of (0.4±0.2)% at 24oC. Gauges 1 to 3 were used to measure the strain values in the hoop direction and gauge 4 was used to measure the radial strain during the riveting process. All the gauges were reset to zero and then used to measure the longitudinal strain variations during the tensile loading stage. Secondary bending, at the overlap end, was estimated from the strain values in gauges 5 and 6. Gauge 7 was used to measure the far field strain.
To avoid possible damage to the strain gauges by the large rivet driven head deformation and difficulties in gauge setup, gauges 1 to 4 were mounted more than 2.5 mm away from the hole edge. Table 1 gives these micro-strain gauge locations. The positions of the micro-strain gauges 1 to 4 were identified relatively to their nearby local fastener hole centres, and the positions of the strain gauges 5 to 7 were measured relative to the overlap end. Since the gauges were not located within the hole vicinity and the joint maximum remote tensile stress was less than one third of the sheet initial yield stress, the measured strains were much less than the strain gauge limit of
50 Pitch: 25.40 Tab Edge = 8.94 t = 1.60 1000 countersink side t = 1.60 1. L = 337.72
Joint tensile direction Clamped side
Top rivet row
Clearance fit Inner sheet Protruding height Ho Outer sheet D Dhole
4
approximately 3%. Thus, the influences of the gauge transverse sensitivity and nonlinearity on the measured strains were not considered. Each strain-gauged specimen was tested using one of the three different rivet squeeze forces of 10, 14, and 18 kN.
Figure 2. Micro-strain gauge arrangements in a joint coupon (not to scale).
Table 1 Locations (mm) of the micro-strain Gauges 1 to 4, Figure 2
Inner sheet surface (mounted before riveting) Outer sheet surface (mounted after riveting)
Gauge 1 Gauge 2 Gauge 3 Gauge 4 Gauge 5 Gauge 6 Gauge 7
z-position (± 0.4)* (absolute value)
x-position
(± 0.4)* Distance to the overlap edge
6.1 6.2 6.5 6.5 1.2 1.2 42
*The gauge length was around 0.8 mm. The positions of strain gauges 1 to 4 were measured between the adjacent hole centre and the gauge centre, and the positions of strain gauges 5 to 7 were identified relatively to adjacent overlap end.
B. Testing Equipment And Loading Condition
Lap joint specimens were riveted and then loaded in tension using a 250 kN MTS load frame. In order to avoid both thermal and inertial effects on the material properties, a small constant load ramp of 111.2 N per second was chosen for all the rivet installations.15-19 This rate is much slower than that used in the actual riveting process. The three rivets were installed one by one starting from the centre rivet. To keep the same riveting condition for each coupon, the coupons were held firmly to a mobile heavy metal plate. The gauges were reset to zero before the next riveting process to avoid any potential disturbances to both gauges and coupon. After riveting, the joints were loaded in tension to a maximum remote stress of 98.6 MPa. The tensile loading rate was 0.5 mm/minute.
42 mm SG 5 SG 6 SG 7 Outer sheet Inner sheet Y Tensile direction Countersink side 1.2 mm X 25.4 mm Z SG 6 SG 4 25.4 mm SG 1 X Inner sheet Outer sheet SG 2 SG 3
5
III. Finite Element Simulations
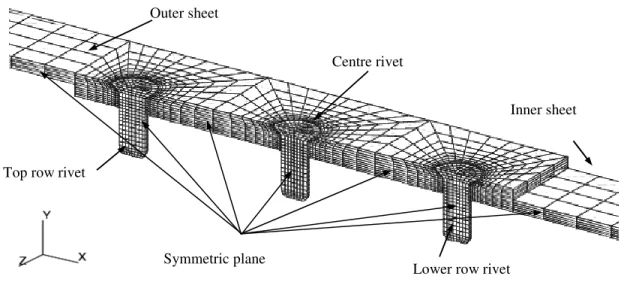
A. Finite Element ModelingThe finite element (FE) model was generated in accordance with the experimental joints using the FE software packages MSC.Patran (pre- and post-processor) version 2005r2 and MSC.Marc version 2005 (solver). Due to the joint symmetry, only half of the joint was modeled. A total of 12,362 nodes and 9,096 8-node three-dimensional reduced integration brick elements (type 117) were used. The meshed overlap region of the lap joint is shown in Figure 3. Symmetric boundary conditions were applied to the joint centre plane along the longitudinal x direction. Joint displacement boundary and loading conditions were the same as that of the experimental tests. Element type 117 is an 8-node isoparametric arbitrary hexahedral for general three-dimensional applications using reduced integration, which is preferred over high-order elements when used in a contact analysis.21
Five deformable contact bodies, two sheets and three rivets, four rigid contact bodies, three pushers to squeeze the rivet driven heads and one rigid set contacting the joint bottom surface during the riveting process, were defined in the model. Multiple load steps with their specific boundary conditions were defined in the loading sequence. Load steps 1 and 2 applied the squeeze force to the centre pusher to squeeze the centre rivet and then released the squeeze force to 0; load steps 3 and 4 applied the squeeze force to the top rivet pusher to install the top rivet and then released the squeeze force to 0; Load steps 5 and 6 did the same to the lower fastener; and load step 7 applied the in-plane loading to the joint, up to a maximum stress of 98.6 MPa. In the final load step, the three deformable bodies contacted each other while the rigid bodies were deactivated. A friction coefficient of 0.2 was used in the Coulomb friction law for all contact surfaces.6 A force-controlled riveting method was used in this numerical study. The same squeeze force was used to install all three rivets in the joint. Details on the displacement boundary conditions, and contact pairs in each load case are fully described elsewhere.19
Figure 3. Overlap region of the lap joint in the three-dimensional finite element model.
Symmetric plane
Inner sheet Outer sheet
Top row rivet
Lower row rivet Centre rivet
6
B. Material Parameters
The material parameters used were the same as that used in [15-19]. An isotropic hardening behavior was assumed for both the rivet and sheet materials. The material constants C and m were calculated by substituting the uni-axial tensile test data into Equation (1).
(
)
m truetrue C ε
σ = (1) A
The true stress and plastic strain values were entered into MSC.Patran, which uses linear interpolation for values between the points to implement the hardening behavior in the model. The material parameters for the 2117-T4 Al alloy MS20426ADx-x rivet6, 15-20 and 2024-T3 Al alloy bare sheet15-20 are summarized in Tables 2 and 3, respectively.
Table 2 Elastic and plastic properties for MS20426AD5-6 rivet material
Parameter of rivet Value
Young’s modulus 71.7 GPa
Poisson’s ratio 0.33
Initial yield stress, σy 172 MPa
Hardening parameters when 0.02 ≤εtrue ≤ 0.10 C = 544 MPa and m = 0.23
Hardening parameters when 0.10< εtrue ≤ 1.0 C = 551 MPa and m = 0.15
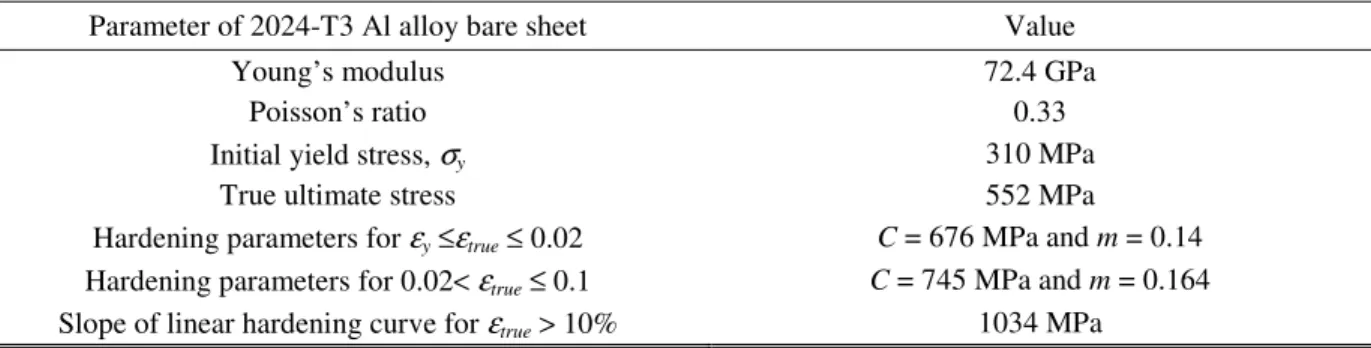
Table 3 Material parameters for 1.60 mm thick 2024-T3 Al alloy bare sheet
Parameter of 2024-T3 Al alloy bare sheet Value
Young’s modulus 72.4 GPa
Poisson’s ratio 0.33
Initial yield stress, σy 310 MPa
True ultimate stress 552 MPa
Hardening parameters for εy ≤εtrue ≤ 0.02 C = 676 MPa and m = 0.14
Hardening parameters for 0.02< εtrue ≤ 0.1 C = 745 MPa and m = 0.164
Slope of linear hardening curve for εtrue > 10% 1034 MPa
IV. Results And Discussion
A. Comparison of Experimental And Numerical Results1. Joint Deformation
To eliminate the influence of the rivet dimensions, the normalized variation of the rivet driven head deformation,
D
maxD
, versus the nominal rivet squeeze stress (NRSS), was determined in previous riveting process tests. Three different single-riveted-joint cases were considered, and four different rivet squeeze forces were used for each case. The three different joint cases were: (i) countersunk type MS20426AD6-7 rivets with 1.60-mm-thick claded 2024-T3 Al alloy sheets, (ii) MS20426AD8-9 rivets with 2.03-mm-thick bare 2024-T3 Al alloy sheets, and (iii) MS20426AD8-9 rivets with 2.11-mm-thick claded 2024-T3 Al alloy sheets. Variations in the three sets of rivet driven head deformations versus rivet squeeze stress could be estimated using the following regression expression:(
0.99)
433 . 1 0.3322 2 max = R = D D NRSS σ (2) Awhere D is the rivet shank diameter, Dmax is the rivet maximum deformed shank diameter, R2 is a data fit degree indicator. The power law regression equation is valid for nominal rivet squeeze stress
σ
NRSS within the range of [0.75GPa, 1.75GPa], expressed without the GPa dimension. The corresponding nominal rivet squeeze stress (NRSS) is defined in the following Equation (3).7
A RSF
NRSS =
σ (3) A
where
RSF
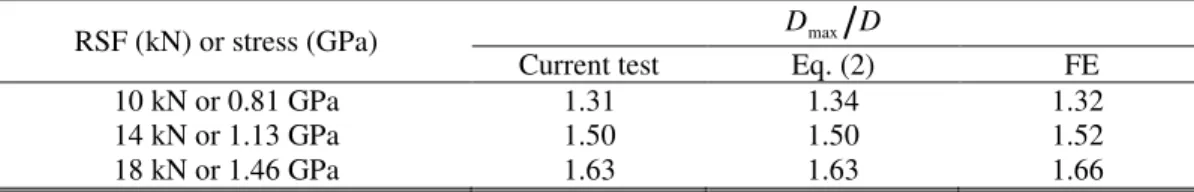
is the rivet squeeze force, and A is the cross-sectional area of rivet shank.Rivet driven head deformations in the MS20426AD5-6 rivet obtained from the experimental and numerical results using the 18 kN RSF, are shown in Figure 4. Comparisons of this rivet driven head deformations are summarized in Table 4. Large rivet squeeze forces induced large driven head deformations. Good agreement was achieved for the rivet driven head deformation from the numerical simulations. The relative difference in the rivet driven head deformation, Dmax D, was within 2.3% between the experimental results and regression prediction (Eq. (2)), and 2% between the experimental and FE results. Due to the elimination of the dimensional effects, the regression expression of Eq. (2) could be used to predict the rivet driven head deformation of rivets of different dimensions.
(a)
Figure 4. MS20426AD5-6 rivet driven head deformations in the lap joint after the riveting process, using the 18 kN rivet squeeze force obtained from (a) experimental and (b) FE results.
Table 4 Rivet driven deformation obtained from current experimental tests, regression expression in Eq. (3), and finite element analysis (FEA) results
RSF (kN) or stress (GPa) Dmax D
Current test Eq. (2) FE
10 kN or 0.81 GPa 1.31 1.34 1.32
14 kN or 1.13 GPa 1.50 1.50 1.52
18 kN or 1.46 GPa 1.63 1.63 1.66
2. In-situ Quantitative Comparisons during the Riveting Process
Due to the distance between the rivets, the riveting process did not influence the adjacent holes.19 For comparison purposes, the experimental average hoop strains for gauges 1 to 3 (
3 3 2 1 G G G avg ε ε ε ε = + + ) were
used because the holes were located at similar positions relative to each other. Comparisons of the average hoop strain from gauges 1 to 3 and the radial strain from gauge 4, during the riveting process, are presented in Figure 5. The tensile hoop strain and the compressive radial strain were measured during the riveting process. A small elastic recovery was observed in the radial direction from the numerical simulations. A similar trend, without the evident strain reversal, can be observed from the experimental results. The reversal strain occurred in previous test results,18 which could have resulted from the clearance that was present between the sheet/rivet hole interface and the rivet
(b)
1 2 3
8
standing position (distance of rivet head above sheet surface) during the riveting process. Generally, the difference between the numerical predictions and experimental results is smaller after riveting. For example, a large difference in gauge 4 (radial strain) is observed at a squeeze force of approximately 8 kN during the riveting process (using the 14 and 18 kN forces) but the final difference is less than 10% after riveting.
(a) Average hoop strain of strain gauges 1 to 3 (b) Radial strain in strain gauge 4
Figure 5. Comparison of the variations of the hoop and radial strains on the joint inner surface, during the riveting process using the three different rivet squeeze forces (RSF).
3. In-situ Quantitative Comparisons during the Tensile Loading Stage
Quantitative strain comparisons, during the tensile loading stage, were carried out after the riveting process comparisons to further validate the numerical results. In order to compare the experimental and numerical results, the experimentally measured residual strains were used as the starting values for gauges 1 to 4 during the tensile loading stage. For the other gauges, mounted after riveting, the residual strain values obtained from the numerical simulations were the starting values during the tensile loading stage.
Strain Variations in the Joint Overlap Region
Gauge 1 was on the inner sheet near the top rivet row and showed that the tensile hoop strain initially increased and then slightly decreased with increasing tensile load, as shown in Figure 6. This result was dominantly influenced by the secondary bending. The trends obtained from the experimental and numerical results in gauge 3 were slightly different for a remote tensile stress between zero and 60 MPa, after which the results compared fairly well. The reason for this discrepancy could be the numerical error in dealing with secondary bending and the contact between the rivets and the sheets.
-20 -15 -10 -5 0 -0.05 0 0.05 0.1 0.15 0.2 R iv e ti n g f o rc e ( k N )
Hoop strain (%) during the riveting process
Exp. using 10 kN RSF FE using 10 kN RSF
Exp. using 14 kN RSF FE using 14 kN RSF
Exp. using 18 kN RSF FE using 18 kN RSF
-20 -15 -10 -5 0 -0.2 -0.15 -0.1 -0.05 0 0.05 R iv e ti n g f o rc e ( k N )
Radial strain (%) during the riveting process Exp. using 10 kN RSF FE using 10 kN RSF Exp. using 14 kN RSF FE using 14 kN RSF Exp. using 18 kN RSF FE using 18 kN RSF
9
(a) (b)
(c) (d)
Figure 6. Comparison of the strain variations in strain gauges 1 to 4 joints during the tensile loading stage, after riveting using the three different rivet squeeze forces (RSF).
Strain Variations at the Joint Overlap End
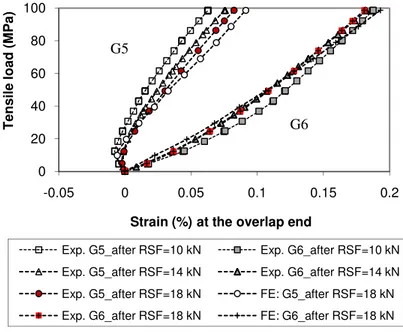
Strain gauges 5 and 6 were mounted near the joint overlap to estimate the secondary bending moment when the joint was in tension. As shown in Figure 7, the bending strain ,
(
ε
G6 −ε
G5)
2,at that location slightly decreased withincreased rivet squeeze forces. The bending strains at that cross-sectional section were approximately 0.06225%, 0.05352%, and 0.04926% for the joints in tension up to 98.6 MPa remote stress after their specific riveting processes using the 10, 14, and 18 kN forces, which showed that large rivet squeeze force could increase the integrity for the joint structures. Good agreement was achieved between the experimental and FE result for each specific riveting condition. For clarity, only the FE results for the joint riveted using the 18 kN force were plotted with these experimental results. The relative errors between the numerical and experimental strain results increased with the increment of remote force, and the maximum errors were approximately 10% in gauge 5 and 6% in gauge 6, when the remote tensile stress was 98.6 MPa.
0 20 40 60 80 100 0 0.05 0.1 0.15 0.2 0.25 T e n s il e l o a d ( M P a ) Strain (%) of Gauge 1 Exp. after RSF=10 kN FE after RSF=10 kN Exp. after RSF=14 kN FE after RSF=14 kN Exp. after RSF=18 kN FE after RSF=18 kN
0 20 40 60 80 100 0 0.05 0.1 0.15 0.2 0.25 T e n s il e l o a d ( M P a ) Strain (%) of Gauge 2
Exp. afterRSF=10 kN FE after RSF=10 kN
Exp. after RSF=14 kN FE after RSF=14 kN
Exp. after RSF=18 kN FE after RSF=18 kN
0 20 40 60 80 100 0 0.05 0.1 0.15 0.2 0.25 T e n s il e l o a d ( M P a ) Strain (%) of Gauge 3
Exp. after RSF=10 kN FE after RSF=10 kN Exp. after RSF=14 kN FE after RSF=14 kN Exp. after RSF=18 kN FE after RSF=18 kN
0 20 40 60 80 100 -0.2 -0.15 -0.1 -0.05 0 0.05 T e n s il e s tr e s s ( M P a ) Strain (%) of Gauge 4
Exp. after RSF=10 kN FE after RSF=10 kN Exp. after RSF=14 kN FE after RSF=14 kN Exp. after RSF=18 kN FE after RSF=18 kN
10
Figure 7. Comparison of the strain variations in strain gauges 5 and 6 at the overlap end during the tensile loading stage, after releasing the three different rivet squeeze forces.
Remote Strain Variations
The longitudinal remote strain variations in gauge 7 for the three joints are plotted in Figure 8. These experimental results were almost identical and correlated well with the FE results. For clarity, only one set of FE results were used to compare with experimental data. The remote strain was within the elastic range of the material and the rivet squeeze force did not influence the joint remote strain variations.
.
Figure 8. Comparison of the strain variations in strain gauge 7 at the remote position during the tensile loading stage, after releasing the three different rivet squeeze forces.
0 20 40 60 80 100 -0.05 0 0.05 0.1 0.15 0.2 T e n s il e l o a d ( M P a )
Strain (%) at the overlap end
Exp. G5_after RSF=10 kN Exp. G6_after RSF=10 kN Exp. G5_after RSF=14 kN Exp. G6_after RSF=14 kN Exp. G5_after RSF=18 kN FE: G5_after RSF=18 kN Exp. G6_after RSF=18 kN FE: G6_after RSF=18 kN
G5 G6 0 20 40 60 80 100 0 0.05 0.1 0.15 T e n s il e l o a d ( M P a )
Remote strain (%) of Gauge 7
Exp. after RSF=10 kN Exp. after RSF=14 kN Exp. after RSF=18 kN FE after RSF=18 kN
11 Discussion
Generally, good agreement was achieved between the experimental and numerical results in both rivet driven head deformation and strain variations. It could be drawn from these strain comparisons that the residual stress, induced by the riveting process and stress conditions during the joint tensile loading stage, could be analyzed using the current numerical methods with reasonable accuracy.
The discrepancy between the experimental and FEM predictions could be explained by the following: (i) inaccuracies in the constitutive models beyond yielding for the sheet and rivet used in the model; (ii) perfect assumptions made for the material properties and perfect geometry surfaces; (iii) differences in how the strain values were obtained, the strain was determined from a point/node in the FE model, while it was averaged over the gauge area in the experiments; and (iv) numerical errors in the FE model, etc.
B. Parametric Study of Various Effects on the Stress State in the Lap Joint
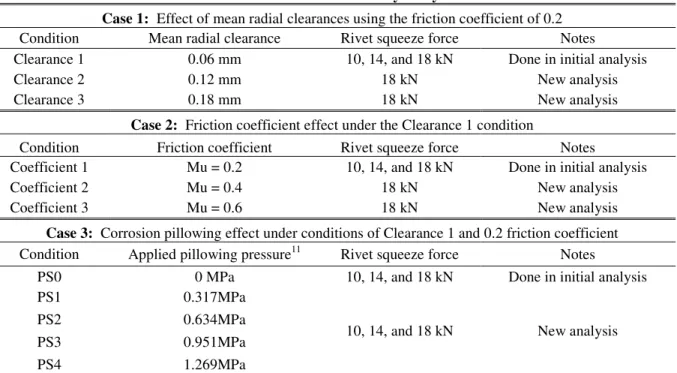
Three additional factors were studied: (i) clearance fit between the sheet/rivet interface, (ii) friction coefficient, and (iii) corrosion pillowing. As listed in Table 5, two additional clearances of 0.12 mm and 0.18 mm were considered along with the initial value of 0.06 mm. An identical clearance fit was introduced into three fastener holes for each joint. Two additional friction coefficients of 0.4 and 0.6 were considered besides the initial value of the 0.2; and four different corrosion pilling conditions were studied in the initial FE model with the 0.06 mm clearance and 0.2 friction coefficient. For the effect study on the clearance fit and friction coefficient, only the joint riveted using the 18kN force was numerically evaluated.
For the corrosion study, pillowing pressure was introduced to the faying surfaces after the riveting process stage, before the joint was loaded in tension to a maximum stress of 98.6 MPa. A total of four different uniform pillowing pressures of 0.317 MPa, 0.634 MPa, 0.951 MPa, and 1.269 MPa were applied to the pitch areas, between the top and bottom rivet row centres. Tapered pillowing pressures, varying linearly from 0 at both overlap ends to uniform at the neighboring fastener hole centre position, were applied. The relationship between the material loss caused by corrosion and the pillowing pressure, can be found elsewhere.11 The four none zero internal pressures in Table 5 were induced by relative sheet thickness losses of 2.5%, 5%, 7.5%, and 10%.
Table 5 Parametric study analyses
Case 1: Effect of mean radial clearances using the friction coefficient of 0.2
Condition Mean radial clearance Rivet squeeze force Notes
Clearance 1 0.06 mm 10, 14, and 18 kN Done in initial analysis
Clearance 2 0.12 mm 18 kN New analysis
Clearance 3 0.18 mm 18 kN New analysis
Case 2: Friction coefficient effect under the Clearance 1 condition
Condition Friction coefficient Rivet squeeze force Notes
Coefficient 1 Mu = 0.2 10, 14, and 18 kN Done in initial analysis
Coefficient 2 Mu = 0.4 18 kN New analysis
Coefficient 3 Mu = 0.6 18 kN New analysis
Case 3: Corrosion pillowing effect under conditions of Clearance 1 and 0.2 friction coefficient
Condition Applied pillowing pressure11 Rivet squeeze force Notes
PS0 0 MPa 10, 14, and 18 kN Done in initial analysis
PS1 0.317MPa
10, 14, and 18 kN New analysis
PS2 0.634MPa
PS3 0.951MPa
PS4 1.269MPa
1. Hoop Stress Variations along Prescribed Transverse Path
In fatigue tests of non-corroded joints, cracks typically originate in the outer sheet heavily fretted area around the top rivet hole, a short distance away from the hole edge.9 Thus, it was decided to study the effects of (i) the clearance fit and (ii) the friction coefficient on the hoop stress variation at the top rivet row along a transverse path
12
on the outer sheet faying surface. This path is perpendicular to the joint longitudinal tensile direction. For clarity, the effect of the rivet squeeze force was also considered with the above effects. As shown in Figure 9(a), large rivet squeeze forces increased the magnitude of the compressive residual hoop stress at the hole edge vicinity, and moved the peak tensile stress a short distance away from the hole edge. The maximum residual compressive hoop stress was at the hole edge with the value of 138.73 MPa for the 10 kN RSF, 160.71 MPa for the 14 kN RSF, and 206.95 MPa for the 18 kN RSF. The peak tensile stresses are close to each other with an approximate value of 90 MPa. The effects of the rivet squeeze force, clearance fit, and friction coefficient on the hoop stress for the joint loaded in tension are presented in Figure 9(b) to (d).
For a joint remote tensile stress of 98.6 MPa (Figure 9(b)), the hoop stress at the hole edge was approximately 40 MPa for the 10 kN RSF riveted joint, 57.8 MPa for the 14 kN RSF riveted joint, and 69.2 MPa for the 18 kN RSF riveted joint.
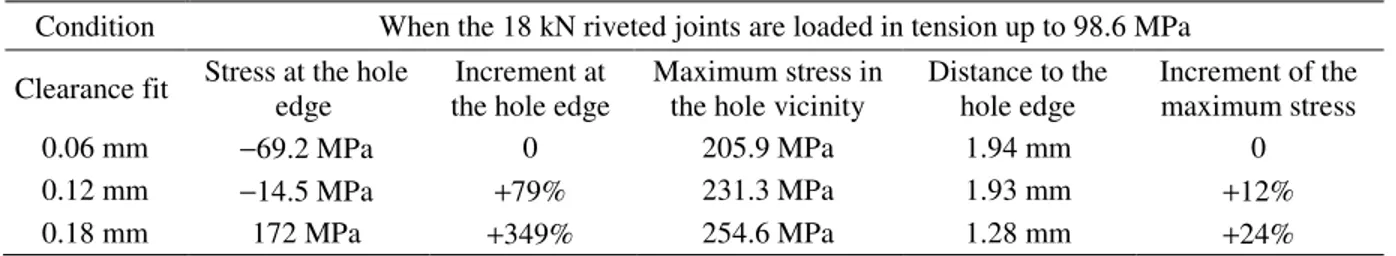
A significant influence of the clearance fit on the hoop stress can be noticed from Figure 9(c) for both the edge stress and the peak stress in the hole vicinity. Information on the stress at the hole edge and peak position is summarized in Table 6. It can be seen from Figure 9(c) and Table 6 that a large clearance fit of 0.18 mm can completely counteract the benefit induced by the riveting process using the large RSF of the 18 kN. The distance between the location of the maximum stress and the hole edge decreased from 1.94 mm to 1.28 mm, when the large clearance fit from the 0.06 mm to 0.18 mm was used. This finding strongly suggests that the fatigue strength of lap joints with large clearance fits would be seriously reduced, which is consistent with available experimental results.23
Table 6 Increment (%) in the hoop (longitudinal) stress as compared to the joint with the 0.06 mm clearance fit
Condition When the 18 kN riveted joints are loaded in tension up to 98.6 MPa Clearance fit Stress at the hole
edge
Increment at the hole edge
Maximum stress in the hole vicinity
Distance to the hole edge Increment of the maximum stress 0.06 mm −69.2 MPa 0 205.9 MPa 1.94 mm 0 0.12 mm −14.5 MPa +79% 231.3 MPa 1.93 mm +12% 0.18 mm 172 MPa +349% 254.6 MPa 1.28 mm +24%
In the study of the effect of the friction coefficient on the stress state in joints, a clearance fit of the 0.06 mm was used for all the FE models. From Figure 9(d), it can be seen that the friction coefficient had a certain impact on the edge stress. However, the magnitude and location of the peak tensile hoop stress was not affected by the friction coefficient. The hole edge and peak hoop stresses were approximately 69.2 and 205.9 MPa for the joint with the 0.2 friction coefficient, 110.9 and 218.2 MPa for the joint with the 0.4 friction coefficient, and 134.1 and 218.8 MPa for the joint with the 0.6 friction coefficient. For aging aircraft due to the existence of heavy fretting damage, the contact surface becomes coarser and thus the friction coefficient would increase and is assumed to be greater than the initial 0.2 value.
2. Variations in the Contact and Friction Stresses
Variations in the contact and friction stresses along the joint axial (longitudinal) path on the faying surface of the outer sheet were examined, and the results are presented in Figure 10. It can be seen that: (i) the contact stress was only distributed in a very small region in the hole vicinity, and the largest stress was located at the hole edge; (ii) a large friction coefficient generated a large contact stress, the maximum contact stress being approximately 300 MPa for the 0.2 friction coefficient, 360 MPa for the 0.4 friction coefficient, and 390 MPa for the 0.6 friction coefficient after the riveting process (Figure 10(a)); (iii) the contact stress increased, especially for the 0.2 friction coefficient case (Figure 10(b)), when the joints were loaded to a remote tensile stress of 98.6 MPa; and (iv) the magnitude of the friction stress was much lower than the contact stress (Figure 10(c)). The difference between the friction and contact stresses could be due to the relatively small movement that occurs between the inner and outer sheets. The maximum contact stress was different for all three holes when the joint was subjected to a remote tensile stress of 98.6 MPa. This extremely complicated loading situation involved the load transmission, secondary bending, contact among the rivets and sheets, friction between contact pairs, stress concentration at the existing hole, non-linearities in both materials, and the geometric deformation conditions.
13
3. Corrosion Pillowing Effect on the Hoop Stress Variation
After the riveting process, internal pressure was applied to the faying surfaces to simulate corrosion pillowing. Pillowing deformation is the relative out-of-plane displacement between the two sheets. Limited impact of the rivet squeeze force (RSF) on the pillowing deformation was found from the numerical results, this deformation being dominated by the applied pillowing pressure value. The overall joint lateral deformations during the tensile loading stage are shown in Figure 11. Secondary bending occurred at the top rivet row position in the outer sheet as well as the bottom rivet row in the inner sheet near the overlap end. The maximum pillowing displacement occurred at the pitch centre and is summarized in Table 7. Numerical results showed that the pillowing slightly decreased when the joint remote stress was applied. The pillowing deformation is at most 5% of the overlap thickness (2×1.6 mm) for all the analyzed pressure cases.
Table 7 Pillowing deformation predicted by the finite element analysis
Thickness loss (%)11 Pillowing pressure (MPa)11
Relative pillowing displacement (mm) at pitch centre between the inner and outer sheets within the top and middle rivet rows
Before tension Remote tensile stress of 98.6 MPa
2.5 PS1 = 0.317 0.047 0.033
5 PS2 = 0.634 0.083 0.062
7.5 PS3 = 0.951 0.121 0.087
10 PS4 = 1.269 0.162 0.132
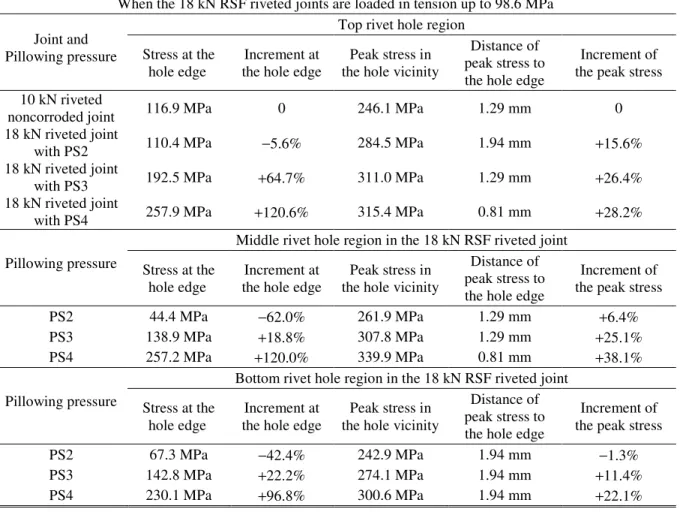
Crack nucleation usually first occurs in the top fastener hole vicinity on the outer sheet faying surface for the non-corrosion joint fatigue tests.9 However, this may not be the case in the presence of corrosion pillowing. To assess the strength in the three fastener hole regions, hoop stress variation along three transverse paths, on both the outer and inner sheet faying surfaces were studied. These lines were located along the three rivet rows on each faying surface, perpendicular to the joint longitudinal tensile direction. Numerical results showed that large rivet squeeze force (RSF) reduced the stress concentration at the hole edge and moved the peak tensile stress away. For clarity, only stress variations in the 18 kN RSF riveted joint, loaded in tension up to 98.6 MPa, are presented in Figure 12. The following characteristics can be observed from the figure: (i) the peak tensile hoop stresses near the three hole edges in the inner sheet were smaller than in the corresponding outer sheet; (ii) the top rivet hole in the outer sheet still had the highest tensile stress region when the pillowing stresses were small, within the range between PS0 = 0 and PS2 = 0.634 MPa; (iii) large corrosion pillowing pressures of PS3 = 0.951 and PS4 = 1.269 MPa greatly increased the stress magnitudes at all rivet holes, especially at the middle hole, while decreasing the differences in the stress magnitudes among the three holes. The middle hole region became a high stress area, as the top hole region for the high corrosion case of 1.269 MPa in the outer sheet. Hoop stress increments caused by the high pillowing pressure to the 18 kN riveted joint in tension is summarized in Table 8 and compared to the 10 kN RSF riveted non-corroded joint (i.e.: the PS0 = 0 pillowing pressure condition). These results suggest that the pillowing pressure could significantly decrease the joint strength, and the outer sheet appears to be the weakest element, especially in both top and middle row hole regions.
14
Table 8 Hoop stress increment (%) in the outer sheet as compared to the 10 kN RSF riveted non-corroded joint, caused by the different pillowing pressure, in the 18 kN RSF riveted joints
When the 18 kN RSF riveted joints are loaded in tension up to 98.6 MPa Joint and
Pillowing pressure
Top rivet hole region Stress at the
hole edge
Increment at the hole edge
Peak stress in the hole vicinity
Distance of peak stress to the hole edge
Increment of the peak stress 10 kN riveted
noncorroded joint 116.9 MPa 0 246.1 MPa 1.29 mm 0
18 kN riveted joint
with PS2 110.4 MPa −5.6% 284.5 MPa 1.94 mm +15.6%
18 kN riveted joint
with PS3 192.5 MPa +64.7% 311.0 MPa 1.29 mm +26.4%
18 kN riveted joint
with PS4 257.9 MPa +120.6% 315.4 MPa 0.81 mm +28.2%
Pillowing pressure
Middle rivet hole region in the 18 kN RSF riveted joint Stress at the
hole edge
Increment at the hole edge
Peak stress in the hole vicinity
Distance of peak stress to the hole edge
Increment of the peak stress
PS2 44.4 MPa −62.0% 261.9 MPa 1.29 mm +6.4%
PS3 138.9 MPa +18.8% 307.8 MPa 1.29 mm +25.1%
PS4 257.2 MPa +120.0% 339.9 MPa 0.81 mm +38.1%
Pillowing pressure
Bottom rivet hole region in the 18 kN RSF riveted joint Stress at the
hole edge
Increment at the hole edge
Peak stress in the hole vicinity
Distance of peak stress to the hole edge
Increment of the peak stress
PS2 67.3 MPa −42.4% 242.9 MPa 1.94 mm −1.3%
PS3 142.8 MPa +22.2% 274.1 MPa 1.94 mm +11.4%
15
(a) Residual hoop stress after riveting (b) Effect of rivet squeeze force (in tension)
(c) Effect of clearance fit (in tension) (d) Effect of friction coefficient (in tension)
Figure 9. Variations in the hoop stress along the transverse path at the top row fastener on the outer sheet faying surface, where (a) is the residual hoop stress induced by the different rivet squeeze force, and the hoop stress distribution when the joint was loaded in tension up to 98.6 MPa under the effect of (b) rivet squeeze force, (c) clearance fit, and (d) friction coefficient.
-250 -200 -150 -100 -50 0 50 100 -7 -6 -5 -4 -3 -2 -1 H o o p s tr e s s ( M P a ) Transverse position (mm)
FE: after RSF=10 kN and before tension FE: after RSF=14 kN and before tension FE: after RSF=18 kN and before tension
Hole edges -100 -50 0 50 100 150 200 250 -7 -6 -5 -4 -3 -2 -1 H o o p st re s s (M P a ) Transverse position (mm)
FE: Tension after RSF=10 kN FE: Tension after RSF=14 kN FE: Tension after RSF=18 kN
Hole edges -100 -50 0 50 100 150 200 250 300 -7 -6 -5 -4 -3 -2 -1 H o o p s tr e s s ( M P a ) Transverse position (mm)
FE: 0.06 mm clearance fit after RSF=18 kN FE: 0.12 mm clearance fit after RSF=18 kN FE: 0.18 mm clearance fit after RSF=18 kN
Hole edge -150 -100 -50 0 50 100 150 200 250 -7 -6 -5 -4 -3 -2 -1 H o o p s tr e s s ( M P a ) Transverse position (mm) FE: Mu=0.2 after RSF=18 kN FE: Mu=0.4 after RSF=18 kN FE: Mu=0.6 after RSF=18 kN
16
(a) Riveted joints before tension
(b) Joints loaded using the 98.6 MPa tensile stress
(c) Friction stress with the joints loaded using the 98.6 MPa tensile stress
Figure 10. Effects of friction coefficient on the contact and friction stresses along the joint axial position. The coefficient of friction set at 0.2, is expressed by , 0.4 by ∆∆∆∆, and 0.6 by οοοο in the figure.
0 100 200 300 400 500 -40 -20 0 20 40 C o n ta c t s tr e s s ( M P a ) b e fo re te n s io n
Joint axial position (mm) Top rivet hole
0 100 200 300 400 500 600 -40 -20 0 20 40 C o n ta c t s tr e s s ( M P a ) d u ri n e te n s il e l o a d in g
Joint axial position (mm) Top rivet hole
0 2 4 6 8 10 12 14 -40 -20 0 20 40 F ri c ti o n s tr e s s ( M P a ) d u ri n g te n s il e l o a d in g
Joint axial position (mm) Top rivet hole
17
(a) Entire joint deformation enlarged 10 times
(b) Joint over lap region deformation enlarged 10 times
(c) True deformation for the riveted lap joint riveted using the 18 kN squeeze force
Figure 11. Deformation of the lap joint with the pillowing pressure of the PS4 = 1.296 MPa in pitch area and tapered in overlap edge areas, for joint remote tensile stress of 98.6 MPa.
18
(a) Top hole position
(b) Middle hole position
(c) Bottom hole position
Figure 12. Hoop stress variations along the three transverse paths, for remote tensile stress of 98.6 MPa. The lap joints were riveted using the 18 kN force and different pillowing pressure: €€€€: PS0 = 0, : PS1 = 0.317, ∆∆∆∆: PS2 = 0.634, ×: PS3 = 0.951, and ΟΟΟΟ: PS4 = 1.269 MPa. -300 -200 -100 0 100 200 300 -8 -7 -6 -5 -4 -3 -2 -1
Transverse position (mm) at top hole on inner sheet H o o p s tr e s s ( M P a ) -300 -200 -100 0 100 200 300 -8 -7 -6 -5 -4 -3 -2 -1
Transverse position (mm) at middle hole on inner sheet H o o p s tr e s s ( M P a ) -300 -200 -100 0 100 200 300 -8 -7 -6 -5 -4 -3 -2 -1
Transverse position (mm) at bottom hole on inner sheet H o o p s tr e s s ( M P a ) -150 -50 50 150 250 350 -8 -7 -6 -5 -4 -3 -2 -1
Transverse position (mm) at bottom hole on outer sheet H o o p s tr e s s ( M P a ) Hole edge -150 -50 50 150 250 350 -8 -7 -6 -5 -4 -3 -2 -1
Transverse position (mm) at top hole on outer sheet H o o p s tr e s s ( M P a ) Hole edge -150 -50 50 150 250 350 -8 -7 -6 -5 -4 -3 -2 -1
Transverse position (mm) at middle hole on outer sheet H o o p s tr e s s ( M P a ) Hole edge
19
C. Full-Field Stress Contours
The full-field stress distributions can provide insightful information. The maximum principal stress during the tensile loading stage is of great importance in the study of crack nucleation.
1. Effects of RSF, Clearance Fit, And Friction Coefficient
Effect of RSF on the maximum principal stress is presented elsewhere.19 A high rivet squeeze force moved the high stressed region away from the vicinity of the hole edge, and large maximum principal stress mainly occurred at the top rivet row region. The large maximum principal stress distribution area and shape were consistent with experimental fatigue testing results on non-corroded joints.9
Effects of clearance fit on the maximum principal stress condition on the outer-sheet faying surface is shown in Figure 13, with the 18 kN RSF riveted lap joints loaded to a remote tensile stress of 98.6 MPa. The 0.2 friction coefficient was used in the Coulomb friction law for this effect assessment. The peak maximum principal stress in the top rivet region considerably increased with the increment in the clearance fit, which intersected the top fastener hole for both the 0.12 and 0.18 mm clearance fit conditions. This intersection occurred at approximately 45° for the 0.12 mm clearance fit joint, and near 90° for the 0.18 mm clearance fit joint, relative to the joint longitudinal tensile direction. Similar intersection location and degree of the stress increment were observed for the middle hole. A fatigue crack could originate at the location with the great maximum principal stress for each clearance fit. Given the high stress, combined with its higher distribution area for the 0.18 mm clearance fit, a crack would nucleate and grow more quickly than in the other joints. These different crack locations were also found experimentally,9, 14, 23, 24 which may be explained, based on the current numerical results, by the presence of different clearance fits induced by the manufacturing process.
Figure 14 presents the maximum principal stress condition obtained from the model using different friction coefficients in the Coulomb friction law. The 18 kN RSF riveted joints with the 0.06 mm clearance fit were loaded in tension to a remote stress of 98.6 MPa. It can be seen from this figure that the peak stress and its area were slightly increased with increments of the friction coefficient. However, the location of the peak stress was not changed.
2. Corrosion Pillowing
Both the outer and inner sheet faying surfaces were chosen for a clear investigation of this issue. The maximum principal stresses for joints loaded in tension of the 98.6 MPa stress, under the PS4 = 1.296 MPa corrosion pillowing condition, are presented in Figure 15. Comparing with Figure 13(a), it can be seen that the pillowing pressure significantly affected the stress condition by creating a tensile stress in the hole vicinity, especially at the middle hole region in the outer sheet, with a peak of approximately 350 MPa. This large highly-stressed area is closer to the hole edges in the outer sheet than in the inner sheet. For comparison, the corresponding peak stress was approximately 250 MPa in non-corroded joints,19 meaning that the increase in the maximum principal stress magnitude compared to the non-corroded joint was approximately 40% for the PS4 = 1.296 MPa pillowing pressure. Due to the corrosion pillowing effect, the maximum principal stress and its area increased not only at the top rivet hole region, but also at the middle and, to a lesser degree, in the bottom rivet holes. The strength of the outer sheet was decreased more than that of the inner sheet, because both the stress magnitude and large stress area in the former were greater than in the latter. The middle hole region had the largest peak stress area for the outer sheet for PS4 = 1.296 MPa. Thus, areas in the vicinities of both the top and middle holes of the outer sheet would become the potential sites for an easy multiple-sited crack nucleation. The fatigue strength of the lap joints affected by severe corrosion would be significantly decreased, which is consistent with existing numerical and experimental results.10-14
20
(a) The joint with the 0.06 mm clearance fit
(b) The joint with the 0.12 mm clearance fit
(c) The joint with the 0.18 mm clearance fit
Figure 13. Effects of clearance fit of the (a) 0.06, (b) 0.12, and (c) 0.18 mm on the maximum principal stress (MPa) on the outer sheet faying surface for the 18 kN RSF riveted joints were loaded to a remote tensile stress of 98.6 MPa using the 0.2 friction coefficient in the Coulomb friction law.
Top rivet row hole Top rivet row hole Top rivet row hole
21
(a) Tensile load of 98.6 MPa using friction coefficient of 0.2 (i.e.: Figure 13(a))
(b) Tensile load of 98.6 MPa using friction coefficient of 0.4
(c) Tensile load of 98.6 MPa using friction coefficient of 0.6
Figure 14. Effects of the friction coefficient on the maximum principal stress (MPa) on the outer sheet faying surface for the 18 kN RSF riveted joint with the 0.06 mm clearance fit was loaded in tension using the Coulomb friction model after releasing the 18 kN rivet squeeze force.
22
Outer
Inner
(a) Joint with the pillowing pressure of the PS4 after releasing the 10 kN rivet squeeze force
Outer
Inner
(b) Joint with the pillowing pressure of the PS4 after releasing the 14 kN rivet squeeze force
Outer
Inner
(c) Joint with the pillowing pressure of the PS4 after releasing the 18 kN rivet squeeze force
Figure 15. Maximum principal stress (MPa) on both the outer and inner sheet faying surfaces, for a remote tensile stress of 98.6 MPa, as well as the PS4 = 1.296 MPa pillowing pressure within the overlap region.
23
V. Concluding Remarks
Both experimental and numerical studies of lap joints with three-row countersunk type rivets were carried out. In-situ strain values were measured using micro-strain gauges during the entire loading sequence. Good agreement was achieved between the experimental results and 3D FE predictions in the rivet driven head deformations and strain variations during the entire loading sequence.
The effects of the clearance fit and friction coefficient on the stress state in riveted lap joints were studied using three-dimensional finite element methods. The numerical results suggested that the clearance fit played a significant role in achieving high fatigue strength in riveted lap joints. Conversely, both the contact and friction stresses affected a very limited area, near the hole edge on the lap joint faying surface.
The hoop (longitudinal) stress variations along the transverse path, in the top rivet hole region on the outer sheet faying surface, were assessed. Both the hole edge hoop stress and the maximum hoop stress were significantly increased by a large clearance fit. When the clearance fit was increased from 0.06 mm to 0.18 mm, the hoop stress at the hole edge increased by +349%, and the peak hoop stress increased by +24% for the joint using the 0.2 friction coefficient. Furthermore, the distance between the location of the maximum stress and the hole edge decreased to 1.28 mm when the clearance fit 0.18 mm was used instead of 1.94 mm when 0.06 mm was used. Thus, large clearance fits would significantly reduce the joint fatigue strength and the clearance fit level must be taken into consideration when designing riveted lap joints.
Three possible crack nucleation sites were predicted from the different clearance fit models with the aid of the full-field maximum principal stress condition. For the 0.18 mm clearance fit joint, the crack could occur at the top rivet hole edge area, near 90° of the joint longitudinal tensile direction. For the joint with the 0.12 mm clearance fit, the crack could start at the top hole edge, at 45° of the joint longitudinal tensile direction, while for the joint with the 0.06 mm clearance fit, the crack could occur a short distance away from the hole edge.
Large friction coefficients increased the stress in the hole vicinity, especially for the contact and friction stresses between the inner and outer sheets. Generally, the friction stress was clearly smaller than the contact stress. Both the contact and friction stresses were located in very small areas in the hole vicinities. The maximum contact stress located at the hole edge was approximately 300 MPa for the 0.2 friction coefficient, 360 MPa for the 0.4 friction coefficient, and 390 MPa for the 0.6 friction coefficient after riveting. When the joints were loaded to a remote tensile stress of 98.6 MPa, the contact stress magnitude increased, especially for the 0.2 friction coefficient.
Effect of the corrosion pillowing on riveted lap joints was analyzed by introducing four different non-zero corrosion pillowing pressures into the overlap region. Corrosion pillowing could significantly increase the stress magnitude in the three fastener hole vicinities. The stress magnitude and area in the outer sheet were higher than in the inner sheet. For the outer sheet of the 18 kN RSF riveted joints loaded in tension up to 98.6 MPa stress, the large pillowing pressure of PS4 = 1.296 MPa increased the hoop stress at the hole edge by +120.6% for the top hole, +120% for the middle hole, and +96.8% for the bottom hole, compared to the joint riveted using the 10 kN rivet squeeze force without pillowing pressure (non-corroded joint). The corresponding increment in the maximum hoop stress in the hole vicinity was +28.2% for the top hole, 38.1% for the middle hole, and 22.1% for the bottom hole by the 1.269 MPa pillowing pressure in the 18 kN RSF riveted joint. The rivet squeeze force had limited effect on the maximum hoop stress in the hole vicinity of the outer sheet.
The full-field maximum principal stresses with pillowing in the riveted joints before tension and in tension were analyzed. Large maximum principal stresses were extended to the entire three row rivet hole regions with the existence of large corrosion pillowing pressure. Highly-stressed area was located at both the top and middle hole regions in the outer sheet if a pillowing pressure larger than PS2 was introduced. This suggests that multiple-sited damages could occur in corroded lap joints. This study shows that to safely operate aging aircraft, it is extremely important to accurately detect corrosion conditions in joint structures, and repair the highly corroded parts in time.
Acknowledgments
The financial assistance received from the Department of National Defence/Defence Research and Development Canada (DND/DRDC) is gratefully acknowledged. This work was also partially supported by Institue for Aerospace Research (IAR) and Analysis process/Engineered Solution (APES), Inc. collaboration on fretting fatigue program (46_QJ0_39). This work has been carried out under IAR Program 303 Aerospace Structures, Projects 46_QJ0_56 of the Short Crack Model Development. Our sincere acknowledgement to J.P. Komorowski and G. Eastaugh for their valuable discussions, suggestions, and help in the research. Many thanks to those people who have in one way or another contributed to the work.
24
References
1
Müller, R.P.G., “An Experimental and Analytical Investigation on the Fatigue Behavior of Fuselage Riveted Lap Joints”, Ph.D. Thesis, Delft Univ. of Technology, Delft, The Netherlands, 1995.
2
Fung, C-P. and Smart, J., “An Experimental and Numerical Analysis of Riveted Single Lap Joints”, Proceedings of the
institution of mechanical engineers, Part G: Journal of Aerospace Engineering, Vol. 208, No. 2, 1994, pp. 79-90. 3
Fung, C-P. and Smart J., “Riveted Single-Lap Joints. Part 1: A Numerical Parametric Study”, Proceedings of the institution
of mechanical engineers, Part G: Journal of Aerospace Engineering, Vol. 211, No. 1, 1997, pp. 13-27. 4
Markiewicz, E., Langrand, B., Deleotombe, E., Drazetic, P. and Patronelli, L., “Analysis of the Riveting Forming Mechanisms”, International Journal of Materials and Product Technology, Vol. 13, No. 3-6, pp. 123-145, 1998.
5
Langrand, B., Patronelli, L., Deleotombe, E., Markiewicz, E. and Drazetic, P., “An Alternative Numerical Approach for Full Scale Characterization for Riveted Joint Design”, Aerospace Science and Technology, Vol. 6, No. 5, 2002, pp. 343-354.
6
Szolwinski, M.P. and Farris, T.N., “Linking Riveting Process Parameters to the Fatigue Performance of Riveted Aircraft Structures”, Journal of Aircraft, Vol. 37, No. 1, 2000, pp. 130-137.
7
Trego, A. and Cope, D., “Evaluation of Damage Tolerance Analysis Tools for Lap Joints”, AIAA Journal, Vol. 39, No. 12, 2001, pp. 2250-2254.
8
Mackerle, J., “Finite Element Analysis of Fastening and Joining: A Bibliography (1990-2002)”, Int. Journal of Pressure
Vessels and Piping, Vol. 80, 2003, pp. 253-271. 9
Eastaugh, G.F., Straznicky, P.V., Krizan, D.V., Merati, A.A., Cook, J., “Experimental Study of the Effects of Corrosion on the Fatigue Durability and Crack Growth Characteristics of Longitudinal Fuselage Splices”, Proceedings of the 4th DoD/FAA/NASA Aging Aircraft Conference, St. Louis, MO. 15-18 May 2000.
10 Bellinger, N.C., Komorowski, J.P., and Benak, T.J., “Residual Life Predictions of Corroded Fuselage Lap Joints”,
International Journal of Fatigue, Vol. 23, No. S1, 2001, pp. S349-S356. 11
Bellinger, N.C., Krishnakumar, S., and Komorowski, J.P., “Modelling of Pillowing due to Corrosion in Fuselage Lap Joints”, Canadian Aeronautics and Space Journal, Vol. 40, No. 3, 1994, pp. 125-130.
12
Bellinger, N.C., and Komorowski, J.P., “Corrosion Pillowing Stresses in Fuselage Lap Joints”, AIAA Journal, Vol. 35, No. 2, 1997, pp. 317-320.
13
Bellinger, N.C., Komorowski, J.P., and Gould, R.W., “Damage Tolerance Implications of Corrosion Pillowing on Fuselage Lap Joints”, Journal of Aircraft, Vol. 35, No. 3, 1998, pp. 487-491.
14
Bellinger, N.C., Komorowski, J.P. and Gould, R.W., “Corrosion Pillowing in Aircraft Fuselage Lap Joints”, Proceedings
of 46th AIAA/ASME/ASCE/AHS/ASC Structures, Structural Dynamics & Materials Conference, Austin, Texas, April 2005, paper AIAA-2005-2023.
15
Li, G. and Shi, G., “Investigation of Residual Stress in Riveted Lap Joints: Experimental Study”, Institute for Aerospace Research, National Research Council Canada Paper LTR-SMPL-2003-0099, 2003.
16 Li, G. and Shi, G., “Effect of the Riveting Process on the Residual Stress in Fuselage Lap Joints”, Canadian Aeronautics
and Space Journal, Vol. 50, No. 2, 2004, pp. 91-105.
17 Li, G., Shi, G. and Bellinger, N.C., “Studies of Residual Strain in Lap Joints”, Journal of Aircraft, Vol. 43, No. 4, 2006, pp. 1145-1151.
18 Li, G., Shi, G. and Bellinger, N.C., “Studies of Residual Stress in Single-Row Countersunk Riveted Lap Joints”, Journal of
Aircraft, Vol. 43, No. 3, 2006, pp. 592-599.
19 Li, G., Shi, G. and Bellinger, N.C., “Residual Stress/Strain in Three-Row Countersunk Riveted Lap Joints”, Journal of
Aircraft, Vol. 44, No. 4, 2007, pp. 1275-1285.
20 Metallic Material and Elements for Aerospace Vehicle Structures. MIL-HDBK-5H, Department of Defense, USA, Dec. 1998.
21 “MARC Volume B: Element Library, Version K7”, MARC Analysis Research Corporation, USA, 1997. 22
Fatigue rated fastener systems, edited by H.H. van der Linden, AGARD-R-721, North Atlantic Treaty Organization, 1985. 23 Eastaugh, G.F., Simpson, D.L., Straznicky, P.V. and Wakeman, R.B., “A Special Uniaxial Coupon Test Specimen for the Simulation of Multiple Site Fatigue Crack Growth and Link-up in Fuselage Skin Splices”, National Research Council Canada and Carleton University, Ottawa, Canada, CP-568, AGARD, Dec. 1995
24 Vlieger, H. and Ottens, H.H., “Uniaxial and Biaxial Tests on Riveted Fuselage Lap Joint Specimens”, National Luch-E Ruimtevaart Laboratorium, National Aerospace Laboratory NLR, 1059 CM Amsterdam, The Netherlands and U.S. Department of Transportation, Federal Aviation Administration, Washington, DC 20591, DOT/FAA/AR-98/33, 1998.