HAL Id: hal-01288130
https://hal.archives-ouvertes.fr/hal-01288130
Submitted on 1 Apr 2016
HAL is a multi-disciplinary open access archive for the deposit and dissemination of sci-entific research documents, whether they are pub-lished or not. The documents may come from teaching and research institutions in France or abroad, or from public or private research centers.
L’archive ouverte pluridisciplinaire HAL, est destinée au dépôt et à la diffusion de documents scientifiques de niveau recherche, publiés ou non, émanant des établissements d’enseignement et de recherche français ou étrangers, des laboratoires publics ou privés.
Findings from the 2014 Labor Force Survey in Sierra
Leone
David Margolis, Nina Rosas, Abubakarr Turay, Samuel Turay
To cite this version:
David Margolis, Nina Rosas, Abubakarr Turay, Samuel Turay. Findings from the 2014 Labor Force Survey in Sierra Leone. World Bank Publications, 2016, 978-1-4648-0754-1. �10.1596/978-1-4648-0742-8�. �hal-01288130�
F
indings from the 2014 Labor F
orce
S
urvey in S
ierra Leone
J
obs are critical to poverty reduction and inclusive growth in Sierra Leone, where more than half the population is poor and most are dependent on labor earnings. The country will require substantial job creation to accommodate its young and growing population, coupled with low labor intensity in the mining sector that has been driving recent growth. Adding to this challenge is the need to improve the quality of jobs in a context where most workers are engaged in low productivity activities. Given that Sierra Leone is a post-confl ict country, jobs are also central to sustained stability. Yet, despite the importance of jobs for Sierra Leone, the design of policies andinterventions to promote these opportunities has been constrained by a limited knowledge base. The 2014 Labor Force Survey report seeks to contribute to solutions to the jobs challenge in Sierra Leone through a foundational analysis of the country’s fi rst dedicated labor survey in nearly three decades. The report provides an overview of the employment situation in Sierra Leone, ranging from labor force participation to the types of employment among the working-age population. Through analysis of specialized modules, the report sheds light on key constraints to self-employment in agricultural activities and non-farm household enterprises, which are, respectively, the fi rst- and second-largest sources of jobs in the economy. It also highlights the extent of informality in both wage employment and non-farm self-employment as well as how an individual’s status in the labor market relates to poverty. The report also presents information on skills levels and how basic skills are acquired by the working age population. Finally, the report discusses issues related to youth employment and the specifi c constraints faced by youth in gaining access to productive job opportunities.
David Margolis, Nina Rosas,
Abubakarr Turay, and Samuel Turay
Findings from the
2014 Labor Force
Survey in Sierra Leone
ISBN 978-1-4648-0742-8
Findings from the 2014 Labor Force
Survey in Sierra Leone
Findings from the 2014 Labor Force Survey in Sierra Leone http://dx.doi.org/10.1596/978-1-4648-0742-8
© 2016 International Bank for Reconstruction and Development / The World Bank 1818 H Street NW, Washington, DC 20433
Telephone: 202-473-1000; Internet: www.worldbank.org Some rights reserved
1 2 3 4 19 18 17 16
World Bank Studies are published to communicate the results of the Bank’s work to the development com-munity with the least possible delay. The manuscript of this paper therefore has not been prepared in accordance with the procedures appropriate to formally edited texts.
This work is a product of the staff of The World Bank with external contributions. The findings, inter-pretations, and conclusions expressed in this work do not necessarily reflect the views of The World Bank, its Board of Executive Directors, or the governments they represent. The World Bank does not guarantee the accuracy of the data included in this work. The boundaries, colors, denominations, and other information shown on any map in this work do not imply any judgment on the part of The World Bank concerning the legal status of any territory or the endorsement or acceptance of such boundaries.
Nothing herein shall constitute or be considered to be a limitation upon or waiver of the privileges and immunities of The World Bank, all of which are specifically reserved.
Rights and Permissions
This work is available under the Creative Commons Attribution 3.0 IGO license (CC BY 3.0 IGO) http:// creativecommons.org/licenses/by/3.0/igo. Under the Creative Commons Attribution license, you are free to copy, distribute, transmit, and adapt this work, including for commercial purposes, under the following conditions:
Attribution—Margolis, David; Nina Rosas, Abubakarr Turay, and Samuel Turay. 2016. Findings from the 2014 Labor Force Survey in Sierra Leone. World Bank Studies. Washington, DC: World Bank.
doi: 10.1596/978-1-4648-0742-8. License: Creative Commons Attribution CC BT 3.0 IGO. Translations—If you create a translation of this work, please add the following disclaimer along with the
attribution: This translation was not created by The World Bank and should not be considered an official
World Bank translation. The World Bank shall not be liable for any content or error in this translation.
Adaptations—If you create an adaptation of this work, please add the following disclaimer along with the attribution: This is an adaptation of an original work by The World Bank. Views and opinions expressed in
the adaptation are the sole responsibility of the author or authors of the adaptation and are not endorsed by The World Bank.
Third-party content—The World Bank does not necessarily own each component of the content contained within the work. The World Bank therefore does not warrant that the use of any third-party-owned individual component or part contained in the work will not infringe on the rights of those third parties. The risk of claims resulting from such infringement rests solely with you. If you wish to re-use a com-ponent of the work, it is your responsibility to determine whether permission is needed for that re-use and to obtain permission from the copyright owner. Examples of components can include, but are not limited to, tables, figures, or images.
All queries on rights and licenses should be addressed to the Publishing and Knowledge Division, The World Bank, 1818 H Street NW, Washington, DC 20433, USA; fax: 202-522-2625; e-mail: pubrights@ worldbank.org.
ISBN (paper): 978-1-4648-0742-8 ISBN (electronic): 978-1-4648-0754-1 10.1596/978-1-4648-0742-8
Cover photo: Samantha Zaldivar
Cover design: Debra Naylor, Naylor Design, Inc.
Acknowledgments xi
Executive Summary xiii
Introduction 1
Notes 3
Chapter 1 Overview 5
The Overall Labor Market 5
Employment 11 Unemployment 24 Migration 30 Notes 33 Chapter 2 Skills 37 Literacy 37 Educational Attainment 38 Training 43 Apprenticeship 49
Skills and Earnings 51
Notes 52
Chapter 3 Farming Activities and Nonfarm Household Enterprises 53
Farming Activities 53
Nonfarm Household Enterprises 58
Notes 63
Chapter 4 Informality 65
Notes 68
Chapter 5 Youth 69
Basic Education 69
vi Contents
Findings from the 2014 Labor Force Survey in Sierra Leone http://dx.doi.org/10.1596/978-1-4648-0742-8
The Transition from School to Work 78
Labor Market Statistics, Job Type, and Sector 80
Conflict 82
Teenage Pregnancy 83
Notes 84
Chapter 6 Summary and Policy Recommendations 85 Appendix A Key Concepts in the 2014 Sierra Leone
Labor Force Survey (SLLFS) Analysis 89
Labor Force Survey–Related Concepts 89
Levels of Disaggregation 90
Key Traditional Labor Market Indicators 90
Indicators of Job Types and Main Sectors of Employment 92
Indicators of Household Agricultural Activities 93
Indicators on Nonfarm Household Enterprises 93
Indicators on the Extractive Sector 93
Indicators on Migration and Civil Conflict 94
Indicators of Youth Employment 94
Note 98
Appendix B Methodology of the Statistical Analysis and
Additional Results Tables 99
Labor Market Status 99
Job Type 101
Labor Earnings 103
Migration 107 Formality 107
Educational Attainment 107
Appendix C ILO Definitions 115
Figures
ES.1 Sierra Leone’s Key Labor Market Indicators, by Gender xiv
ES.2 Literacy Rates, by Gender and Location xvi
ES.3 Source of Capital xviii
ES.4 Capital Constraints and Access to Agricultural
Inputs and Services xix
I.1 Population Pyramid, 2015 Estimate 2
1.1 Labor Force Participation Rates (ILO), by Age 8
1.2 Reasons for Inactivity, by Characteristics of Individuals 10
1.3 Reasons for Inactivity, by Province and
1.4 Job Types, by Age 14
1.5 Employment, by Type of Institution or Firm 18
1.6 How the Employed Found Their Jobs,
by Characteristics of Individuals 19
1.7 How the Employed Found Their Jobs, by Educational
Attainment and Province 19
1.8 Underemployment Rates, by Characteristics of Individuals 20
1.9 Underemployment Rates, by Job Type 21
1.10 Correlation of District Poverty Rates and Key Labor
Market Indicators 23
1.11 Correlation of District Poverty Rates and Sector
of Employment 24
1.12 Distribution of Household Income per Consumption Unit 25
1.13 Unemployment Rates (ILO), by Characteristics of Individuals 26
1.14 Unemployment Rates (ILO), by Educational Attainment
and Province 26
1.15 Share of Working-Age Population Unemployed,
by Characteristics of Individuals 27
1.16 Share of Working-Age Population Unemployed, by Educational
Attainment and Province 27
1.17 Job Search Strategies among the Unemployed, by Educational
Attainment and Location 28
1.18 Job Search Strategies among the Unemployed, by Educational
Attainment and Province 28
1.19 Reasons for Not Searching for Work, by Characteristics of
Unemployed Individuals 29
1.20 Reasons for Not Searching for Work, by Educational
Attainment and Province 30
1.21 Internal and International Migration 31
1.22 Reasons for Migration, by Age (Five-Year Moving Average) 31
1.23 Reasons for Migration, by Age Group during the Conflict 32
1.24 Reasons for Migration, by Educational Attainment 33
2.1 Literacy Rates among the Working-Age Population,
by Characteristics of Individuals 38
2.2 Educational Attainment, by Characteristics of Working-Age
Individuals 39
2.3 Educational Attainment among the Working-Age Population,
by Location 40
2.4 The Reasons for Never Attending School, by Characteristics
of Individuals 41
2.5 Average Years of Schooling, by Characteristics of Individuals
in the Working-Age Population 42
2.6 Average Years of Education, by Urban or Rural
viii Contents
Findings from the 2014 Labor Force Survey in Sierra Leone http://dx.doi.org/10.1596/978-1-4648-0742-8
2.7 Providers of Education, by Characteristics of Individuals 43
2.8 Educational Attainment before the Start of Training 44
2.9 Average Years of Training among Trainees, by Characteristics
of Individuals 44
2.10 Average Years of Training among Trainees, by Educational
Attainment and Province 45
2.11 Median Earnings, by Average Years of Vocational Training 46
2.12 Fields of Study, by Formal Educational Attainment prior to
Undertaking Vocational Training 47
2.13 Average Number of Years to Earn Training Certification 47
2.14 Average Years of Training, by Field 48
2.15 Training Areas, by Characteristics of Individuals and Province 48
2.16 Working-Age Population Undertaking Apprenticeships,
by Characteristics of Individuals 49
2.17 Apprenticeship Trades, by Gender 50
2.18 Median Earnings, by Type of Vocational Training Certificate 51
3.1 Share of Agricultural Workers with Credit Constraints,
by Farm Characteristics 57
3.2 Median Value of Agricultural Output (in Leones), by Farm
Characteristics 58
3.3 Median Household Enterprise Profits, by Amount of
Start-Up Capital 61
3.4 Financial Records of Household Enterprise by Household
Enterprise Location 62
4.1 Formality, by Characteristics of Individuals 67
4.2 Formality, by Age Group 68
5.1 Literacy, Youth (15–35) vs. Older People (36–64) 70
5.2 Education, Working-Age Population vs. Youth 71
5.3 Years of Education among Youth, by Characteristics
of Individuals 72
5.4 Average Years of Education, by Age 73
5.5 Share of Each 5-Year Age Group in School, by Gender 73
5.6 Share of Youth Who Have Received Vocational Training,
by Characteristics of Individuals 74
5.7 Average Years of Training among Youth, by Characteristics of
Individuals 75
5.8 Average Years of Training among Youth, by Province
and District 76
5.9 Years of Training, by Educational Attainment and
Professional Certification 76
5.10 Vocational Training and Apprenticeships, by Formal
Educational Attainment 77
5.11 Frequency of Apprenticeships among Youth,
5.12 The Transition from School to Work 79
5.13 Transitions across Labor Market Status, Young Women,
5-Year Moving Average 79
5.14 Transitions across Labor Market Status, Young Men,
5-Year Moving Average 80
5.15 Main Job Type among Youth (15–35), by Gender
and Location 82
5.16 Sector of Main Employment among Youth (15–35),
by Gender and Location 82
5.17 The Population Effects of the Civil (Rebel) War, 1991–2002,
Youth vs. Older People 83
A.1 Relationships among Key Labor Market Concepts 92
Maps
ES.1 Types of Jobs, by District. xv
1.1 Labor Force Participation Rates (ILO), by District 9
1.2 The Employment-to-Population Ratio 11
1.3 Job Types, by District 15
1.4 Employment Sectors, by District 16
1.5 Poverty Rates, $2.00-a-Day Criterion, by District 22
1.6 Unemployment Rates (ILO), by District 25
2.1 Literacy Rates (Read and Write), by District 39
5.1 Average Years of Education among Youth, by District 72
Tables
1.1 Key Aggregate Labor Market Statistics 7
1.2 Key Employment Statistics 12
1.3 Job Type, by Sector of Activity 17
2.1 Initial and Final Years of Formal Education and Years of Training 45
3.1 Educational Attainment among Self-Employed
Agricultural Workers 54
3.2 Proof of Landownership 55
3.3 Ownership Status of Plots 55
4.1 Criteria of Formality, Wage Jobs 66
5.1 Key Aggregate Labor Market Statistics, Youth (15–35)
vs. Older People (36–64) 81
5.2 Women Who Were Teen Mothers vs. Women Who Were Not
Teen Mothers 84
A.1 How to Calculate Key Indicators in the 2014 SLLFS 95
B.1 Marginal Effects for Multinomial Logit Model of
Labor Market Status 100
Findings from the 2014 Labor Force Survey in Sierra Leone http://dx.doi.org/10.1596/978-1-4648-0742-8
x Contents
B.3 Heckman Selection-Corrected Regressions of Log Earnings
in Main Job 103
B.4 Marginal Effects for Multinomial Logit Model of Reasons
for Migration 108
B.5 Selection-Corrected Probit Models of Formality 110
B.6 Marginal Effects for Ordered Probit Model of
This report has been prepared by a team comprising Abubakarr Turay and Samuel Turay (Statistics Sierra Leone) and David N. Margolis (Paris School of Economics, Centre National de la Recherche Scientifique), Nina Rosas, and Rosa Vidarte (World Bank). It was prepared as part of a broader technical assistance initiative of the World Bank to the government of Sierra Leone for the 2014 Labor Force Survey, which has been conducted in close collaboration with the Deutsche Gesellschaft für Internationale Zusammenarbeit and the International Labour Organization (ILO). The technical assistance has been financed by the Korea Trust Fund for Economic and Peacebuilding Transitions. Excellent field support for the survey has been provided by Abu Kargbo (Social Protection Operations Officer), Samantha Zaldivar Chimal (Social Protection Consultant), Andrea Martin (Monitoring and Evaluation Consultant), Hector Zamora (Field Coordinator), and Adam Hoar (Field Coordinator).
Invaluable inputs in the survey design, implementation, and analysis process have been provided by other colleagues in the World Bank, including Kathleen Beegle (Program Leader), Markus Goldstein (Lead Economist), Talip Kilic (Senior Economist, Surveys), Kristen Himelein (Senior Poverty Economist), Suleiman Namara (Senior Social Protection Economist), Hardwick Tchale (Senior Agricultural Economist), Kebede Feda (Economist), Kaliope Azzi-Huck (Education Operations Officer), Frances Gadzekpo (Senior International Finance Corporation Operations Officer), Susan Kayonde (Trade and Competitiveness Consultant), Mauro Testaverde (Economist), and Ning Fu (Social Protection Consultant), as well as by Yacouba Diallo (Senior Statistician, ILO). Insightful peer review comments have also been provided by Thomas Bossuroy (Economist) and Vasco Molini (Senior Economist). The photos were taken by Andrea Martin, Samantha Zaldivar, and Hector Zamora.
Background
This report seeks to contribute to solutions to the jobs challenge in Sierra Leone through a foundational analysis of the country’s first specialized labor survey in nearly three decades. Jobs are critical to poverty reduction and inclusive growth in Sierra Leone, where more than half the population is poor and most are dependent on labor earnings. Adding to the jobs challenge is the young and grow-ing population and therefore the need for substantial job creation, coupled with low labor intensity in the mining sector, which has been driving recent growth. Beyond job creation, in a context where most workers are engaged in low-productivity jobs, improving the quality of jobs is critical for poverty reduction. Given that Sierra Leone is a postconflict country, jobs are also central to sus-tained stability. Yet, despite the importance of jobs for Sierra Leone, the design of policies and interventions to promote these opportunities has been con-strained by a limited knowledge base. This report seeks to narrow these gaps by providing a picture of the jobs landscape based on the country’s first labor force survey since 1984.
Overview of Sierra Leone’s Labor Market
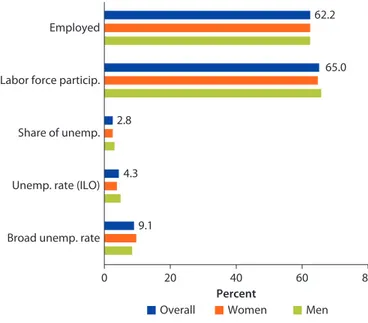
Most of the country’s working-age population is in the labor force, and women participate almost as much as men (figure ES.1). Over 65 percent of Sierra Leone’s working-age population, which represents nearly 2 million people, par-ticipates in the labor market. Of those people working, the differences between men and women are small (65.7 percent participation among men; 64.7 percent participation among women). Young women are much more likely than young men to be in the labor market (39.4 percent vs. 29.5 percent, using the defini-tion of the Internadefini-tional Labour Organizadefini-tion [ILO]), although this gap fades with age.
Among those who do not participate in the labor market, the main reason is attendance at school or training programs. Overall, 54.1 percent of the inactive population was in school or in training. The second most frequent explanation
xiv Executive Summary
Findings from the 2014 Labor Force Survey in Sierra Leone http://dx.doi.org/10.1596/978-1-4648-0742-8 (16.1 percent) for not participating in the labor market is lack of financial or other resources for starting a new business. Taking care of their own household or family affects 9.8 percent of the nonparticipants, and the lack of skill require-ments or experience was cited by 4.5 percent as their reason for not participating. Much more than men, women report that family responsibilities are the reason they do not participate.
Unemployment is relatively low, but this masks significant variation across districts and subgroups. Of the working-age population, 62.2 percent were
employed, and 2.8 percent were unemployed, as defined by the ILO.1 The
most significant variation in employment rates was across age groups, educa-tion levels, urban–rural status, and regions. The highest employment rates were found in rural areas and among the most (and least) well educated. Unemployment rates varied substantially across population subgroups. The highest rates were found among youth, men, migrants, urban residents, espe-cially in the Western Area, and among those with at least an upper-secondary education.
Most workers are employed in relatively low-productivity jobs in farm and nonfarm self-employment; fewer than 10 percent are in wage
employ-ment.2 The vast majority (59.2 percent) of employed individuals aged
15–64 work in agricultural self-employment (see map ES.1). Another 31.3 percent work in nonagricultural self-employment, mostly in microenter-prises as traders or shopkeepers. Unpaid workers add an additional 7 percent to total employment. After agriculture (61 percent of all jobs), the service sector is the second-largest employer at a national scale (33 percent),
Figure ES.1 Sierra Leone’s Key Labor Market Indicators, by Gender
Broad unemp. rate
Percent
Unemp. rate (ILO)
0 20 40 60 80
Share of unemp. Labor force particip.
Employed 62.2 65.0 2.8 4.3 9.1 Women Men Overall
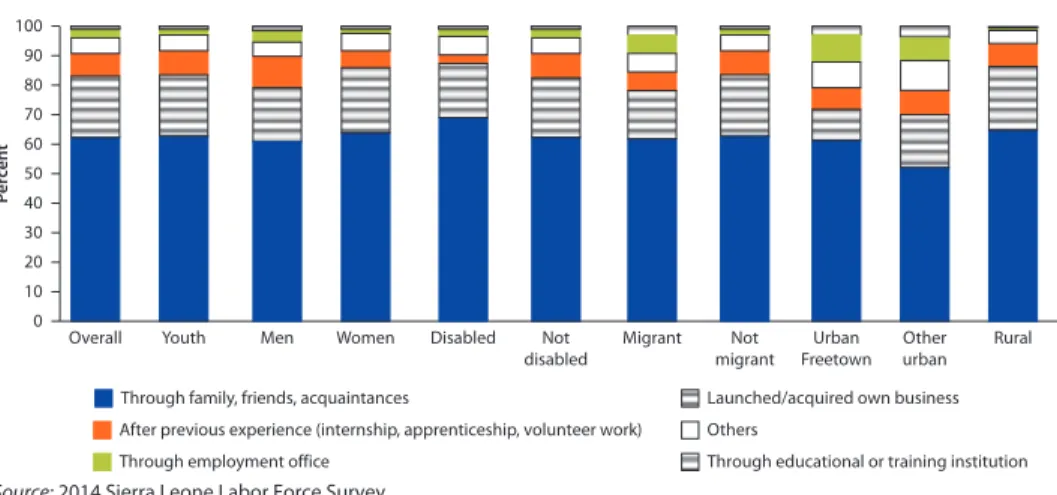
although there is significant regional variation. Personal networks are impor-tant for the labor market as the majority of the workforce—especially those with lower educational attainment—seek and obtain their jobs through family and friends.
Capital is a key constraint to entry into the labor force. Over two-thirds of the
9 percent who are broadly unemployed were not actively seeking work.3 Over
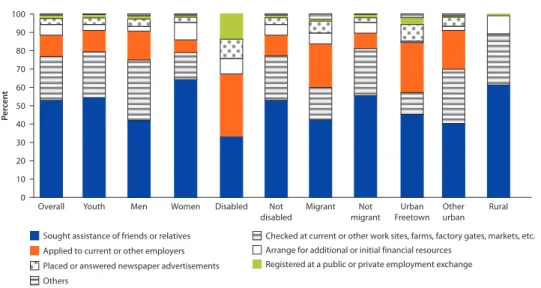
half (56 percent) of the broadly unemployed who were not searching for work lacked the capital or resources to start a business; ongoing schooling was the second most frequent explanation (11 percent). Lack of skills was cited by 10 percent, while only 8 percent were discouraged or thought no jobs were avail-able, and less than 1 percent did not want to work. The lack of search effort varies across regions and subgroups. Fewer broadly unemployed women actively search relative to their male counterparts (25 percent vs. 38 percent). The highly educated tend to search more (70 percent) than those with no education (20 percent).
A significant proportion of employed workers would like to work more hours, and the share is higher in Freetown and among certain subgroups. Almost one-third of all workers would like to work more hours. The share is 47 percent in Freetown, compared with 32 percent in rural areas. Nearly one-third of part-time workers are working less than they would like. Underemployment is
Map ES.1 Types of Jobs, by District
WageEmp Unpaid NonAgSelfEmp AgSelfEmp
xvi Executive Summary
Findings from the 2014 Labor Force Survey in Sierra Leone http://dx.doi.org/10.1596/978-1-4648-0742-8 highest among residents of Freetown, youth, men, and individuals with tertiary degrees. While wage workers have less control over their hours and are thus more often underemployed, the self-employed also work less than they desire, likely reflecting weak demand or other constraints to the expansion of business activities.
There is significant inequality in earnings across subgroups, but inactivity con-tributes most to household income poverty. Earnings vary substantially across job types and, within job type, across gender and educational attainment. Jobs in mining, Freetown, and private sector wage employment provide the highest earnings. Gender gaps in earnings are stark: holding other characteristics constant, the results show that men earn nearly three times as much as women in wage employment, more than 2.5 times in nonfarm self-employment, and nearly double in agricultural self-employment. Among people in wage or agricultural self-employment, there are large earnings gaps between individuals with tertiary education and individuals with less education. However, employment is more closely associated with income poverty than skills, job type, sector of activity, or even earnings while employed. Inequality across household incomes is also high, while the coverage of programs to help the most vulnerable access job opportu-nities is limited.
Skills
Educational attainment and literacy rates among the working-age population are low, and there are large differences by gender and location (figure ES.2 ). More than half the working-age population (56.7 percent) cannot read or write. A similar proportion have never attended school, and, among these, almost all are illiterate. Financial constraints are the main reason cited among those who have never attended school. Most (about 8 of 10 individuals) have attained, at most,
Figures ES.2 Literacy Rates, by Gender and Location
Read and write Read only Write only Not read or write
Men Women Freetown Other
urban Rural Overall 0 10 20 30 40 50 56.7 45.1 53.4 66.4 20.4 78.4 64.0 34.1 68.0 30.5 32.0 41.7 60 70 80 100 90 Pe rcent
primary education, while only a small fraction have completed higher education. There are large gender gaps in both the illiteracy rate and the proportion of people who have never attended school. Educational attainment and literacy rates among the working-age population largely mirror the urban–rural distribu-tion. Individuals in Freetown are the most well educated and literate, followed by residents in other urban areas, and, lastly, residents in rural areas. Most indi-viduals are educated at public institutions; a relatively small proportion pursue training or apprenticeships.
Higher skill levels are associated with higher earnings, but most of the variation is at the tails of the distribution. There is a large jump in earnings among people with some primary relative to those with no schooling, and, similarly, among for those with postsecondary education relative to those who have completed secondary education. However, in the middle of the education spectrum, the returns to education do not vary much. To see earnings gains from vocational training, participants must obtain certificates or diplomas; there is no significant boost to median earnings associated with serving appren-ticeships.
Farming and Nonfarm Household Enterprises
The majority of households and those employed within them are engaged in agricultural activities, and women constitute a larger share than men among these workers. Most households (72.8 percent) include at least one hold member involved in agricultural activities, and about half of all house-holds (49.6 percent) include at least one member engaged in a nonfarm household enterprise. A nonnegligible proportion of households and indi-viduals diversify labor across farm and nonfarm self-employment (22.6 per-cent and 26.1 perper-cent of those in nonfarm work, respectively). In both farm and nonfarm self-employment, women represent a larger share of the employed (53.5 percent and 63.8 percent, respectively). However, in terms of hours worked, men carry a larger burden of agricultural activities relative to women.
Educational attainment is lower among people working in agricultural self-employment than among the overall population and the nonfarm self-employed. Most of the agricultural self-employed (80 percent) never attended school, com-pared with 67.5 percent of the overall working-age population and 59.9 percent of the nonfarm self-employed. The vast majority of household enterprise workers (85.6 percent) work in enterprises that do not keep financial records for the busi-ness separate from the financial records for the household, indicating low finan-cial literacy.
Capital—typically sourced from family and friends—is a key constraint on the quantity and quality of jobs among household enterprises (figure ES.3). Nearly half (47 percent) of household enterprises report that they are unable to borrow the necessary capital for the business. The initial level of capital invested in household enterprises is positively related to enterprise size, revenues, and
xviii Executive Summary
Findings from the 2014 Labor Force Survey in Sierra Leone http://dx.doi.org/10.1596/978-1-4648-0742-8 profits, indicating difficulties in obtaining capital may be limiting firm growth and productivity. Among those households able to borrow, start-up capital tends to be obtained from family and friends (40 percent); little capital is obtained from formal financial institutions (3 percent), pointing to incomplete credit markets. Credit constraints are also associated with more variable enterprise locations; variable locations are common (affecting 42.1 percent of household enterprises), but may further limit investments, for example, if assets cannot be properly secured.
Capital is also a key constraint to increased productivity in agricultural self-employment (figure ES.4). Almost 40 percent of agricultural workers live in households that face credit constraints, which are associated with less use of technology, inputs, extension services, and, ultimately, output, and profits. More than half of plots (63.9 percent) have no irrigation and do not use fertilizer (65.5 percent), and only 4.6 percent of agricultural workers belong to house-holds that have access to extension services for farming activities. While more than half of plots (69.2 percent) use purchased seeds, the data suggest that capital constraints may be preventing households from investing in more pro-ductive, costlier inputs that could, in the absence of these constraints, increase income.
There are notable gender gaps in land and business ownership and in the resulting profits. Most agricultural plots (67.8 percent) are owned by men, and women typically own smaller plots (8.3 acres vs. 11.1 acres). In terms of house-hold enterprises, although most are microenterprises, men tend to own slightly larger enterprises relative to women and are more likely than women to hire labor. And, although women are concentrated in nonfarm self-employment activities, male-owned enterprises have median monthly profits that are almost double those of female-owned enterprises.
Figure ES.3 Source of Capital (% of Household Enterprises)
39
33
20
3
Owner’s savings Family and friends
Proceeds from another business
Informality
Informality is pervasive in Sierra Leone, and formal work is restricted to the few most highly educated workers. Over 35 percent of wage jobs and over 88 percent of nonagricultural self-employment are informal. The share of formal wage jobs is more than five times larger than the share of jobs in registered household enterprises involved in nonagricultural self-employment. Among wage workers, formal wage jobs are considered good jobs because these workers earn more, on average, than informal wage workers. The likelihood of working in a formal job, whether in wage employment or nonagricultural self-employment, is greater among men than among women and increases with educational attainment. Wage jobs in agriculture are almost never formal.
Youth
Youth—who represent the majority of the working-age population—participate less in the labor market and fare worse in terms of employment and unemploy-ment. Youth (the 15–35 age group) represent the largest share of the overall population (66 percent) and more than half the employed population (56 per-cent). Relative to older people (36–64 age group), the share of youth both in the labor force and among the employed is much smaller, about a 30 percentage point difference relative to the older group. A significant portion of this differ-ence arises because many youth are still in school and not simultaneously work-ing. The unemployment rate is also higher among youth than among older peo-ple (5.9 percent versus 2.2 percent). The highest unemployment rate across subgroups occurs among young men (7.7 percent), particularly those who live in Freetown (14.0 percent). On the other hand, the differences in the type of job and the sector of employment are not large between youth and older people; most youth work in low-productivity jobs.
Figures ES.4 Capital Constraints and Access to Agricultural Inputs and Services
Owns plot Doesn’t own plot
38.6 43.4 No outside labor 53.8 Outside labor 36.2 Percent No mechanization 39.2 Mechanization 23.2 No extension 56.9 Access to extension 24.3 0 10 20 30 40 50 60
xx Executive Summary
Findings from the 2014 Labor Force Survey in Sierra Leone http://dx.doi.org/10.1596/978-1-4648-0742-8 Youth have higher literacy and more educational attainment relative to pre-vious generations, but, otherwise, seem to acquire skills in a similar way. Literacy rates and educational attainment are higher among youth than among older people in the working-age population (photo ES.1). The skill composi-tion among youth varies across districts and provinces, but the Western Area leads in terms of years of education. The proportion of youth engaging in voca-tional training and apprenticeships is similar to the proportion among the overall working-age population. There is a drop-off in average years of voca-tional training and apprenticeships among older age groups of youth, implying a trend among younger cohorts to stay in school longer. However, the fact that average years of schooling fluctuates around age 24 may reflect the impact of the civil conflict on human capital accumulation among people of school age during the war.
Gender gaps in educational attainment persist among youth, but are smaller than the corresponding gaps among older generations. Young women have an average of around 7 months less education than young men. Girls tend to leave school at slightly earlier ages than boys, and high rates of teenage pregnancy are likely reinforcing these gender gaps: among young women, 66.5 percent had their first child between the ages of 15 and 19. However, the necessity to start working also plays a role because young girls also begin working in almost equal proportion after they exit school.
Photo ES.1. A young man supervises the transport of heavy machinery to Kono
Notes
1. This refers to the share of unemployed (that is, the total unemployed divided by the total working-age population), while the unemployment rate (4.3 percent) is calcu-lated as the total unemployed divided by the total workforce (working-age population unemployed plus employed, excluding those who do not participate in the labor market).
2. See “Indicators on job types and main sectors” in the Appendix for details on how job types are defined.
3. Those who were not working but were available for work are referred to as “broad unemployment,” to distinguish from the ILO definition of unemployment, which requires an individual to actively search to be considered unemployed.
In Sierra Leone, where more than half of the population is poor and dependent on earnings from labor income, jobs are critical for poverty reduction and
inclu-sive growth.1 In 2011, 53 percent of the country’s population of 5.9 million was
living under the poverty line, and 14 percent was living under the food poverty line. Most workers, but especially the poorest, are engaged in low-productivity jobs in agriculture or nonagricultural self-employment. In a context of limited social safety nets and social insurance coverage, jobs remain the primary source
of income among the poor and are therefore crucial to poverty reduction.2
The country’s demographic profile implies that substantial job creation will be needed in coming years. According to the most recent United Nations popula-tion estimates, almost half of the populapopula-tion is below age 15, and more than three-quarters are below age 35 (figure I.1). At current rates of population growth, this implies new jobs will have to be created for approximately 100,000 labor market entrants per year.
At the same time, the sectors contributing the most to recent growth are tra-ditionally low in labor intensity, adding to the jobs challenge. Since the end of a 10-year-long civil war in 2002 and prior to the Ebola Virus Disease crisis, the economy consistently registered positive growth. The average annual per capita growth was 5.8 percent between 2003 and 2011. However, the mining sector, driven by iron ore exports, represented 98.2 percent of the growth in gross domestic product (GDP) in 2014, while agriculture, which accounted for most of the country’s labor, represented only 0.3 percent.
Creating jobs and improving the quality of jobs are vital to poverty reduction. Sierra Leone’s current Poverty Reduction Strategy Paper, “The Agenda for Prosperity,” identifies employment quality as a major driver of sustainable eco-nomic growth. However, robust ecoeco-nomic growth since the country emerged from a decades-long civil war in 2002 has not translated into a corresponding increase in adequate, productive employment opportunities. Policy making around jobs should therefore consider not only the quantity but also the quality of jobs.
In Sierra Leone, as a postconflict country, jobs are also central to sustained stability. Internationally, there is a growing recognition that jobs are central to restoring peace and stability after conflict. Recent World Development Reports
2 Introduction
Findings from the 2014 Labor Force Survey in Sierra Leone http://dx.doi.org/10.1596/978-1-4648-0742-8
Figure I.1 Population Pyramid, 2015 Estimate
Percentage of the population
A ge group 0–4 10 8 6 4 2 0 2 4 6 8 10 5–9 10–14 15–19 20–24 25–29 30–34 35–39 40–44 45–49 50–54 55–59 60–64 65–69 70–74 75–79 80+ Male Female
Source: United Nations Population Division, World Population Prospects, 2015.
have identified jobs as one of the most pressing issues in fragile and postconflict states. The 2011 report, on conflict, security, and development, identified jobs, alongside security and justice, as a central pillar for breaking the cycle of violence, restoring confidence in public institutions, and giving people a stake in society. Building on this, the 2013 report, on jobs, finds that both because of their con-tributions to livelihoods and poverty reduction and for reasons of social cohesion jobs can provide alternatives to violence, especially among youth.
Yet, despite the importance of jobs, the design of policies and interventions to promote opportunities for employment in Sierra Leone has been constrained by a limited knowledge base. Previously, the main source of employment statistics was the 2004 and 2011 Sierra Leone Integrated Household Surveys, which con-tained limited information on the labor force. To help fill this important knowl-edge gap, Statistics Sierra Leone, with the support of the World Bank, the ILO, and the Deutsche Gesellschaft für Internationale Zusammenarbeit, designed and implemented the 2014 Sierra Leone Labor Force Survey (SLLFS).
This report, relying on the first labor force survey in the country in almost 30 years, provides a picture of the jobs landscape in Sierra Leone. Data from the SLLFS, the first labor force survey in the country since 1984, were collected between July and August 2014 and constitute a nationally representative
sam-ple.3 The SLLFS covered 4,200 households, representing more than 20,000
including detailed data on household enterprises and agricultural activities, and provides a more complete view of productive activities in Sierra Leone than would be possible with only a traditional labor force survey approach. This report uses concepts defined by the ILO to ensure international comparability, with adjustments, as needed, to contextual specificities. It also broadly aligns with the analytical framework of the 2013 World Development Report on Jobs and the Africa regional flagship on youth employment.
The report is divided into five sections. The first section provides an overview of the employment situation in Sierra Leone, ranging from labor force participa-tion to the types of employment among the working-age populaparticipa-tion. The second section addresses issues related to skills (education, training, and apprentice-ships). The third section discusses self-employment in agricultural activities and household enterprises, which are, respectively, the first- and second-largest sources of jobs in the economy. The fourth section considers informality in both wage employment and nonagricultural self-employment. The fifth section focus-es on youth employment, using both the ILO definition (under age 25) and the definition generally used in the Africa region (15–35). The final section summa-rizes the results and provides policy recommendations.
Notes
1. The source of information in this section is the Sierra Leone Poverty Assessment (2013) unless otherwise indicated.
2. World Bank, 2012, Sierra Leone Social Protection Assessment.
3. The response rate was 99.7 percent, resulting in a final total of 4,189 households, cor-responding to 20,378 individuals. As is the common practice with survey data, the data are then weighted to represent the entire population of the country.
This chapter presents a description of the overall labor market in Sierra Leone. It comprises three parts: a characterization of the labor market as a whole, an analy-sis of the employed based on the characteristics of their main employment at the time of the survey, and an analysis of the unemployed. Employment is decom-posed into three broad types: wage employment, agricultural self-employment, and nonagricultural self-employment (photo 1.1). Self-employment can include employers or workers in household enterprises who share in profits. Salaried individuals in household enterprises are considered wage workers. Each of these job types is further decomposed by educational attainment, gender, disability status, migrant or nonmigrant status, and location in rural or urban areas and in
government administrative area.1 Table 1.1 presents the headline statistics that
underlie the discussion.2 The employment section discusses the relevant shares of
people and their earnings.
The Overall Labor Market
In a working-age population of slightly more than 3 million people, 62.2
per-cent are employed.3 According to the ILO definition of employment, this
includes everyone who worked in the production of goods or services for pay or profit at least an hour during the calendar week preceding the interview. It also includes individuals temporarily absent from work because of health issues, vacation, or maternity or paternity leave; individuals who are away from work for less than a month or from one to three months; and individuals still receiving pay, while not working. Individuals who worked producing goods or services exclusively for household consumption are not considered employed in the ILO definition, nor are individuals who do not work for pay or profit. If any part of a household’s production is sold, work in agriculture is considered employment under the ILO definition.
Over 9 percent of the working-age population was not employed and was available for work, but only one-third of these were actively looking for work.
Overview
6 Overview
Findings from the 2014 Labor Force Survey in Sierra Leone http://dx.doi.org/10.1596/978-1-4648-0742-8 This implies that 2.8 percent of the working-age population was unemployed under the ILO definition (unemployed, available, and looking); the remainder of those not employed, though available, were in broad unemployment (unem-ployed, available, but not looking). Not all people who are not working are avail-able for work: some are in school; others may be at home fulfilling responsibilities such as child or elderly care; and still others may be disabled and unable to par-ticipate in the labor market. Among people without jobs who are available to work, there may be many reasons why they are not looking for work (see section “Unemployment”).
Combining the employed and the unemployed results in a labor force par-ticipation rate of 65.0 percent and 71.3 percent, based on the ILO definition or
the broader definition of unemployment, respectively.4 The remaining people are
out of the labor force, implying an inactivity rate of 35.0 percent under the ILO definition and 28.7 under the broader definition. Of the working-age population, 6.4 percent are not working and are available for work, though they are not actively searching.
Labor force participation varies widely by educational attainment, but much less across population subgroups defined otherwise than by education. Over 80.0 percent of the most well educated participate in the labor market, whereas the share is only 44.2 percent among those who have only completed primary school. By contrast, the difference in participation rates between men and women is small (only 1.2 percentage points lower among women), as are the
Photo 1.1 A fisherman in Bonthe prepares to cast his net
Table 1.1 K ey A ggr ega te L abor Mark et S ta tistics Emplo yed (%) Unemplo yed (IL O) (%) Unemplo yed (br oad) (%) W ork ing-age population W orkfor ce (IL O definition) Labor for ce par ticipation (IL O) (%) Unemplo yment rat e (IL O) (%) O ver all 62.2 2.8 9.1 3,009,472 1,956,912 65.0 4.3 Youth ( AFR) 52.4 3.3 10.1 1,988,575 1,108,067 55.7 5.9 M en 62.4 3.3 8.4 1,367,915 898,394 65.7 5.0 W omen 62.1 2.4 9.7 1,641,557 1,058,518 64.5 3.7 Disabled 63.1 0.9 2.7 82,172 52,573 64.0 1.4 Not disabled 62.2 2.8 9.3 2,927,299 1,904,339 65.1 4.4 M ig ran t 61.2 3.6 8.5 459,684 297,785 64.8 5.6 Not mig ran t 62.5 2.7 9.2 2,537,514 1,653,187 65.1 4.1 Nev er w en t t o school 76.1 2.1 9.1 1,660,372 1,297,325 78.1 2.6 Inc omplet e pr imar y 50.1 3.4 10.6 227,620 121,889 53.5 6.4 C omplet ed pr imar y 41.5 2.8 7.4 421,769 186,606 44.2 6.3 C omplet ed lo w er sec ondar y 42.2 2.9 7.2 382,090 172,534 45.2 6.5 C omplet ed upper sec ondar y 43.7 5.1 11.9 250,002 121,885 48.8 10.5 Tech deg rees + c er tifica tes 74.2 9.8 15.5 50,167 42,146 84.0 11.7 Ter tiar y deg ree 75.1 8.2 11.6 17,451 14,527 83.2 9.8 Ur ban fr eet own 47.9 6.0 12.0 344,326 185,711 53.9 11.1 O ther ur ban 50.4 3.6 7.9 514,825 278,381 54.1 6.7 Rur al 67.3 2.1 8.9 2,150,320 1,492,820 69.4 3.0 East er n 63.8 2.0 7.3 685,102 451,230 65.9 3.1 Nor ther n 69.5 2.8 8.9 1,154,417 834,965 72.3 3.9 Souther n 56.7 1.9 9.5 788,008 462,119 58.6 3.2 W est er n Ar ea 48.8 5.8 12.1 381,944 208,599 54.6 10.7 ce: 2014 Sier ra L eone Labor F or ce Sur vey . e: T he c olumn Emplo yed c or responds t o the t otal emplo yed , divided b y the w or king-age popula tion; the c olumn Unemplo yed (IL O ) c or responds t o the unemplo yed (ac cor ding t o the IL O definition), divided or king-age popula
tion, but the c
olumn Unemplo ymen t R at e (IL O ) c or responds t o the unemplo yed (IL O ), divided b y the w or kf or ce (IL O ). Henc e, Emplo yed + Unemplo yed (IL O ) = Labor f or ce par ticipa O ). B
ecause of missing inf
or
ma
tion, some individuals c
ould not be assig
ned t o a subpopula tion (f or example , mig ran ts). I n these cases
, the sum of the subpopula
tions is less than the o
ver
all popula
tion, and the
tistics f or these subpopula tions r ef er t o individuals who r epor t the inf or ma
tion; individuals on whom da
ta ar e missing ar e ex cluded fr om the calcula tions .
8 Overview
Findings from the 2014 Labor Force Survey in Sierra Leone http://dx.doi.org/10.1596/978-1-4648-0742-8 differences by disability status (the participation rate is 1.1 percentage points lower among the disabled than among the nondisabled) and migration status (the participation rate is 0.5 percentage points lower among migrants than among nonmigrants).
Labor force participation increases rapidly with age (figure 1.1). Labor force participation is 55.7 percent among youth (15–35 age group) and 34.8 percent among youth defined according to the ILO definition (15–24 age group); the rest are out of the labor force, and many are still in school (see chapter 5). Labor force participation averages 85.1 percent among prime-age workers (36–55 age group), but is only 75.3 percent among the elderly of working age (55–64 age group).
Labor force participation varies across geographical areas and is lower in urban areas (map 1.1). The participation rate is 53.9 percent in urban Freetown and 54.1 percent in other urban areas, compared with the considerably higher rate of 69.4 percent in rural areas. The participation rate in Northern Province is the highest: 72.3 percent of the working-age population is either employed or unemployed (ILO), while Southern Province and the Western Area have the lowest participation rates and consequently the highest inactivity rates (41.4 and 45.4 percent are inactive, respectively). Eastern Province is in the middle: the participation rate is 65.9 percent. Inactivity rates across districts run as high as 46.7 percent, in Bo, and as low as 20.6 percent, in Tonkolili. The Western Area Urban District has a relatively low participation rate, 53.8 percent, but other
Figure 1.1 Labor Force Participation Rates (ILO), by Age
0 15 20 25 30 35 40 45 50 55 60 10 20 30 40 Pe rcent Age 50 60 70 80 90 100
Labor force participation rate (ILO) 5-year moving average
relatively urbanized districts such as Kenema (26.8 percent urban) show higher participation rates (66.4 percent).
Statistical analysis of the determinants of the labor market highlights these results, as well as several additional factors (see appendix B). For example, men, individuals with postsecondary degrees, younger workers, and urban residents (including urban Freetown) are significantly more likely to be unem-ployed than, respectively, women, the less well educated, older workers, and rural residents. Women are significantly more likely to be out of the labor force, as are the disabled, people with upper-secondary degrees (and, to a lesser extent, people with lower-secondary degrees), younger people, and urban residents.
The main reason for inactivity is attendance at school or in training programs, especially among urban residents and men (figure 1.2). Taking care of the home or family affects women much more than men, reflecting important gender dif-ferences in the division of household chores. The lack of financial resources to start a new business is a more powerful reason among nonmigrants than among migrants (17.4 percent vs. 9.1 percent) and among rural residents than among urban dwellers (45.4 percent vs. 69 percent).
Over two-thirds of the inactive in the Western Area report the main reason they are not participating in the labor market is that they are in school or
Map 1.1 Labor Force Participation Rates (ILO), by District
Kambia Port Loko Tonkolili Western Rural Pujehun Kenema Kailahun Moyamba Koinadugu Kono Bombali Moyamba Western Rural Bonthe Bo Kenema (76.9,79.4] (75.0,76.9] (67.5,75.0] (66.5,67.5] (66.3,66.5] (55.4,66.3] (53.4,55.4] (53.3 ,53.4] Kambia Port Loko Pujehun Kailahun Western Urban
10 Overview
Findings from the 2014 Labor Force Survey in Sierra Leone http://dx.doi.org/10.1596/978-1-4648-0742-8 undergoing training (figure 1.3). The reason given for not participating in the labor market by people who have some education, but who have not reached higher levels of education (technical degrees, certificates, or tertiary degrees), mostly
revolves around attendance at school or in training programs.5 Lacking financial or
other resources to start a new business and taking care of the home or family are cited disproportionately by people who have never attended school relative to people with some educational attainment.
Figure 1.2 Reasons for Inactivity, by Characteristics of Individuals
Illnes or injury
Taking care of own house or family Lack skill experience
Retired/too young Other reasons
Lack financial or other resources for starting new business In school or training 0 10 20 30 40 50 Pe rcen t 60 70 80 90 100
Men Women Other Rural
urban Urban Freetown Not migrant Migrant Not disabled Disabled Youth Overall
Source: 2014 Sierra Leone Labor Force Survey.
Note: “Other reasons” in figure 1.2 and figure 1.3 include waiting for replies to inquiries, does not want to work, disabled,
discouraged, off-season, pregnant, transportation problems, waiting to start new job or business, and so on.
Figure 1.3 Reasons for Inactivity, by Province and Educational Attainment
In school or training
Taking care of own house or family Retired/too young
Other reasons
Lack financial or other resources for starting new business Lack Skill Experience
Illnes or injury 0 10 20 30 40 50 60 Pe rcen t 70 80 90 100 Tertiary degree Tech degrees + certificates Never went to school Incomplete
primary Completedprimary Completedupper Eastern Northern Southern WesternArea secondary
Completed lower secondary
Employment
The share of the working-age population that is actually employed varies great-ly across the country (map 1.2). Tonkolili District, where 77.2 percent of the working-age population is in employment, has the highest employment-to-population ratio, and Kailahun (76.2 percent) and Kambia (75.6 percent)
dis-tricts are not far behind.6 At the other end of the spectrum, the Western Area
Urban District (47.8 percent), Kono (50.9 percent), Moyamba (52.5 percent), and Bo (52.5 percent) have the lowest employment rates. Although unemploy-ment rates and the employunemploy-ment-to-population ratio are highly (negatively) correlated (−0.665), variations in labor force participation can also affect employment rates.
Employment can be characterized by the type of job and the sector of employment activity. This report considers self-employment, decomposed into agricultural and nonagricultural self-employment, and wage and salary
employ-ment among possible job types.7 Unpaid labor is also considered a type of job,
although it is not considered employment by the ILO. The sectors of employ-ment are agriculture, fishing, and forestry; mining and extractive industries; manufacturing and utilities; construction; and services. A summary of key employment statistics using these decompositions is presented in table 1.2.
Map 1.2 The Employment-to-Population Ratio
Koinadugu Kono Kono Bombali Kambia Kailahun Kambia Port Loko Pujehun Port Loko Tonkolili Moyamba Western Rural Western Rural Bonthe Bonthe Pujehun Bo Kenema Kailahun (76.3,77.2] (72.1,76.3] (65.2,72.1] (64.0,65.2] (63.1,64.0] (52.5,63.1] (50.9,52.5] (47.3,50.9] Western Urban Western Urban
Table 1.2 K ey Emplo ymen t S ta tistics Agricultur al Self-Emplo yment (%) Nonagricultur al Self-Emplo yment (%) W age Emplo yment (%) Unpaid Labor a (%) Agricultur e, F ishing and F or estr y (%) M ining and Ex tr ac tiv e Industries (%) Man uf ac turing and Utilities (%) Construc tion (%) Ser vic es (%) O ver all 59.2 31.3 9.5 6.5 61.1 1.5 2.8 1.2 33.4 Youth ( AFR) 58.8 31.9 9.3 7.5 61.1 1.2 3.1 1.3 33.2 M en 59.7 24.8 15.5 6.6 62.2 3.0 5.6 2.7 26.6 W omen 58.7 36.8 4.5 6.4 60.1 0.2 0.5 0.1 39.2 Disabled 61.9 30.7 7.5 6.6 62.5 0.1 4.6 0.6 32.2 Not disabled 59.1 31.4 9.6 6.5 61.0 1.5 2.8 1.3 33.4 M ig ran t 27.0 48.3 24.7 4.3 28.8 5.4 3.5 3.3 59.0 Not mig ran t 64.9 28.4 6.8 6.9 66.6 0.8 2.7 0.9 29.0 Nev er w en t t o school 69.8 27.7 2.5 6.5 71.4 1.3 1.7 0.7 24.9 Inc omplet e pr imar y 52.4 40.4 7.2 8.5 54.5 1.9 4.5 1.4 37.6 C omplet ed pr imar y 47.8 41.5 10.7 9.3 50.9 1.3 6.7 2.6 38.5 C omplet ed lo w er sec ondar y 35.0 44.8 20.2 5.5 37.7 1.8 4.9 1.8 53.8 C omplet ed upper sec ondar y 21.8 36.9 41.4 3.1 23.5 2.5 4.6 3.6 65.8 Tech deg rees + c er tifica tes 9.0 17.0 74.1 1.6 8.8 1.2 2.9 3.2 83.9 Ter tiar y deg ree 0.0 10.3 89.7 0.0 1.3 1.7 0.3 2.3 94.3 Ur ban fr eet own 0.5 59.0 40.5 2.6 0.6 0.1 6.5 6.1 86.6 O ther ur ban 21.3 56.8 21.8 5.1 24.0 4.1 4.3 2.1 65.6 Rur al 72.9 23.5 3.6 7.1 74.4 1.1 2.2 0.5 21.7 East er n 71.8 22.5 5.6 3.3 72.5 3.1 1.9 1.1 21.4 Nor ther n 66.5 28.9 4.6 6.1 67.7 0.3 2.7 0.8 28.5 Souther n 56.7 32.9 10.4 11.8 61.5 2.4 2.5 0.4 33.1 W est er n Ar ea 3.4 59.2 37.5 2.4 3.6 0.2 6.1 5.7 84.4 Sour ce: 2014 Sier ra L eone Labor F or ce Sur vey . Not e: B
ecause of missing inf
or
ma
tion, some individuals c
ould not be assig
ned t
o a subpopula
tion. I
n these cases
, the sum of the subpopula
tions is less than the o
ver
all popula
tion, and the sta
tistics on these subpopula tions r ef er t o individuals who r epor t the inf or ma
tion; individuals on whom da
ta ar e missing ar e ex cluded fr om the calcula tions .
a. Unpaid labor is not c
onsider ed emplo ymen t in the IL O definitions; so , the shar es of job t ypes among IL O -r ec og niz ed emplo ymen t (ag ricultur al and nonag ricultur al self-emplo ymen t and w age emplo ymen t) sums t o 100 per cen t. The da ta on unpaid labor r epr esen
t the number of unpaid w
or
kers as a per
cen
tage of the t
otal number of emplo
yed (IL O ) w or kers . 12
Job Types
Most workers are self-employed or employed in farming or household enter-prises, while few earn wages or salaries in exchange for their labor. The vast majority of workers (91.0 percent) are self-employed: 59.2 percent in agricul-tural self-employment, and around one-third (31.3 percent) in nonagriculagricul-tural self-employment, while only 9.5 percent are wage workers. This is consistent with the above-mentioned results indicating that employment rates are higher in rural areas than in urban areas and are roughly comparable with rates in other countries in Sub-Saharan Africa, although the share in wage labor is slightly
lower, and the share in nonagricultural self-employment is slightly higher.8
Moreover, if most individuals consider the norm to be self-employment rather than wage employment, it is not surprising that (broad) unemployed workers are far more concerned about access to capital (needed to start a self-employment venture) than about the availability of jobs (implying wage employment), as sug-gested in section “Reasons Not to Search for Work”.
Education is a key determinant of the type of job a person occupies. Nearly 90 percent of employed individuals with tertiary degrees work in wage jobs; none of the interviewed individuals with tertiary degrees were working in agriculture or as unpaid labor. Conversely, only 2.5 percent of the employed who have never attended school work in wage jobs, whereas 69.8 percent work in agricultural self-employment, and an additional 6.5 percent (relative to the total number of employed) are working without pay. Nonagricultural self-employment includes employed individuals at all levels of educational attainment, but this is particu-larly the case among individuals who started school, but did not continue beyond upper-secondary education. A relatively large share of workers with low educa-tional attainment are in unpaid work: 9.3 percent of workers who have only completed primary school and 8.5 percent of workers who have some primary school, but have not completed it.
Most wage jobs are concentrated in urban areas and among certain demo-graphic groups such as men and migrants. The majority (71 percent) of wage jobs are in Freetown and other urban areas. Beyond the obvious distributions of job types, with more agricultural employment in rural areas and less in the Western Area, there are less straightforward differences in the types of jobs among the various categories of the employed population. For example, if they have jobs, women are much less likely than men to be in wage employment (4.5 percent among women vs. 15.5 percent among men), but this gap is more than offset by the higher share of women in nonagricultural self-employment (36.8 percent vs. 24.8 percent among men). Employed migrant workers are much more likely than employed nonmigrant workers to be in wage jobs in part because, in nearly one-fifth of all cases, employed migrants have moved to the districts in which they had found wage work. Employed migrants are also significantly less likely to be in agricultural self-employment, a result largely linked to the fact that over 40 percent of migrants reside in the Western Area Urban District, where agricul-tural employment is practically nonexistent.
14 Overview
Findings from the 2014 Labor Force Survey in Sierra Leone http://dx.doi.org/10.1596/978-1-4648-0742-8 People who start out young in the labor force tend, as they become older, to end up in wage work and nonagricultural self-employment, but not in unpaid work (figure 1.4). Among the employed between 15 and 19 years of age, an aver-age of 15.7 percent were primarily engaver-aged in unpaid labor, while only 2.1 per-cent had wage jobs, and 24.0 perper-cent were in nonagricultural self-employment. By ages 36–40, 8.9 percent had a wage job, 29.5 percent were in nonagricultural wage employment, and only 3.7 percent were working without pay. Agricultural self-employment remained relatively stable, averaging 58.2 percent of all jobs among 15–19-year-olds who were working and 57.9 percent among people 36–40 years old.
The types of jobs available and the use of unpaid labor also vary widely across districts (map 1.3). Agricultural self-employment is more prevalent in more rural districts such as Kailahun (93.0 percent of all jobs, 82.4 percent rural), Kambia (73.7 percent of jobs, 83.0 percent rural), and Tonkolili (79.3 percent of jobs, 91.3 percent rural). Perhaps, surprisingly, the highly rural districts of Moyamba (90.1 percent rural) and Koinadugu (93.1 percent rural) had relatively fewer agricultural self-employment jobs (60.9 percent and 60.7 percent, respectively) and a relatively large share of nonagricultural self-employment (34.9 percent and 31.4 percent, respectively). In the Western Area Urban District, most jobs (58.9 percent) are in nonagricultural self-employment, and wage employment makes up almost all the remainder (40.7 percent).
A statistical analysis of the determinants of job types confirms many of these
conclusions.9 The chances of occupying a wage job increase significantly with
educational attainment, whereas the likelihood of working in nonagricultural self-employment decreases with education. Men are more likely than women to be wage employees or in nonagricultural self-employment and are even slightly more likely to be unpaid contributing family workers. Wage work is
Figure 1.4 Job Types, by Age
15 0 10 20 30 Pe rcent 40 50 60 70 20 25 30 35 40 45 50 55 60 Agricultural self-employment (5-year moving average)
Wage employment (5-year moving average)
Unpaid labor (5-year moving average)
Nonagricultural self-employment (5-year moving average)
significantly more prevalent in Freetown and other urban areas than in rural areas, as is nonagricultural self-employment. The likelihood of being a wage worker or in nonagricultural self-employment increases with age up to the 30–34 age group, then decreases as people age. Wage work is more likely to be found in mining and, especially, manufacturing than in services and less likely to be found in agriculture.
Sector of Employment
Overall, the agricultural sector provides most jobs, with services the second most important source of jobs; mining makes only a minor contribution to jobs. The agricultural and services sectors provide 61.1 percent and 33.4 per-cent of all jobs, respectively. Although much attention has been paid to mining and extractive industries, this sector only provides 1.4 percent of all jobs, similar to the share provided by construction (1.2 percent). Although it sup-plies jobs to only 2.8 percent of the employed, manufacturing is a relatively crucial source of employment among people who started school, but never completed more than secondary school (as high as 6.6 percent of jobs among people who completed only primary school), men (5.5 percent), and urban dwellers (5.1 percent).
The relative importance of each sector varies dramatically across the country (map 1.4). As noted in section “Job Types,” many rural districts are overwhelm-ingly focused on the agricultural sector (93 percent of jobs in Kailahun,
Map 1.3 Job Types, by District
WageEmp Unpaid AgSelfEmp NonAgSelfEmp
16 Overview
Findings from the 2014 Labor Force Survey in Sierra Leone http://dx.doi.org/10.1596/978-1-4648-0742-8 79.3 percent in Tonkolili, and 73.7 percent in Kambia). The service sector is the provider of more jobs in more urban districts such as the districts in the Western Area (86.6 percent of jobs in the Western Area Urban District and 67.4 percent in the Western Area Rural District), Bo (45.1 percent of jobs), and Kono (53.7 percent). Jobs in the mining and extraction sector are mainly found in Kono (6.1 percent of employment), Bo (4.6 percent), and Kenema (4.1 percent), while manufacturing jobs are spread throughout the country, with the exception of Pujehun (0.7 percent of jobs), Bombali (0.9 percent), and Kambia (0.9 percent), where they are especially rare.
The vast majority of people working in the agricultural sector are self-employed, but the importance of self-employment in other sectors varies (table 1.3). Nearly all jobs in the agricultural sector (90.7 percent) are in self-employment. Jobs in the manufacturing and utilities sector are accounted for largely by the self-employed (71.9 percent), suggesting that unexploited econo-mies of scale and opportunities for improving productivity may exist in this sector. Jobs in the service sector are largely accounted for by self-employment (77.6 percent), although it is less clear that the optimal scale of production in many services would require larger firms and more wage labor. Employment in the min-ing and construction sectors is more balanced between wage work and self-employment, but these sectors make up a small share of total employment in most districts, thus explaining the limited penetration of wage employment in the
labor market.10
Map 1.4 Employment Sectors, by District
Agriculture Mining Extraction Manufacturing and Utilities Construction
Services
Type of Institution or Firm
The main economic activity of more than half the employed is work in private farming enterprises or farming cooperatives. Farming cooperatives and private farming enterprises employ 59.6 percent of all workers, and 87.0 percent of these farmworkers are agricultural self-employed (figure 1.5). Nonfarm cooperatives and private farming enterprises employ the second-largest share of workers (31.0 percent), and 79.0 percent of these nonfarm workers are nonagricultural self-employed. Local governments, the central government, public or state-owned enterprises, and parastatal institutions employ 4.2 percent of all workers. Employment in the public sector and related sectors is relatively less preva-lent, concentrated in the capital, and typically occupied by those with
postsec-ondary educational attainment.11 Around 5.0 percent of the employed work in
the public sector, nongovernmental organizations (NGOs), or international organizations. Around 95.0 percent of the individuals who have never attended school and 84.8 percent of those who have completed lower-secondary educa-tion are working in a farm or nonfarm private enterprise or cooperative. Even among people who have completed upper-secondary education, nearly 70 percent are working in a farm or nonfarm private enterprise or cooperative. However, nearly half (49.6 percent) of people with technical degrees or cer-tificates and over half (54.1 percent) of people with tertiary degrees are employed in the public sector. Furthermore, NGOs and international organiza-tions represent a significant share of jobs for these workers, too (10.0 percent of those with technical degrees or certificates and 11.0 percent of those with tertiary degrees). The relative lack of opportunity among the most well-educated workers outside the public sector can be linked to the fragmented nature of the other sectors of the economy. Thus, among workers in farm enter-prises or cooperative workers, only 0.8 percent are wage employees, and, among nonfarm household enterprise or cooperative workers, only 12.3 percent are wage employees. This suggests there is a lost potential in the private sector, given that the country’s most well-educated workers are disproportionately diverted toward the public sector, NGOs, and international organizations and away from private sector employers.
Table 1.3 Job Type, by Sector of Activity
Sector of activity Agricultural self-employment (%) Nonagricultural self-employment (%) Wage employment (%) Unpaid labor (%)
Agriculture, fishing and forestry 90.7 0.0 0.8 8.5
Mining and extractive industries 0.0 51.0 44.8 4.1
Manufacturing and utilities 0.0 71.9 19.1 9.0
Construction 0.0 46.0 52.9 1.1
Services 0.0 77.6 19.6 2.9