HAL Id: hal-00669498
https://hal.archives-ouvertes.fr/hal-00669498
Submitted on 13 Feb 2012
HAL is a multi-disciplinary open access archive for the deposit and dissemination of sci-entific research documents, whether they are pub-lished or not. The documents may come from teaching and research institutions in France or
L’archive ouverte pluridisciplinaire HAL, est destinée au dépôt et à la diffusion de documents scientifiques de niveau recherche, publiés ou non, émanant des établissements d’enseignement et de recherche français ou étrangers, des laboratoires
An atomistic reconstruction of the nanostructure of
pyrolitic carbons guided by HRTEM data
Jean-Marc Leyssale, Jean-Pierre da Costa, Christian Germain, Patrick
Weisbecker, Gerard L. Vignoles
To cite this version:
Jean-Marc Leyssale, Jean-Pierre da Costa, Christian Germain, Patrick Weisbecker, Gerard L. Vig-noles. An atomistic reconstruction of the nanostructure of pyrolitic carbons guided by HRTEM data. 2009 MRS Fall Meeting Symposium NN proceedings, Nov 2009, Boston, United States. pp.50-59. �hal-00669498�
An atomistic reconstruction of the nanostructure of pyrolitic carbons guided by HRTEM data
Jean-Marc Leyssale1, Jean-Pierre Da Costa2, Christian Germain2, Patrick Weisbecker1 and Gérard L. Vignoles3
1CNRS UMR 5801, Laboratoire des Composites ThermoStructuraux (CNRS/Snecma Propulsion Solide/CEA/Université Bordeaux 1), 3 allée de La Boetie,
33600 Pessac, France.
2Laboratoire IMS, UMR 5218 (Université Bordeaux I/ENSEIRB/ENSCPB/ENITAB), 351 Cours de la Libération, 33405 Talence cedex, France.
3
Université Bordeaux 1, UMR 5801, Laboratoire des Composites ThermoStructuraux (CNRS/Snecma Propulsion Solide/CEA/Université Bordeaux 1), 3 allée de La Boetie,
33600 Pessac, France.
ABSTRACT
A new method for the generation of atomistic models of dense nanotextured carbons is presented. This method is based on the statistical analysis of HRTEM images and their three-dimensional extension through image synthesis under constraint. The resulting 3D images then serve as an external potential bringing the atoms to settle preferentially on the white areas during a conventional simulated annealing simulation. Application of this method to the case of two laminar pyrocarbons, differing in their degree of disorder, highlights the promising nature of this approach.
INTRODUCTION
Atomistic reconstruction methods are nowadays well-established tools for linking experimental characterization data to the atomic scale structure of matter [1]. Most of them are based on the reproduction of orientation-averaged structural features like the pair distribution functions (PDFs) so that these methods are usually very efficient for isotropic systems. However, when dealing with materials displaying a neatly anisotropic nanotexture, like most dense graphene-based carbons, the success of such approaches relies strongly on the initial guess of the atomic structure [2]. In crude terms, this means the failure of these methods for that class of materials. For instance, two PDF-based computer reconstructions of the same material [3] show a drastically different nanotexture: one, quite isotropic, is an amorphous carbon with a dominating sp2 character [4] while the other one is a strongly anisotropic stack of faulted graphene sheets [5].
Nowadays, the nanotexture of turbostratic carbons, like for instance the pyrocarbon matrices present in many industrial C/C composites [6], is usually described from High Resolution Transmission Electron Microscopy (HRTEM) lattice fringe images [7]. Although the information provided by this technique is mainly qualitative, recent developments in image analysis methods allow a finer description of the nanotexture to be drawn [8-11].
We propose here a new atomistic reconstruction strategy based on the information provided by such HRTEM images. The two steps of this method, i.e. (i) synthesis of 3D “HRTEM-like” images from 2D experimental HRTEM images under an orthotropy assumption
and (ii) molecular dynamics annealing simulations using the synthetic 3D images as a complementary energy term to the interatomic potential, are described in this what follows. This new reconstruction strategy is then applied to two HRTEM images of a rough laminar pyrocarbon. The first image is typical of an as prepared material whereas the second one concerns a heat treated, partially graphitized material.
THEORY
Image analysis/synthesis
To synthesize 3D HRTEM-like images, we use an original pyramidal analysis/synthesis scheme derived from a standard 2D approach [12]. The novel procedure breaks down into three steps:
(i) 2D analysis: decomposition of the HRTEM image sample into a set of multi-resolution subbands using the steerable pyramid decomposition [12]; statistical analysis of the subbands; production of a pyramidal collection of first order (mean, variance, skewness, kurtosis) and second order (autocorrelation coefficients) 2D statistics. All the analysis is performed on experimental HRTEM images after application of a radial and directional band-pass filter to remove low-frequency (background gradients) and high-frequency (noise) artifacts. This filtering also has the benefit of making the images circular (or periodic), a suitable property for image synthesis and atomistic reconstruction methods.
(ii) 2D to 3D statistical inference: production of a pyramidal collection of 3D target statistics. (iii) 3D HRTEM-like image synthesis: a 3D data block, initially random, is alternately decomposed using a 3D pyramidal decomposition, modified to meet the 3D target statistics, reconstructed, re-decomposed, etc.
The main difficulty of this new approach is to obtain 3D target statistics from the analysis of 2D experimental images. This is trivial for first order statistics (mean, variance, skewness and kurtosis), the main difficulty is in determining target 3D autocorrelation coefficients r3D(x,y,z)
from the reference 2D autocorrelation coefficients r2D(u,v). Such statistics describe the
dependence relationship between two pixels in a texture (respectively two voxels in a solid texture). In the case of dense pre-graphitic carbons, texture anisotropy comes from the property of orthotropy. The latter can be stated as follows: all 2D views containing the direction of orthotropy, the stacking direction of graphene sheets, have the same statistical properties. For instance the direction of orthotropy on the two HRTEM images of Fig 1 (Fig 1a and 1b) is the vertical direction.
Let (O, x, z) be the 2D Cartesian coordinate system of the image sample. The labels x and
z refer respectively to the horizontal and vertical directions. Let y be the direction orthogonal to x
and z so that the system (O, x, y, z) is orthonormal. 3D autocorrelation coefficients are related to 2D coefficients through polar/spherical coordinates:
3 ( , , ) 3 ( , , ) 3 ( , 0, ) 2 ( , ) 2 ( cos , sin ). sph sph pol D D D D D orthotropy r x y z =r ρ θ ϕ = r ρ ϕ =r ρ φ =r ρ ϕ ρ ϕ (1)
In other words, r3D(x,y,z), can thus be deduced from r2D(u,v) by interpolation.
Once inferred from 2D, the target statistics have to be imposed on a 3D random block through an ad hoc multi-resolution framework. This framework must be based on a pyramidal decomposition adapted to the anisotropic nature of the 3D textures addressed. Each 3D subband must relate to one specific 2D subband so that the imposition of the autocorrelation coefficients of the 2D subband on the 3D subband makes sense.
Let B3D(ω) be any of the frequency filters used in the 3D pyramidal decomposition to extract a
specific subband. Let ω denote a 3D frequency, (ωz,ωy,ωz) its expression in Cartesian
coordinates and (ωρ,ωθ,ωφ) its expression in spherical coordinates. We have just seen above that the 3D autocorrelation coefficients do not depend on θ. For the same reason, the 3D expressions of the frequency filters used for the 3D multiscale decomposition must not depend on ωθ, i.e.:
B3D(ω)=B3D(ωx,ωy,ωz)=B3Dsph
(ωρ,ωθ,ωϕ)=B3Dsph
(ωρ,0,ωϕ)=B2Dpol
(ωρ,ωϕ)=B2D(ωρcosωϕ,ωρsinωϕ). (2) In other words, the 3D frequency filters can be deduced from the 2D frequency filters by interpolation.
This analysis/synthesis method is applied in what follows to the filtered experimental images of two rough laminar pyrocarbons : “as prepared (AP)” (Fig 1a) and “heat-treated (HT)” (Fig 1b). Figs 1a (and 1c) and 1b (and 1d) span (in average) on respectively 16 and 17 fringes. The steerable pyramid decomposition is performed with 3 levels and 4 orientations. Autocorrelation coefficients are taken on 7x7 neighborhoods.
Atomistic reconstruction
Starting from the 3D synthetic images, cubic simulation boxes of compatible sizes (number of fringes multiplied by the suited interlayer spacing d002) are created and randomly
filled by carbon atoms to generate a system at the suited density. No heteroatoms are considered in this work. Typical pyrocarbon values of d002 and of the density, respectively 3.5 Å and 2.1
g/cm3, are adopted. This corresponds to 18507 and 22198 atoms for respectively the AP and HT pyrocarbon images of Figs 1a and 1b.
After a short Hard-Sphere Metropolis Monte Carlo simulation (to ensure that no C-C distance is below 1.3 Å), random initial velocities corresponding to a high temperature (8000 K) are assigned to the system and a realistic interatomic potential, the second generation REBO potential [14] is switched on. The REBO energy is defined as
[
]
∑∑
= > − = N i j i ij A ij ij R ij c REBO r V b r V r f V 1 ) ( ) ( ) ( (3).where N is the number of atoms, rij is the distance between atoms i and j, fc(r) is a switching
respectively the repulsive and attractive potentials and bij is an empirical bond order term,
depending on both the environments of atoms i and j, and which properly takes into account the different bonding possibilities of carbon. This potential, which forces the system to adopt a proper carbon bonding, is complemented by an external energy term VHRTEM to impose the
nanotexture of the 3D image to the system. We chose here VHRTEM to be a simple linear function
of the greyscale level:
VHRTEM = kimI(ri)
i=1 N
∑
(4).where kim is a proportionality factor and I(ri) is the greyscale level (ranging from 0 to 1 for
respectively white and black voxels) corresponding to the position ri of atom i.
A simulated annealing procedure is then launched using molecular dynamics together with the stochastic thermostatting method of Andersen [15]. During this simulation the system is “slowly” cooled from its initial temperature down to 0 K by adjusting the target temperature of the thermostat at each timestep. Such a procedure mimics the dynamics of a carbon system cooled from the liquid state in the presence of an external field (the 3D image potential) bringing the system to a given nanotexture. Tuning the relative importance of the two terms of the potential by changing the value of kim allows to get a good balance between finding low energy
structures and obtaining the suited nanotexture.
Preliminary simulations performed on smaller images (13 fringes height, not presented here) showed that a value of kim = 2 eV, approximately one fourth of the sp2 carbon energy, is
very appropriate. For the cooling rate, these simulations revealed that a non uniform cooling (fast cooling at high and low temperatures and slow cooling at intermediate temperatures) was the optimal solution. In this work we adopted the following cooling sequence: 125 K/ps (T > 7000 K), 25 K/ps (7000 K ≥ T > 6000 K), 5 K/ps (6000 K ≥ T > 5000 K), 1 K/ps (5000 K ≥ T > 4000 K), 5 K/ps (4000 K ≥ T > 3000 K), 25 K/ps (3000 K ≥ T > 2000 K) and 125 K/ps (2000 K ≥ T). This temperature ramp, with the slower cooling rate (1 K/ps) around the carbon melting point gives lower final energies and higher sp2 fractions than for instance the much more computationally expensive uniform cooling at 2 K/ps.
After completion of the annealing, and in order to avoid any bias that the image potential could introduce, this term is switched off and the REBO potential is replaced by the AIREBO potential of Stuart [16]. This potential is a modification of the REBO potential, incorporating in an adaptive manner the van der Waals interactions occurring between non-bonded atoms (interactions between different graphitic sheets). At that point the system is relaxed for some picoseconds at a constant temperature of 300 K before calculation of properties.
DISCUSSION
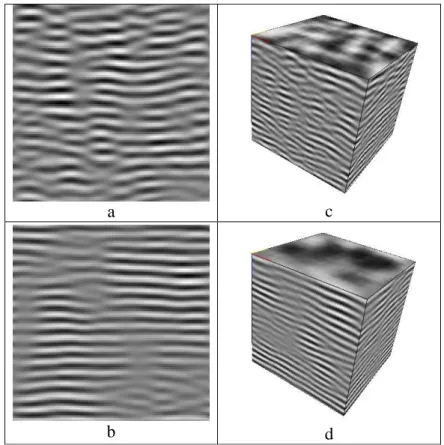
The two filtered experimental HRTEM images on which the statistical analysis has been performed are presented in Fig 1 together with the two corresponding synthesized 3D HRTEM-like images.
a c
b d
Figure 1: Filtered experimental HRTEM images of an “as prepared (AP)” (a) and a “heat-treated (HT)”
(b) rough laminar pyrocarbon. Subfigures (c) and (d) show the 3D HRTEM-like images synthesized from target statistics collected from subfigures (a) and (b) respectively.
As can be seen in Fig 1, the synthetic 3D images of Figs 1c and 1d exhibit anisotropy properties similar to those observed in the HRTEM samples of Figs 1a and 1b. Particularly, straight and distorted fringe lengths and disorientations observed on Fig 1c (respectively 1d), though not evaluated quantitatively, seem to be quite similar to the ones observed on the HRTEM sample of Fig 1a (respectively 1b). More precisely, the fringes observed for the AP sample (Figs. 1a and 1c) appear to be much less extended and more curved than those of the HT sample (Figs 1b and 1d).
The atomistic configurations obtained for the two materials at the end of the above described reconstruction procedure are shown in Fig. 2.
a b
Figure 2: Reconstructed atomistic models of “as prepared (AP)” (a) and “heat treated (HT)” (b) rough
laminar pyrocarbons. Blue sticks: bonds between carbon atoms in pure C6 rings; Orange sticks: other C-C
bonds.
As can be seen on this figure, the two atomistic models show a well pronounced laminar nanotexture, typical of pyrocarbons. Carbon bonding in these two models is almost entirely of sp2 nature for both models (97 and 99% for respectively AP and HT pyCs), the remaining carbon atoms being mainly sp3 (with some traces of sp) hybridized. In order to better characterize the materials, we performed an analysis of ring statistics, limited to three-coordinated atoms, according to the “shortest path ring” (SPR) algorithm of Franzblau [17]. We found that, on average, one carbon atom belongs to respectively 2.53 and 2.81 SPR for respectively the AP and HT pyCs (in graphite each atom belongs to three SPR for comparison). Moreover, a similar repartition of rings is found in the two materials with respectively 88.6 and 88.9 % of six-member rings (C6), 5.5 and 5.4 % of 5-member rings (C5) and 5.7 and 5.5 % of 7-member rings
(C7) for respectively the AP and HT models. In both cases a low fraction (0.2 %) of
eight-member rings (C8) has also been observed. Although these fractions of non-hexagonal rings
(around 11 %) are relatively high, we expect that lowering the annealing rate will increase the fraction of hexagonal rings, at least in the case of the HT material as heat treatment is supposed to anneal some structural defects.
To further unravel the nanostructural features of the reconstructed models, we performed a search for “pure C6“ rings , namely those C6 rings whose atoms belong only to C6 rings. In Fig
2, pure C6 rings are shown with blue sticks while other C-C bonds are shown in orange.
Although no quantitative results are provided in this paper, visual comparison of Figs 2a and 2b shows that the HT model presents a much higher degree of order than the AP one. Indeed, pure C6 domains appear to be more extended in HT than AP. This leads to quite straight carbon sheets
in the HT model as compared to the undulated ones observed in the AP model. Even if the fractions of non hexagonal rings are similar in the two materials, we can see on Fig 2 that such rings are rather involved in inter-sheets connections in the AP model (Fig 2a) while they are mainly present as intra-sheet disorder in the HT model (Fig 2b). The important fraction of non
hexagonal rings in rather flat sheets (Fig 2b) is explained by the segregation of such rings in some disordered but flat domains with neighboring C5 and C7 rings like in the well-known
Stone-Wales defects.
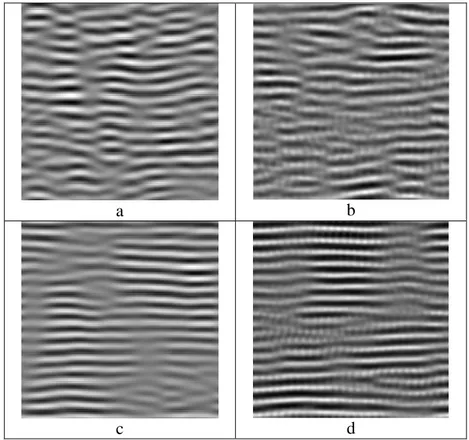
Going back to the very beginning of this work, we show again in Fig. 3 the HRTEM images of the AP (Fig. 3a) and HT (Fig. 3d) pyCs together with those simulated from the AP (Figs 3b and 3c) and HT (Figs 3e and 3f) atomistic models using the NCEMSS HRTEM simulation software of Kilaas [18].
a b
c d
Figure 3: Filtered experimental HRTEM images of an “as prepared (AP)” (a) and a “heat treated (HT)”
(b) rough laminar pyrocarbon. Simulated HRTEM images obtained from the reconstructed atomistic models of the AP (c) and HT (d) pyCs.
Apart from differences in contrast, the similarity in terms of fringes undulations and junctions, between initial images (Figs a and b) and their corresponding simulated images (Figs c and d) is obvious and confirm that the atomistic models contain most of the nanotextural information present in the HRTEM images. Note that a high-frequency signal, corresponding to the presence of atoms, is observed in the simulated images (Figs 3b and 3d) and was removed from the experimental images (Figs 3a and 3b) due to filtering.
As a last check up of our atomistic models, we plot on Fig. 4 the reduced Pair Distribution Functions (PDF) computed for the AP and HT models. The reduced PDF or G(r) is defined as :
G(r)
=
4
πρ
0r g(r)
[
−
1
]
(5).where r is the interatomic distance, ρ0 is the number density and g(r) is the atomic pair
distribution function defining the normalized probability of finding two atoms distant by r :
(
)
∑∑
= ≠ − = N i j i ij r r N r g 1 0 1 ) ( δ ρ (6).Even though it is theoretically possible to measure the PDF of pyrocarbons, the difficulty to obtain these materials (usually deposited on fibrous performs) in bulk quantity, required to perform X-ray or Neutron scattering experiments, probably explains why this function has never been published for such materials. Nevertheless, we also show, for comparison purposes, the experimental G(r) of a nanoporous disordered carbon [3] and the computed G(r) of an ideal hexagonal graphite lattice on Fig. 4.
Figure 4: Room temperature Reduced Pair Distribution Function of reconstructed atomistic models of “as
prepared (AP)” (full circles) and “heat treated (HT)” (straight line) pyrocarbons. Also displayed are the experimental PDF of a nanoporous carbon [3] (dashed line and empty squares) and the computed PDF of ideal hexagonal graphite (dotted line).
We easily observe that the two pyC models have almost identical PDFs. This is not surprising as the PDF is an orientation-averaged measure of local order, and the two models have very similar structures in the investigated length range. When compared to the nanoporous carbon and to graphite we see that the models possess the typical structure of dense carbons, with all intra- and inter-layer peaks presents. However, when compared for instance to the nanoporous carbon PDF measurements of Petkov et al. [3], we see that some peaks in the pyrocarbon PDFs are wider and less pronounced (see for instance the third neighbor peak at 2.9 Å or the peak at 6.6 Å). This can be due to the relatively high fraction (around 11 %) of non-hexagonal rings in our models while Petkov’s PDF has been modeled with atomistic configuration comprising zero [4] to 5% [5] of such rings.
CONCLUSIONS
In this paper we have proposed a new method, based on HRTEM data, for the atomistic reconstruction of nanotextured carbons. This method has been applied to two nanotextures typical of rough laminar pyrocarbons. The first one corresponds to an as prepared material and the second one to a heat treated pyrocarbon. This new image guided method has led to relatively satisfactory models. Indeed, the nanotextures of the two models, as well as the differences between them, are fairly compatible with what we know from the experimental samples (namely, the initial HRTEM images). Moreover, on the chemical point of view, the atomistic models are typical of sp2 carbons and present well defined aromatic domains, well stacked along the orthotropy axis. However, at that point, the number of non-hexagonal rings (11 %) is slightly larger that what we would expect (a few percents) for such dense pre-graphitic carbons. The latter point is confirmed by the observation of the PDF, showing larger peaks than for instance the nanoporous carbon studied by Petkov et al. [3]. Nevertheless, we have reasons to believe that this “chemical quality” can be neatly improved by lowering the rate of the simulated annealing process or by including in this process, together with the 3D image, a penalty term based on an experimental PDF, if available. Such an approach has been used by Jain et al. [19] in the simpler case of low density porous carbons. Furthermore, introduction of H atoms in the simulated structures will also help in this direction.
ACKNOWLEDGMENTS (OPTIONAL)
We thank R. Vitti for his contributions to the early stages of this project. Dr R. J.-M. Pellenq is gratefully acknowledge by JML and GLV for useful discussions and advices about this work.
REFERENCES
1. M. T. Dove, M. G. Tucker, S. A. Wells, D. A. Keen, EMU Notes in Mineralogy 4 (2002) 59. 2. P. Zetterström, S. Urbonaite, F. Lindberg, R. G. Delaplane, J. Leis, G. Svensson, J. Phys.: Condens. Matter. 17 (2005) 3509.
3. V. Petkov, R.G. DiFrancesco, S. J. L. Billinge, M. Acharaya, H.C. Foley, Phil Mag. B 79 (1999) 1519.
4. M. Acharya, M. S. Strano, J. P. Mathews, S. J. L. Billinge, V. Petkov, S. Subramoney, H. C. Foley, Phil. Mag. B 79 (1999) 1499.
5. M. A. Smith, H. C. Foley, R. F. Lobo, Carbon 42 (2004) 2041.
6. G. L. Vignoles , F. Langlais, C. Descamps, A. Mouchon, H. Le Poche, N. Bertrand, N. Reuge, Surface and Coatings Technology 188-189 (2004) 241.
7. A. Oberlin, Carbon 40 (2002) 7.
8. H. S. Shim, R. H. Hurt, N. Y. C. Yang, Carbon 38 (2000) 29.
9. J.-N. Rouzaud, C. Clinard, Fuel Processing Technology, 77-78 (2002) 229.
10. C. Germain, J.-P. Da Costa, O. Lavialle, P. Baylou, Signal Processing 83 (2003) 1487. 11. J.-P. Da Costa, C. Germain, P. Baylou, M. Cataldi, An image analysis approach for the structural characterization of pyrocarbons”, in: Proceedings of Composite Testing, 2004. 12. J. Portilla, E. P. Simoncelli, Int. J. Comput. Vis. 40 (2000) 49.
13. J.P. Da Costa, R. Vitti, C. Germain, G. Vignoles, P. Weisbecker, J.M. Leyssale,
“Synthesizing 3D image representations of dense pre-graphitic carbons from HRTEM images”, in: Proceedings of Carbon 2009 (Topic T11, abstract number 10).
14. D. W. Brenner, O. A. Shenderova, J. A. Harrison, S. J. Stuart, B. Ni, S. B. Sinnott, J. Phys.: Condens. Matter. 14 (2002) 783.
15. M. P. Allen, D. J. Tildesley, Computer Simulation of Liquids, Oxford Univerity Press, 1987. 16. S. J. Stuart, A. B. Tutein, J. A. Harrison, J. Chem. Phys. 112 (2000) 6472.
17. D. S. Franzblau, Phys. Rev. B 44 (1991) 4925.
18. R. Kilaas, Interactive software for simulation of high resoluton TEM images, in: Proceedings of 22nd Annual Conference of the Microbeam Analysis Society, 1987.