HAL Id: hal-02414007
https://hal.archives-ouvertes.fr/hal-02414007
Submitted on 7 Jun 2021
HAL is a multi-disciplinary open access
archive for the deposit and dissemination of
sci-entific research documents, whether they are
pub-lished or not. The documents may come from
teaching and research institutions in France or
abroad, or from public or private research centers.
L’archive ouverte pluridisciplinaire HAL, est
destinée au dépôt et à la diffusion de documents
scientifiques de niveau recherche, publiés ou non,
émanant des établissements d’enseignement et de
recherche français ou étrangers, des laboratoires
publics ou privés.
Distributed under a Creative Commons Attribution| 4.0 International License
predator and links to dive and forage ability
Sam Cox, Matthieu Authier, Florian Orgeret, Henri Weimerskirch, Christophe
Guinet
To cite this version:
Sam Cox, Matthieu Authier, Florian Orgeret, Henri Weimerskirch, Christophe Guinet. High mortality
rates in a juvenile free-ranging marine predator and links to dive and forage ability. Ecology and
Evolution, Wiley Open Access, 2020, 10 (1), pp.410-430. �10.1002/ece3.5905�. �hal-02414007�
410
|
www.ecolevol.org Ecology and Evolution. 2020;10:410–430. Received: 16 April 2019|
Revised: 30 September 2019|
Accepted: 3 November 2019DOI: 10.1002/ece3.5905
O R I G I N A L R E S E A R C H
High mortality rates in a juvenile free-ranging marine predator
and links to dive and forage ability
Sam L. Cox
1,2,3| Matthieu Authier
4,5| Florian Orgeret
1| Henri Weimerskirch
1|
Christophe Guinet
1This is an open access article under the terms of the Creative Commons Attribution License, which permits use, distribution and reproduction in any medium, provided the original work is properly cited.
© 2019 The Authors. Ecology and Evolution published by John Wiley & Sons Ltd.
1Centre d'Etudes Biologique de Chizé, UMR
7372 - CNRS & Universitié de La Rochelle, Villiers-en-Bois, France
2UMR MARBEC, Station Ifremer Séte, Séte,
France
3Centre National d'Études Spatiales (CNES),
Toulouse, France
4Observatoire PELAGIS, UMS 3462 -
Universitié de La Rochelle & CNRS, La Rochelle, France
5ADERA, Pessac Cedex, France Correspondence
Sam L. Cox, Centre d'Etudes Biologique de Chizé, UMR 7372 - CNRS & Universitié de La Rochelle, Villiers-en-Bois 79360, France. Email: slcox417@gmail.com
Funding information
FP7 Ideas: European Research Council, Grant/Award Number: FP7/2007–2013/ ERC-2012-ADG_20120314; Institut Polaire Français Paul Emile Victor, Grant/Award Number: program 109
Abstract
1. High juvenile mortality rates are typical of many long-lived marine vertebrate predators. Insufficient development in dive and forage ability is considered a key driver of this. However, direct links to survival outcome are sparse, particularly in free-ranging marine animals that may not return to land.
2. In this study, we conduct exploratory investigations toward early mortality in ju-venile southern elephant seals Mirounga leonina. Twenty postweaning pups were equipped with (a) a new-generation satellite relay data tag, capable of remotely transmitting fine-scale behavioral movements from accelerometers, and (b) a location transmitting only tag (so that mortality events could be distinguished from device failures). Individuals were followed during their first trip at sea (until mortality or return to land). Two analyses were conducted. First, the behavio-ral movements and encountered environmental conditions of nonsurviving pups were individually compared to temporally concurrent observations from grouped survivors. Second, common causes of mortality were investigated using Cox's pro-portional hazard regression and penalized shrinkage techniques.
3. Nine individuals died (two females and seven males) and 11 survived (eight females and three males). All but one individual died before the return phase of their first trip at sea, and all but one were negatively buoyant. Causes of death were vari-able, although common factors included increased horizontal travel speeds and distances, decreased development in dive and forage ability, and habitat type vis-ited (lower sea surface temperatures and decreased total [eddy] kinetic energy). 4. For long-lived marine vertebrate predators, such as the southern elephant seal,
the first few months of life following independence represent a critical period, when small deviations in behavior from the norm appear sufficient to increase mortality risk. Survival rates may subsequently be particularly vulnerable to changes in climate and environment, which will have concomitant consequences on the demography and dynamics of populations.
1 | INTRODUCTION
For long-lived marine vertebrate predators, insufficient dive and forage ability are considered key drivers of mortality during juvenile and immature stages (Daunt, Afanasyev, Adam, Croxall, & Wanless, 2007; Orgeret, Weimerskirch, & Bost, 2016). In many species, these need to develop rapidly, as individuals quickly transition from full parental care and provisioning to complete independence (Breed, Bowen, & Leonard, 2013; Costa, 1991; Reiter, Stinson, & Boeuf, 1978). The first trip made at sea alone may thus prove a critical time for survival, as individuals must either learn, learned, or have inher-ited advanced dive and forage abilities so as to be able to exploit the large heterogeneous environments typically inhabited (Carter et al., 2017; de Grissac, Bartumeus, Cox, & Weimerskirch, 2017; Orgeret et al., 2016; Riotte-Lambert & Weimerskirch, 2013). This may in-clude physiological capability and foraging efficiency, knowledge of habitats and prey distribution, alongside predator avoidance strat-egies. Moreover, during this time, perturbations in environmental conditions can have disproportionate impacts on fitness, as indi-viduals are already pushing their capabilities as far as they will go, leaving little room to adapt (Burns, 1999; Lea et al., 2009). Indeed, in the early years of life following transition to independence, survival rates often increase with age as dive and forage abilities advance (McMahon, New, Fairley, Hindell, & Burton, 2015; Oro, Torres, Rodriguez, & Drummond, 2010; Pistorius & Bester, 2002).
Much of what is known about the factors impacting first-year survival stems from studies linking resightings data to an individu-al's condition at departure from its natal site. For example, in pinni-peds, increased girth, length, weight, and level/quality of parental provision are known to impact first-year survival (Baker, 2008; Hall, McConnell, & Barker, 2001; McMahon et al., 2015), which likely lates to initial dive capabilities, development, and subsequent re-strictions on foraging ability (Hindell et al., 1999; Irvine, Hindell, Hoff, & Burton, 2000). Juvenile survival rates have also been linked to climatic indices (e.g., El Nino Southern Oscillation), possibly due to changes in the abundance and distribution of resources, which can impact parental provisioning during lactation (and thus initial condition), alongside prey availability post-weaning (Beauplet, Barbraud, Chambellant, & Guinet, 2005; McMahon & Burton, 2005). However, beyond such broadscale correlations there is a sparsity of studies describing and quantifying the fine-scale dive and forage capabilities of juvenile marine predators in relation to survival (Hazen et al., 2012). This reflects difficulties in obtaining detailed behavioral measurements of far-ranging individuals that may not return to land.
Recent advances in bio-logging technologies have substan-tially increased our ability to observe the fine-scale behaviors,
movements, and physiology of marine species (Hart & Hyrenbach, 2009; Hazen et al., 2012; Volpov et al., 2015). Moreover, new meth-ods in data abstraction and transmission mean device retrieval is no longer obligatory to obtain the information these instruments record (Cox et al., 2018). For pinniped species, it is now possible to remotely track a suite of dive and foraging metrics such as prey catch attempts (PrCA), swimming effort, dive shape, and surface interval (Cox et al., 2018; Heerah, Cox, Blevin, Guinet, & Charrassin, 2019; Photopoulou, Lovell, Fedak, Thomas, & Matthiopoulos, 2015). As such, the early foraging strategies of free-ranging juve-niles that may not return to land can now be observed and, when coupled with double tagging techniques (Drymon & Wells, 2017; Hays, Bradshaw, James, Lovell, & Sims, 2007), examined in relation to survival outcome to gain a more mechanistic understanding of how the two may be related.
Here, we present results from a unique dataset obtained via a new generation of satellite relay data tags, capable of recording and remotely transmitting fine-scale behavioral movements of 20 juve-nile southern elephant seals Mirounga leonina during their first trip at sea following weaning. We use these data to conduct exploratory investigations of the potential factors influencing early mortality events. Specifically, we (a) individually compare time-series data of behavioral movements and encountered environmental conditions of non-surviving individuals to those of grouped survivors (which successfully completed their first trip at sea following weaning) and (b) statistically assess potential common causes of mortality across the sample population.
Southern elephant seals are wide-ranging (circumpolar Southern Ocean distribution) meso-predators that exploit vast heterogeneous environments subject to climatic variation (Hindell et al., 2016). Females give birth to a single pup at the beginning of the austral summer (September–November) which, following a short period (~22 days) of full maternal provisioning (lactation and suckling), is weaned and abandoned at the natal colony (Guinet, Jouventin, & Weimerskirch, 1992). Pups then undergo a period of fasting (~3–9 weeks; Arnbom, Fedak, Boyd, & McConnell, 1993; Guinet et al., 1992), after which they depart for their first trip at sea (duration ~6 months) and learn to forage independently without external input. First-year survival rates are low (~40%–60%, some-times below 30%; McMahon, Burton, & Bester, 1999; McMahon et al., 2015; Pistorius & Bester, 2002) and considered a strong deter-minant of overall population fitness (McMahon, Hindell, Burton, & Bester, 2005). At the time of departure for their first trip at sea, weaned pups are sufficiently large (~140 cm and ~80–100 kg; Arnbom et al., 1993; Guinet, 1994) to be safely equipped with bi-ologging devices for several months (McMahon, Field, Bradshaw, White, & Hindell, 2008).
K E Y W O R D S
bio-logging, early life, foraging ecology, juvenile mortality, Mirounga leonina, southern elephant seal, survival analyses
2 | METHODS
2.1 | Tag deployment
Fieldwork was conducted at the Kerguelen Islands, sub-Antarc-tic (49°20′S, 70°20′E), during November/December 2014. A total of 20 (10 female and 10 male) weaned (<3 months old) ju-venile southern elephant seals (mean mass = 79.9 ± 17.7 kg, length = 139.1 ± 10.6 cm; ±standard deviation; Supporting Information S.1, Table S1) were equipped with (a) a custom-de-signed Argos relay satellite tag (SPLASH10-F-2961-DSA tag, Wildlife Computers, hereafter “DSA” tag) and (b) a smart posi-tion transmitting tag (SPOT 293A, Wildlife Computers, hereaf-ter “SPOT” tag). Animals were captured and anesthetized (80% of tagged individuals) using a 1:1 combination of tiletamine and zolazepam (Zoletil 100), injected intravenously. Using quick-set-ting epoxy (Araldite AW 2101; Ciba), the DSA tag was attached to the fur of the top of the head of a pup and the SPOT tag to its center back. All fieldwork activities were approved by the Comité Environnement et le Préfet des Terre Australes et Antarctiques Françaises.
2.2 | Tag specifications
The DSA tag measured 86 × 85 × 29 mm and weighed 192 g, which is <1% of the mean mass of the juvenile southern elephant seals in our study. The design of the device was similar to that from in-vestigative studies demonstrating that these tags do not adversely impact mass gain or survival of equipped individuals (McMahon et al., 2008). It comprised an Argos transmitter, pressure sensor (1 Hz sampling rate, resolution 0.5 m ± 1 m +1% of a reading), tri-axial ac-celerometer (16 Hz sampling rate), thermistor (1 Hz sampling rate, resolution 0.1°C ± 0.1°C), and wet–dry sensor. These functioned intermittently such that one complete dive (max depth >15 m and duration >60 s) was sampled every ~2.25 hr. Measurements were processed onboard the tag to provide a “per-dive” summary, which was later transmitted (alongside an Argos-derived loca-tion) via the Argos satellite system. This included the depths and durations of five broken-stick segments of a dive, alongside the total swimming effort (summed filtered accelerations associated with flipper movements across the lateral axis of the accelerom-eter; Richard et al., 2014) and time spent in PrCA behaviors (total time during which accelerations reflected “jerk”-like movements; Viviant, Trites, Rosen, Monestiez, & Guinet, 2010) across each seg-ment. Surface intervals between each sampled dive and the next were also transmitted, alongside sea surface temperature (SST; at ~2-3 m). An in-depth description of onboard processing algorithms and DSA tag functionality can be found in Cox et al. (2018). The Argos only transmitting SPOT tag measured 72 × 54 × 24 mm and weighed 119 g. From this, an Argos-derived location was obtained several times per day, such that at least one location was obtained each day.
2.3 | Survival estimates
The survival outcome of each individual was estimated using the absolute difference in time between the dates of the last transmis-sions of the DSA and SPOT tags. Two discrete groups were identi-fied. The first represents individuals whose tags ceased to transmit within a short time of one another (<30 hr), likely reflecting a mor-tality event. The second represents individuals with a large gap between the times of last tag transmissions (>528 hr/22 days; see Table S1 in Supporting Information S.1), reflecting either retrieval of the DSA tag on return to Kerguelen Islands or its possible failure (SPOT tags always out-transmitted DSA tags, and were left attached to animals after return to Kerguelen Islands). While it is noted that there is a small chance both tags could have failed simultaneously (thus presenting a false mortality event), we consider the likelihood of this negligible, since within the surviving group, for all but one in-dividual, tags continued to function until return to Kerguelen Islands (reflecting the completion of the first trip at sea following weaning and a successful survival outcome). For the surviving individual that did not return to Kerguelen (ID 140066; see Table S1 in Supporting Information S.1), the first of the two tags failed after 176 days at sea and the second 22 days later after a total of 198 days at sea.
2.4 | Pre-analytical data preparation
To investigate causes of mortality, for all individuals, we generated in-dices representative of (a) an individual's morphology and departure information, (b) horizontal movements, (c) fine-scale acceleration- and dive-based foraging behaviors, (d) changes in drift rate/body condition, and (e) encountered environmental conditions (Table 1).
2.4.1 | Morphology and departure information
Differences in survival rates between females and males were in-vestigated alongside the influence of departure date, weight, and condition. Departure dates were the day an individual commenced a continual trajectory away from Kerguelen Islands (~0–25 days after tag deployment; Supporting Information S.1). Departure weights were estimated from an individual's weight at tag deployment, fol-lowing Guinet (1994) as weight(t) = weight(t−1) − (0.0048(weight(t−1)) + 0.3031), where t is time in days from tag deployment to pup depar-ture. Individuals that left Kerguelen on the same day as tag deploy-ment had the same deploydeploy-ment and departure weights. Departure conditions were taken as extrapolated drift rates (departure drift rate; see details below under “Drift rates/body condition”).
2.4.2 | Horizontal movement metrics
Argos location data were not equally positioned in time and var-ied in quality (specifvar-ied location class errors; www.argos -system.
com). To obtain filtered location estimates at a temporal resolu-tion of 1 hr, all data were processed using a hierarchical first dif-ference correlated random walk state-space model (SSM; Jonsen, Flemming, & Myers, 2005; Supporting Information S.2). At-sea horizontal swimming behaviors were then corrected to remove trajectory distortion caused by ocean currents (Gaspar et al., 2006; Supporting Information S.2). Following this, for each indi-vidual, the daily maximum corrected speeds observed across a single hourly period were extracted alongside the total corrected
distances traveled in a day. The first and last days of each track were excluded to ensure all days encompassed a full 24 hr of track-ing data and were thus comparable. To assess differences between how individuals orientate themselves to ocean currents (i.e., with or against), the daily circular mean deviation of a pup's real head-ing from the concurrent ocean current direction was calculated. These values were rescaled so as bearings 180–360 ran from 180 (against ocean currents) to 0 (with ocean currents), which is con-sistent with those of original bearing 0–180.
TA B L E 1 Indices used in analytical investigations of survival rates
Variable name Description
(a) Morphology and departure information (one value per individual)
Sex Sex of individual (male/female)
Departure date
Date each individual commenced the outward phase of first trip at sea following weaning Departure
weight Departure weight (kg) estimated following Guinet (1994) as weighttime in days from tag deployment to pup departure (t) = weight(t−1) − (0.0048(weight(t−1)) + 0.3031), where t is
Departure drift rate
Departure drift rate (m/s) taken as an indicator of departure condition (b) Horizontal movement metrics (time series at day scale)
Max speed The daily maximum current corrected speed (m/s) between two hourly filtered locations
Distance swam
The total current corrected distance swam (km) across a 24-hr period Current
deviation
The daily mean difference between corrected swimming direction and the direction of ocean currents (o). Current deviations
were rescaled so as bearings 180–360 ran from 180 (against ocean currents) to 0 (with ocean currents), which is consistent with those of original bearing 0–180
(c) Acceleration and dive summaries (time series at dive scale)
Dive depth The maximum depth attained during a dive (m)
Dive duration The total duration of a dive (s)
Scaled surface interval
The surface interval divided by the total duration of a dive (s)
PrCA rate Total time spent in prey catch attempt (PrCA) behaviors (total time during which accelerations reflected “jerk”-like
move-ments) divided by total duration of a dive (s) Scaled bottom
duration The total bottom duration divided by the total duration of a dive (s)
Swim effort The total swimming effort (summed filtered accelerations associated with flipper movements across the lateral axis of the
accelerometer) of the descent and ascent phases of a dive divided by the total corresponding durations of these phases (m/
s3)
(d) Change in drift rate/body condition (time series at day scale) Drift rate
change
Daily change in drift rate (m/s), between adjacent days. Positive values suggest an increase in seal buoyancy between days (likely through the acquisition of fat reserves) and negative values a decrease (either due to muscle development and/or loss of fat reserves)
(e) Environmental conditions (times series at day scale)
Max wind Daily maximum wind speed (m/s) encountered by an individual
Max wave
height Daily maximum wave height (m) encountered by an individual
Sea surface temperature
Daily mean surface temperature (°C) recorded by each individual's tag (at ~ 2-3 m)
Max EKE Daily maximum encountered eddy kinetic energy (EKE) taken as 0.5 (u2
current+ v 2 current)
For each individual, these are representative of (a) morphology and departure information (one value), (b) horizontal movements (estimated daily), (c) fine-scale acceleration- and dive-based foraging behaviors (estimated for each dive transmitted), (d) drift rates/body condition (estimated daily), and (e) encountered environmental conditions (estimated daily)
2.4.3 | Transmitted acceleration and dive summaries
For each dive performed by each individual, the maximum dive depth was taken alongside the total dive duration. Surface intervals were scaled by dive duration, as were times spent in PrCA behaviors. Descent, bottom, and ascent dive phases were identified following Cox et al. (2018). For each dive performed by each individual, the bottom duration scaled by the total dive duration was taken. In ad-dition, the average swimming effort required to transit to and from the bottom, hunting phase, of a dive was estimated as the sum of the swimming efforts of descent and ascent phases divided by the total duration of these phases.
2.4.4 | Drift rates/body condition
Southern elephant seals regularly perform resting dives, where indi-viduals cease active movement and “drift” in the water column (Biuw, McConnell, Bradshaw, & Fedak, 2003; Gordine, Fedak, & Boehme, 2015; Mitani et al., 2010). Vertical movement during these periods can be used to make inferences on an individual's buoyancy, and thus body composition and condition (i.e., ratio of high-density lean to low-density lipid tissue; Biuw et al., 2003). Animals that are posi-tively buoyant should be in “better” condition than those that are negatively buoyant (due to increased fat reserves). During their first trip at sea, juvenile southern elephant seals are still developing and growing, and as such, changes in buoyancy could also reflect the ac-quisition of lean muscle in addition to changes in fat reserves (Biuw et al., 2003; Orgeret, Cox, Weimerskirch, & Guinet, 2019). To identify drift dives, we used a modified stepwise filtering process similar to that described in Biuw et al., (2003) and Gordine et al., (2015), but that also took into account information from accelerometer transmis-sions (Supporting Information S.3). Vertical movement rates in each drift segment were then calculated. Following this, to obtain daily drift rate estimates (as drift dives are not always performed daily), we used functional data analysis (Yang, Zhu, Choi, & Cox, 2016; Supporting Information S.3). Daily changes in drift rate were then estimated.
2.4.5 | Environmental conditions
To investigate the impact of storms on juvenile survival, wind and wave data were extracted from the ERA-Interim global atmospheric reanalysis (Dee et al., 2011), via the European Centre for Medium-Range Weather Forecasting (ECMWF; www.ecmwf.int/datasets), at a spatiotemporal resolution of 0.75° and 3 hr. For each individual, the daily maximum of the closest spatio-temporally matched wind and wave conditions was extracted.
Information on fine-scale biophysical habitats encountered by each individual, which may impact prey availability/quality (Abrahms et al., 2018; Richard, Cox, Picard, Vacquie-Garcia, & Guinet, 2016), was also obtained. For each individual for each day, SST was taken from the DSA tag as the mean temperature of all measurements of
that day. Current data were taken from the delayed time all-sat-merged Global Ocean Gridded Absolute Geostrophic Velocities Anomalies L4 product of AVISO (www.aviso.altim etry.fr), on a daily basis at a spatial resolution of 0.25°. An index of total (eddy) kinetic energy (m2/s2; TKE) was then calculated as 0.5 (u2
current+ v 2
current). The maximum spatio-temporally matched values encountered by each individual per day were extracted.
2.5 | Data analyses
Due to a limited sample size and high level of noise/variability in the data (i.e., individuals may die for a range of reasons), investigations toward causes of early mortality were predominantly exploratory in nature. Prior to all analyses, we verified that sampling bias (i.e., variation in the number of dives transmitted by the DSA devices through time and between individuals) was not an issue (Supporting Information S.4). To ensure comparability, overlap in the broad-scale spatial distributions of surviving and non-surviving groups was also assessed using kernel density analysis and Bhattacharyya’s affin-ity (Fieberg and Kochanny 2005; Supporting Information S.5).
2.5.1 | Temporal patterns in survival
Kaplan–Meier survival functions were generated using the survival package in R (Therneau & Lumley, 2017), and used to assess the distribution and probability of mortality events with time since an individual left Kerguelen Islands. For non-survivors, the last date at which both tags were transmitting was used as the date of death. For surviving individuals, time-series data were right-censored to the date at which an individual returned to Kerguelen Islands. For one surviving individual that did not return to Kerguelen Islands and instead spent an extended time period within shelf waters around Heard Island, a censoring date corresponding to the average return date to Kerguelen Islands of the other survivors was used.
2.5.2 | Individual comparisons between
non-surviving pups and grouped survivors
For each day, for each predictor for which time-series data were available (Table 1), daily estimates for each non-surviving individual were plotted against the daily medians of the entire surviving group, alongside the 2.5%, 25%, 75%, and 97.5% quantiles. This allowed us to visually assess behavioral patterns and environmental conditions encountered in relation to time since departure (and ontogenetic processes), and the time of death (i.e., were behaviors consistently different between surviving and non-surviving individuals, or did a change occur in the days and/or weeks immediately prior to death). For predictors not already generated at a day scale (i.e., that were generated at the dive scale; Table 1), daily summaries were calcu-lated for use only in these visual assessments (i.e., maximum daily dive depth, maximum daily dive duration, daily mean scaled surface
interval, daily mean PrCA rate, daily mean scaled bottom duration, and daily mean swim effort).
2.5.3 | Statistical assessment of potential common
causes of mortality across the sampled population
To assess common causes of mortality across the entire sampled population, a two-step modeling approach was applied, similar to that of joint distribution modeling frameworks (e.g., Henderson, Diggle, & Dobson, 2000), albeit modified so a range of parameter estimation techniques could be applied. First, for each potential pre-dictor for which time-series data were available (at either a daily or dive scale; Table 1), univariate linear mixed-effects models (LMMs) were used to extract the intercept and slope of each predictor mod-eled against time since departure from Kerguelen Islands for each individual. These were fitted as random intercept–slope models via the nlme package in R (Pinheiro & Bates, 2014). The time variable (days since departure) was standardized such that the intercept would represent the average of a potential predictor across the se-ries, and the slope, its change through time. Parameter estimates for each individual were then extracted as the corresponding in-tercept and slope from the random component of the model with the population-level coefficient (intercept or slope) subtracted (to standardize the data). Because all individuals that died did so either during their outward trip phase or very soon after, to ensure tempo-ral comparability, all data from surviving individuals were filtered so that only samples taken during outward trip phases (i.e., until a trip's distal point) were included in analyses.
Due to the noisy and high-dimensional nature of our study (i.e., small sample size and large number of potential predictors), a conser-vative approach using three different methods was used to assess how each of the summarized time series influenced survival (alongside sex and departure date, weight, and drift rate; Table 1). Predictors were selected when at least two methods agreed on importance. First, Cox proportional hazards (ph) regression models (Cox, 1972) were fitted via the survival package in R (Therneau & Lumley, 2017). Cox ph models are non-parametric and assess how candidate predictors influence the hazard rate of a particular event happening (here death). A positive esti-mate for a predictor reflects an increased hazard rate, and thus negative influence on survival. Models were fitted for each candidate predictor one at a time (Table 1). The response variable (survival) was specified as described in the generation of Kaplan–Meier survival functions above. Significance against a null model was tested for using one-way analy-sis of variance at p < .05. The proportionality assumption was checked using the Schoenfeld residuals test (Grambsch & Therneau, 1994).
The second and third methods considered all candidate variables in tandem and selected key predictors using “shrinkage” techniques, which are both well suited to high-dimensional studies and can be tuned to deal with collinearity (Pavlou, Ambler, Seaman, Iorio, & Omar, 2016; Tibshirani, 1997; Zou & Hastie, 2005). Such methods work by shrinking all coefficients toward zero and adding a penalty on their size, such that only the stronger signals retain non-zero coefficients. The first of these was implemented using the glmnet
package in R (Friedman, Hastie, Simon, Qian, & Tibshirani, 2017), which fits a Cox ph model regularized by an elastic net penalty (Friedman, Hastie, & Tibshirani, 2010; Simon, Friedman, Hastie, & Tibshirani, 2011). An optimal shrinkage penalty of 0.317 was se-lected by eight-folds cross-validation (Simon et al., 2011).
The second shrinkage-based analysis (and third applied method) used a regularized horseshoe prior (Piironen & Vehtari, 2017) and was implemented in Stan (Carpenter et al., 2017; Supporting Information S.6). The advantage of the regularized horseshoe is to have explicit control on the prior for the number of non-null predictor variables, which was set to 10 (based on the outputs of the two previous in-vestigations). Survival time was modeled as a normal distribution (on a log scale), which corresponds to a non-monotonic hazard. Such a structure is appropriate since after leaving Kerguelen Islands, mortal-ity hazard can be expected to increase after weaning (as energy cap-ital from maternal provisioning depletes), and then decrease as pups learn to forage (Orgeret et al., 2019). To assess true and false predictor detection rates of the model of this third method (and determine its suitability to our dataset), a retrospective power analysis was also per-formed (Supporting Information S.7).
3 | RESULTS
Of the 20 tracked pups, nine died (two females and seven males) and 11 survived (eight females and three males) until at least the end of their first trip at sea following weaning (Figure 1, Supporting Information S.1, Table S1). All individuals bar two (one survivor and one non-survivor) headed in a southeastward direction upon depart-ing Kerguelen Islands (Figure 2). No broad-scale spatial segregation was apparent between surviving and non-surviving pups (Figure 2 and Supporting Information S.5).
3.1 | Temporal patterns in survival
All mortality events occurred between 8.6 and 112 days after de-parture from Kerguelen Islands (mean = 54 ± 33.5 days, ±standard deviation), at a straight-line distance of between 521 and 2,468 km from Kerguelen Islands (mean = 1,534.3 ± 604.4 km; Figures 1 and 3). For all but two individuals, this happened before (i.e., at) the distal point of a trip (Figures 1 and 2). For the two individuals that com-menced return trip phases, death occurred 0.2 (1.7 km) and 49 days (1,084.4 km) after reaching their recorded distal points (which, for the first of these two individuals, may not represent the true dis-tal location of the trip had it continued). Of the surviving individu-als, return arrival at Kerguelen Islands occurred between 138.2 and 202.2 days after departure (mean = 169.5 ± 20.14 days), between April and July (Figure 1). The distal points of these trips occurred between 44 and 105 days after departure (mean = 81.2 ± 24.4 days) at straight-line distances of between 1,131.0 and 2,771.6 km from Kerguelen Islands (mean = 2,036.9 ± 534.4 km). Overall, weanling survival rates during their first trip at sea were 55% (males 30% and females 70%).
3.2 | Individual comparisons between non-surviving
pups and grouped survivors
Visual comparisons of behaviors and encountered environmental con-ditions of non-surviving pups to those of grouped survivors suggested both marked differences (at times) and high heterogeneity (Table 2; see Supporting Information S.8 for all plots used in these assessments).
For four non-survivors (IDs: 140061, 140074, 140076, and 140078), periods of decreased dive and forage ability were noted. This was particularly prominent for the lightest individual at depar-ture (pup 140074; Table 2). Specifically, maximum daily dive depths and durations alongside mean bottom times and PrCA rates were low (Figure 4). This was accompanied by increased daily mean surface in-tervals and swimming efforts, alongside total daily distances traveled and maximum swim speeds (Figure 4). For pups 140061, 140076, and 140078, while behavioral indices indicative of dive and forage ability were generally consistent with those of the surviving group, prolonged periods with decreased PrCA rates were observed (Table 2, Figures 5 and 6). For individual 140076, this was most prominent in the weeks immediately prior to death and was accompanied by an increase in daily travel distances, maximum swim speeds, and daily mean swim-ming efforts (Figure 5). For individual 140078, maximum daily dive durations were in the lower range of that observed in surviving pups (Figure 6). Moreover, in the weeks immediately prior to death, there was a decrease in bottom duration alongside a slight increase in daily maximum dive depths. In addition, surface intervals were sometimes increased as were daily mean swimming efforts (Figure 6).
For individual 140071, while persistent differences in dive and forage ability to the surviving group were not present, the days im-mediately prior to death saw a distinct behavioral change (Table 2, Figure 7). This included a sharp peak in maximum daily dive depths and durations, which were substantially increased compared to those both performed previously and of the surviving group at comparative times in development. These were accompanied by extreme surface
intervals followed by a distinct drop-off in daily mean PrCA rates and swimming efforts (Figure 7).
While distinct differences in drift rates were not evident (sug-gesting no mean difference in body condition between survivors and non-survivors), all individuals bar two (IDs: 140070 and 140071) died when negatively buoyant (indicative of decreased body condi-tion; Figure 8). For pup 140070 (positively buoyant at death), mor-tality occurred within the first 2 weeks at sea, when the majority of individuals were positively buoyant following weaning.
Finally, six of the nine pups that died foraged predominantly in waters cooler than those generally visited by surviving individuals (Table 2, Figure 9). For three of these individuals (and an additional one that remained in waters of SSTs similar to those visited by survivors), maximum TKE values were also reduced (Supporting Information S.9).
3.3 | Statistical analyses of common causes of
mortality across the sampled population
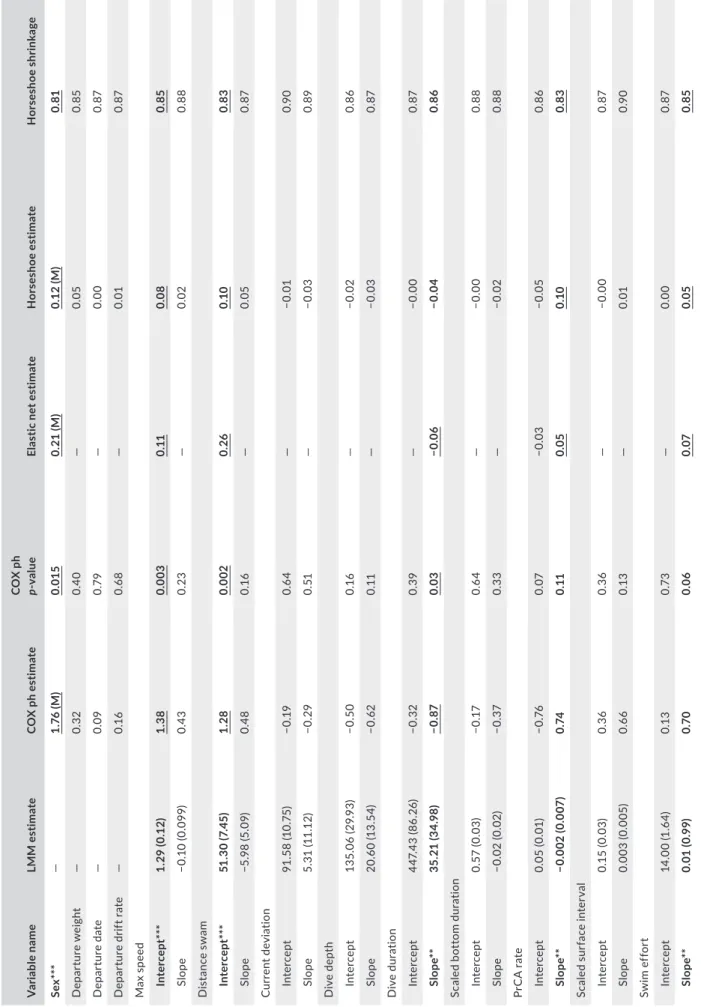
Eight predictors of survival outcome were selected by at least two of the three implemented methods (Table 3). In all instances, magni-tude and sign agreement was good. Variable selection cutoffs for the horseshoe analysis were a parameter estimate of at least 0.05 and a shrinkage less than 0.855 (further details in Supporting Information S.10). Results from the retrospective power analysis performed on this method suggest the likelihood of a selected predictor reflecting a true signal to be 50% (Supporting Information S.7).
Male survival was lower than female survival. Survival decreased with increased daily maximum speeds and distances traveled. These results were consistent across all three methods (Table 3). A positive influence of an increase in dive duration through time on survival was identified by the Cox ph and elastic net analyses, but was one of the weaker predictors from the horseshoe analysis (relatively small param-eter estimate and high shrinkage; Table 3). The four other predictors deemed to impact survival were identified by both the elastic net and horseshoe analyses, but yielded p-values from the Cox ph analysis that were above the .05 cutoff (but note that these were all between .06 and .15). There was an influence of a decrease through time in PrCA rates, such that a greater decrease increased survival probabil-ity. Individuals with swim efforts that increased through time were more likely to die than those whose swim efforts did not (or did so less). Finally, individuals that typically visited waters characterized by increased SSTs and TKE estimates were more likely to survive than those visiting waters with decreased estimates.
4 | DISCUSSION
In this study, we capitalized on new techniques in the abstraction and transmission of accelerometer and dive data, and coupled these to dou-ble tagging methods to investigate and gain a more mechanistic under-standing of how the fine-scale behaviors of juvenile southern elephant seals impact survival outcome during their first trip at sea following
F I G U R E 1 Individual tracking ranges from departure from
Kerguelen Islands to either time of mortality or return to Kerguelen Islands (gray bar components are outward trip phases and black return). Note only one non-survivor commenced a distinct return trip phase, which lasted 49 days (1,084.4 km) before the individual died
weaning. Using a cutting-edge yet conservative analytical approach, we provide novel insight toward the causes of early mortality in this far-ranging marine predator, which we suggest results from a mix of reduced dive and forage ability alongside habitat quality and possible predation. This is one of few studies to use bio-logging technologies (and particu-larly accelerometers) to assess the factors impacting survival in a long-lived marine vertebrate predator, and the methods we employ have the potential to be applied across a number of other taxa to gain novel in-sight of the drivers of individual mortality and population dynamics.
4.1 | Overall survival rates and sex dependency
Despite our small sample size, survival rates were similar to published estimates for 0- to 1st-year southern elephant seals (McMahon et al., 1999, 2015; Pistorius & Bester, 2002). In addition, males were twice as likely to die as females, which is congruent with previous studies on southern elephant seals (McMahon, Burton, & Bester, 2003) alongside other pinnipeds (e.g., gray seals; Hall et al., 2001). This sex difference
F I G U R E 2 Spatial distributions of (a)
non-survivors and (b) survivors. Lighter red track portions represent outward trip phases (until death or distal location) and dark red return phases. Graduated gray polygons show kernel densities at the 25%, 50%, 75%, and 95% levels, using, for non-survivors (a), all filtered state-space model (SSM) locations and, for survivors (b), filtered SSM locations from outward trip phases only (Supporting Information S.5). In plot (a), black markers indicate mortality events
F I G U R E 3 Kaplan–Meier survival
functions. Red markers indicate mortality events (deaths) and blue markers
censoring (i.e., return to Kerguelen Islands; ♂ = males and ♀ = females)
may stem from early-year developmental disparities in dive and forage ability (Carter et al., 2017).
4.2 | Initial condition at departure
In contrast to previous findings (e.g., Baker, 2008; Hall et al., 2001; McMahon et al., 2003; McMahon et al., 2015), we did not find de-parture condition (i.e., drift rate, weight, or date (better condition in-dividuals may leave later); Arnbom et al., 1993, Hindell et al., 1999)
to be indicative of survival outcome. This may be reflective of our small sample size and/or range of weights/initial departure conditions (Table 2 and Supporting Information S.11). For example, the maximum estimated departure weight in our sample was 96.1 kg, but studies elsewhere on juvenile elephant seals often include individuals exceed-ing 135 kg (McMahon, Burton, & Bester, 2000; McMahon et al., 2003). Nonetheless, of all non-surviving individuals, the pup that exhibited the most prominent difference in dive and forage ability to that of the surviving group was also the lightest (individual 140074; Figure 4; weight at departure ~44.6 kg vs. mean of all pups ~79.9 ± 17.7 kg).
TA B L E 2 Individual by individual visual comparisons for each non-survivor against grouped survivors (see plots in Supporting Information
S.8), alongside life span length and departure weights and drift rates
140061 140064 140065 140067 140070 140071 140074 140076 140078
Days since depar-ture at death 64 40 18 86 9 112 29 62 69 Sex M M M F M M M M F Departure weight (kg) 83.7 73.4 82.0 59.4 89.3 83.0 44.6 96.1 67.5 Departure drift rate (m/s) 0.17 −0.19 0.18 0.18 0.17 0.12 0.14 0.10 0.19
Max speed — — — — — — Upper range Rise at end —
Distance swam — — Upper range
— — Peak and drop at end
Upper range Rise at end —
Current deviation — — — — — — — — —
Dive depth — — — — Upper
range
Distinct peak at end with severe drop-off Distinctly lower Increased at beginning Increased at end
Dive duration — — Upper range
— Upper
range
Distinct peak at end with severe drop-off Distinctly lower Increased at beginning Lower range except during one day a few days prior to death Scaled surface interval — Slightly higher at end — — — Extreme positive value prior to death Distinctly higher — Several in-creased periods PrCA rate Long
period in lower range
— — Upper
range
— Drop off on the last day Distinctly decreased Decreased at end Decreased at start Scaled bottom duration
— — — — — — Decreased — Slightly
de-creased at end Swim effort Lower
range Lower range Upper range Upper range -more so at end Lower range Upper range at start. Small peak and sharp drop off at end
Distinctly increased Slight increase at end Upper range Drift rate — — — — — — — — —
Drift rate change — — — — — — — — —
Max wind — — — — — — — — —
Max wave height — — — — — — — — —
Sea surface temperature Lower range Lower range at start Lower range Higher range
— — Lower range Lower range at end
Lower range
Max EKE Lower range at end — Lower range — — Lower range at end — Lower range at end —
F I G U R E 4 Time series behaviors for individual 140074. Daily values (red) for (a) maximum dive depths, (b) maximum dive durations,
(c) mean scaled bottom times, (d) mean prey catch attempt (PrCA) rates, (e) mean log-scaled surface intervals, (f) mean swim efforts, (g) maximum speeds, and (h) total distances swam. Large light gray bands represent concurrent 2.5%–97.5% quantiles of survival datasets, nested dark gray bands the 25%–75% quantiles, and dark gray lines the median
4.3 | Changes in condition at sea, temporal patterns
in mortality, and possible predation
Across most individuals (surviving and non-surviving), there was a marked and rapid decrease in drift rates following departure from Kerguelen Islands, which likely reflected the depletion of fat reserves obtained via maternal provisioning prior to weaning (Figure 8; Biuw et al., 2003; Orgeret et al., 2019) and was supportive of our choice of mor-tality hazard in the horseshoe analysis. Following this initial decrease, all pups experienced a prolonged period of negative buoyancy. While we did not detect direct links between drift rates (either initial or change through time) and survival outcome, all but two pups that died did so during this time. For the 11 that survived, all but three individuals re-turned to positive buoyancy before returning to Kerguelen Islands. As such, during early life, individuals appear more vulnerable to the adverse consequences of fatigue and starvation when negatively buoyant (and
likely of poor body condition). For southern elephant seals, during the initial, outward phase of the first trip at sea, the rapid development of dive and forage skills is thus crucial as fat reserves gained from ma-ternal provisioning diminish (McConnell, Fedak, Burton, Engelhard, & Reijnders, 2002), and a return to positive buoyancy following this ap-pears an important determinant in the decision to end the first trip at sea and return to land (Orgeret et al., 2019). This may also reflect the sufficient development of muscular lean tissue, after which excess en-ergy is stored as fat. The one pup (140071) that died while positively buoyant during return to Kerguelen Islands was performing well right up until the days immediately prior to death (Figures 7 and 8). Here, an abrupt behavioral change occurred, possibly supportive of a preda-tion event (which juvenile pinnipeds may be particularly vulnerable to; Horning & Mellish, 2012). A series of fast movements and extended dives, characteristic of escape-type behaviors and avoidance, were fol-lowed by very slow movements and a dramatic decrease in dive and forage ability, indicative of fatigue/injury. Potential predators of juvenile
F I G U R E 5 Time series behaviors for individual 140076. Daily values (red) for (a) mean prey catch attempt (PrCA) rates, (b) mean swim
efforts, (c) maximum speeds, and (d) total distances swam. Large light gray bands represent concurrent 2.5%–97.5% quantiles of survival datasets, nested dark gray bands the 25%–75% quantiles, and dark gray lines the median
F I G U R E 6 Time series behaviors for individual 140078. Daily values (red) for (a) mean prey catch attempt (PrCA) rates, (b) maximum dive
durations, (c) mean scaled bottom times, (d) maximum dive depths, (e) mean log-scaled surface intervals, and (f) mean swim efforts. Large light gray bands represent concurrent 2.5%–97.5% quantiles of survival datasets, nested dark gray bands the 25%–75% quantiles, and dark gray lines the median
F I G U R E 7 Time series behaviors for individual 140071. Daily values (red) for (a) maximum dive depths, (b) maximum dive durations, (c)
mean prey catch attempt (PrCA) rates, (d) total distances swam, (e) mean log-scaled surface intervals, and (f) mean swim efforts. Large light gray bands represent concurrent 2.5%–97.5% quantiles of survival datasets, nested dark gray bands the 25%–75% quantiles, and dark gray lines the median
southern elephant seals in the region include killer whales Orcinus orca and sleeper sharks Somniosus antarcticus (Van den Pistorius, Meyer, Reisinger, & Kirkman, 2012; Hoff & Morrice, 2007).
4.4 | Dive and forage ability
Individuals that experienced early mortality appeared to exhibit slower development in dive capability compared to surviving pups.
A slowing in the rate at which dive durations increased through time was linked to reduced survival, as was an increase in swim-ming effort through time (i.e., individuals are using more energy to do less). This pattern appeared most prominent for pups 140067, 140074, 140076, and 140078. Temporal improvements in dive capability (e.g., duration) are a key component of diving marine predator ontogeny, as juveniles begin life with abilities that are sig-nificantly reduced compared to adults (Burns, 1999; Carter et al., 2017; Orgeret et al., 2019, 2016). Our observations support this
F I G U R E 8 Drift rates of non-survivors
(colors correspond to individuals), with times of death (and corresponding drift rates) indicated by black stars. The large light gray band represents the 2.5%– 97.5% quantiles of the survival dataset, the nested dark gray band the 25%–75% quantiles, and the dark gray line the daily median
F I G U R E 9 Sea surface temperatures (SSTs) of survivors and non-survivors. Plot (a), time series for six individuals (140061, 140064,
140065, 140074, 140076, and 140078) that appear to visit waters of reduced SSTs. Here, the large light gray band represents the 2.5%– 97.5% quantiles of the survival dataset, the nested dark gray band the 25%–75% quantiles, and the dark gray line the daily median. Individual plots for each pup are in Supporting Information S.8. Plot (b), histogram of SSTs of non-survivors (red) and survivors (blue; outward trip phase only)
T A B LE 3 C om m on c au se s o f m or ta lit y a s i de nt ifi ed v ia t he t hr ee m od el in g f ra m ew or ks V ar ia ble na m e LM M e st im ate CO X p h e st im at e CO X p h p-value El as tic n et e sti m at e H or se sh oe e st ima te H or se sh oe s hr inka ge Se x*** — 1. 76 ( M ) 0. 01 5 0. 21 ( M ) 0. 12 ( M ) 0. 81 D epa rt ur e w ei gh t — 0. 32 0.4 0 — 0.0 5 0. 85 D epa rt ur e da te — 0.0 9 0.7 9 — 0.0 0 0. 87 D ep ar tu re d rif t r at e — 0.1 6 0. 68 — 0.0 1 0. 87 M ax s pe ed In te rc ep t*** 1. 29 ( 0. 12 ) 1.38 0. 00 3 0. 11 0. 08 0. 85 Slo pe −0. 10 (0.0 99 ) 0.4 3 0. 23 — 0.0 2 0. 88 D is ta nc e sw am In te rc ep t*** 51 .3 0 ( 7. 45 ) 1. 28 0. 00 2 0. 26 0. 10 0. 83 Slo pe −5 .9 8 (5 .0 9) 0.4 8 0.1 6 — 0.0 5 0. 87 C ur ren t de vi at io n Inte rc ep t 91 .5 8 (10 .75 ) −0 .1 9 0. 64 — −0.0 1 0. 90 Slo pe 5. 31 ( 11 .1 2) −0 .29 0. 51 — −0.0 3 0. 89 Di ve dep th Inte rc ep t 13 5. 06 ( 29 .9 3) −0 .50 0.1 6 — −0.0 2 0. 86 Slo pe 20 .6 0 ( 13 .5 4) −0 .62 0. 11 — −0.0 3 0. 87 D iv e d ur at io n Inte rc ep t 44 7. 43 ( 86 .2 6) −0 .32 0. 39 — −0.0 0 0. 87 Sl op e* * 35 .2 1 ( 34 .9 8) −0 .87 0. 03 −0. 06 −0. 04 0. 86 Sc al ed b ot to m d ur at io n Inte rc ep t 0. 57 (0.0 3) −0 .17 0. 64 — −0.0 0 0. 88 Slo pe −0.0 2 (0.0 2) −0 .3 7 0. 33 — −0.0 2 0. 88 Pr C A r at e Inte rc ep t 0.0 5 (0.0 1) −0 .76 0.0 7 −0.0 3 −0.0 5 0. 86 Sl op e* * −0. 00 2 (0. 00 7) 0. 74 0. 11 0. 05 0. 10 0. 83 Sc al ed s ur fa ce i nt er va l Inte rc ep t 0. 15 (0.0 3) 0. 36 0. 36 — −0.0 0 0. 87 Slo pe 0.0 03 (0.0 05 ) 0. 66 0.1 3 — 0.0 1 0. 90 Sw im e ff or t Inte rc ep t 14 .0 0 ( 1. 64 ) 0.1 3 0.7 3 — 0.0 0 0. 87 Sl op e* * 0. 01 (0. 99 ) 0. 70 0. 06 0. 07 0. 05 0. 85 (Co nti nue s)
V ar ia ble na m e LM M e st im ate CO X p h e st im at e CO X p h p-value El as tic n et e sti m at e H or se sh oe e st ima te H or se sh oe s hr inka ge D rif t r at e c ha ng e Inte rc ep t −0.0 05 (0.0 06 ) −0 .85 0.0 3 — −0.0 2 0. 87 Slo pe 0.0 06 (0.0 05 ) −0 .55 0.1 8 — −0.0 5 0. 86 M ax w in d Inte rc ep t 14 .5 1 ( 0. 50 ) −0 .1 3 0.7 3 — 0.0 1 0. 89 Slo pe −0.0 9 (0. 35 ) −0 .3 9 0. 33 — −0.0 1 0. 90 M ax w av e h ei gh t Inte rc ep t 4. 63 ( 0. 19 ) −0 .1 2 0. 80 — −0.0 0 0.9 1 Slo pe NA NA NA NA NA N A Se a s ur fa ce t em pe ra tu re In ter cep t* * 2. 99 ( 0. 71 ) −0 .57 0. 07 −0 .10 −0. 06 0. 85 Slo pe −0 .2 9 ( 0. 47 ) 0. 36 0. 35 — 0.0 5 0. 86 M ax E K E In ter cep t* * 0. 05 (0. 02 ) −0 .4 8 0. 15 −0. 08 −0. 08 0. 85 Slo pe −0.0 03 (0.0 2) 0. 11 0. 75 — 0.0 2 0. 88 Fo r e ac h p ot en tia l p re di ct or o f s ur vi va l: ( a) c oe ff ic ie nt e st im at es f ro m l in ea r m ix ed -e ff ec ts m od el s ( LM M s; s ta nd ar d d ev ia tio n a ro un d r an do m e ff ec ts i n b ra ck et s) , ( b) C ox p h e st im at es , ( c) p -v al ue s f ro m an al ys is o f v ar ia nc e o n C ox p h t es ts , ( d) e la st ic n et p ar am et er e st im at es , ( e) p ar am et er e st im at es f ro m h or se sh oe a na ly se s, a nd ( f) p ro po rt io n o f s hr in ka ge a pp lie d t o e ac h h or se sh oe p ar am et er e st im at e. N ot e t ha t f or C ox p h, e la st ic n et a nd h or se sh oe e st im at es , a p os iti ve v al ue m ea ns a d ec re as e i n s ur vi va l w ith i nc re as in g L M M c oe ff ic ie nt . V ar ia bl es s el ec te d b y t w o ( ** ) o r t he e ( ** *) m ul tip le m et ho ds a re hi gh lig ht ed i n b ol d w ith s el ec te d v al ue s u nd er lin ed . T A B LE 3 (Co nti nue d)
and suggest that failure to develop in a timely manner increases mortality risk.
In addition, non-surviving individuals moved faster (horizon-tally) than survivors, which may betray reduced foraging ability. Upon location of profitable foraging grounds, animals tend to reduce travel speeds and increase turning angles, so as to focus efforts in areas where prey are more likely to be encountered
(Fauchald & Tveraa, 2003). PrCA rates increased when distances traveled decreased (Figure 10), and so increased mortality with increased travel could relate to failure to locate and/or exploit sufficient resources. For four non-survivors, PrCA rates were re-duced either continually, periodically, at the beginning of a trip, or just prior to death. This was particularly pronounced when plotted cumulatively (i.e., taking the additive mean PrCA rate per
F I G U R E 10 From top to bottom:
(a) daily mean PrCA rates against total distances swam, (b) cumulative daily mean prey catch attempts (PrCA), and (c) daily mean PrCA rates against daily mean sea surface temperatures. In subplots (a) and (c), non-survivors are red and survivors blue. The line of best fit from linear mixed-effects models (with random intercept of individual ID; nlme package in R—Pinheiro & Bates, 2014) is in black, and dashed lines are 95% confidence intervals. In subplot (b), colored lines are pups 140076 (yellow), 140061 (red), 140078 (blue), and 140074 (green). The large light gray band represents the 2.5%–97.5% quantiles of the survival dataset, the nested dark gray band the 25%–75% quantiles, and the dark gray line the daily median
individual per day; Figure 10), which suggests that even if an indi-vidual manages to increase its PrCA rate after a period when it is low, it cannot “catch up.” We also found individuals that reduced their average PrCA rates through time had a better survival out-come than those that did not, or did so to a lesser extent. This was not generally accompanied by further decreases in buoyancy/ drift rate, and in some cases coincided with a positive change in buoyancy/drift rate (Figure 8—from ~day 50 onward). Such a trend supports a change in diet composition and/or improvement of for-age ability. For example, in contrast to older individuals that feed predominantly on fish and squid (Slip, 1995), juvenile southern el-ephant seals have a high proportion of crustaceans (e.g., krill) in their diet (Lubcker et al., 2017; Walters et al., 2014), while the size of other preys (e.g., squid) is generally smaller (Field, Bradshaw, Hoff, Burton, & Hindell, 2007; Slip, 1995). As foraging skills im-prove, diet composition may change as individuals are able to ex-pand/select/switch to other, possibly more nutrient-rich prey sizes and/or types, thus requiring less prey items to be caught, resulting in a decrease in PrCA rate (Chaigne, Authier, Richard, Cherel, & Guinet, 2013; Field et al., 2007; Walters et al., 2014). Additionally/ alternatively, initial high PrCA rates may include a larger number of unsuccessful attempts, which would decrease in frequency as individuals hone their capture techniques.
4.5 | Encountered environmental conditions
Non-surviving juvenile southern elephant seals from Kerguelen Islands encountered waters of lower temperature and reduced TKE com-pared to the surviving group. Here, PrCA rates were typically reduced (Figure 10 and Supporting Information S.12). While confounding pro-cesses (e.g., temporal changes in foraging success and/or prey qual-ity) suggest increased PrCA rates are not necessarily directly linked to better foraging (Orgeret et al., 2019; Richard et al., 2016), combined with increased survival rates these patterns suggest foraging habitats associated with increased SSTs and TKE estimates are more suitable for southern elephant seals during this time in their development.
Across the spatial domain visited by our tracked south-ern elephant seal pups, areas of higher SST and increased TKE correspond roughly to the southern edge of the polar front, where dynamic habitats associated with frontal zones and eddy edges are more likely to be found (Bost et al., 2009; Supporting Information S.13). Both juvenile and adult southern elephant seals are known to forage within such regions (Cotté, d'Ovidio, Dragon, Guinet, & Lévy, 2015; Dragon, Monestiez, Bar-Hen, & Guinet, 2010; Field, Bradshaw, Burton, & Hindell, 2004; Tosh et al., 2012), where increased prey availability and abundance can be found (Abrahms et al., 2018; Bost et al., 2009; Cotté et al., 2015). These habitats may thus be particularly important during early life, when juveniles need to compensate reduced dive and forage ability (Burns, 1999). Our results support this and sug-gest that failure to locate such regions increases mortality risk. All but two pups (one survivor and one non-survivor) departed
Kerguelen in a southeastward direction, and broad-scale spatial distributions between the surviving and non-surviving groups were similar with no evidence of distinct segregation, further highlighting the importance of fine-scale habitat use within a larger common area. Whether the successful location of such features is down to chance or driven by individual innate knowl-edge and/or other cues is unknown.
5 | CONCLUSIONS
The first few months following independence represent a particularly critical time in the life cycle of long-lived marine predators such as the southern elephant seal. Results from this study both support previous assertions that juvenile mortality rates during this period are high and additionally provide direct evidence that this is driven, at least partly, by insufficient development of dive and forage ability. Furthermore, the habitat type encountered, as depicted by SST and TKE, appears to be important to survival outcome as does predation. In all instances, chance seems to play a role, and individuals need only deviate slightly from the norm to increase their mortality risk. As such, survival rates in juvenile southern elephant seals (and possibly other long-lived marine predators) may be particularly vulnerable to even small changes in cli-mate and environment, which will have concomitant consequences on demography and population dynamics.
ACKNOWLEDGMENTS
This study was funded by a European Research Council Advanced Grant as part of the program EARLYLIFE under the European Community's Seven Framework (Grant Agreement FP7/2007– 2013/ERC-2012-ADG_20120314; PI Dr Henri Weimerskirsch) and was supported by the IPEV program 109 (PI Dr Henri Weimerskirsch).
CONFLIC T OF INTEREST
None declared.
AUTHOR CONTRIBUTIONS
SLC, MA, FO, HW, and CG conceived the ideas and designed methodology; FO, HW, and CG collected the data; SLC and MA analyzed the data; SLC led the writing of the manuscript. All au-thors contributed critically to the drafts and gave final approval for publication.
ORCID
Sam L. Cox https://orcid.org/0000-0002-5409-4458
Florian Orgeret https://orcid.org/0000-0002-1940-7797
DATA AVAIL ABILIT Y STATEMENT
Matlab and R codes and scripts used to process and analyze the data are available under GitHub account “SamLCox” or within the Supporting Information. Data used in analysis are available at Dryad: https ://doi.org/10.5061/dryad.n5tb2 rbrq.
REFERENCES
Abrahms, B., Scales, K. L., Hazen, E. L., Bograd, S. J., Schick, R. S., Robinson, P. W., & Costa, D. P. (2018). Mesoscale activity facili-tates energy gain in a top predator. Proceedings of the Royal Society
B: Biological Sciences, 285, 20181101. https ://doi.org/10.1098/
rspb.2018.1101
Arnbom, T., Fedak, M. A., Boyd, I. L., & McConnell, B. J. (1993). Variation in weaning mass of pups in relation to maternal mass, postweaning fast duration, and weaned pup behaviour in southern elephant seals (Mirounga leonina) at South Georgia. Canadian Journal of Zoology, 71, 1772–1781.
Baker, J. D. (2008). Variation in the relationship between offspring size and survival provides insight into causes of mortality in Hawaiian monk seals. Endangered Species Research, 5, 55–64. https ://doi. org/10.3354/esr00122
Beauplet, G., Barbraud, C., Chambellant, M., & Guinet, C. (2005). Interannual variation in the post-weaning and juvenile survival of subantarctic fur seals: Influence of pup sex, growth rate and oceano-graphic conditions. Journal of Animal Ecology, 74, 1160–1172. https :// doi.org/10.1111/j.1365-2656.2005.01016.x
Biuw, M., McConnell, B., Bradshaw, C. J., & Fedak, M. (2003). Blubber and buoyancy: Monitoring the body condition of free-ranging seals using simple dive characteristics. Journal of Experimental Biology, 206, 3405–3423. https ://doi.org/10.1242/jeb.00583
Bost, C. A., Cotté, C., Bailleul, F., Cherel, Y., Charrassin, J. B., Guinet, C., … Weimerskirch, H. (2009). The importance of oceanographic fronts to marine birds and mammals of the southern oceans. Journal of Marine
Systems, 78, 363–376. https ://doi.org/10.1016/j.jmars ys.2008.11.022
Breed, G. A., Bowen, W. D., & Leonard, M. L. (2013). Behavioural signature of intraspecific competition and density dependence in colony-breeding marine predators. Ecology and Evolution, 3, 3838–3854.
Burns, J. (1999). The development of diving behavior in juvenile Weddell seals: Pushing physiological limits in order to survive. Canadian
Journal of Zoology, 77, 737–747. https ://doi.org/10.1139/z99-022
Carpenter, B., Gelman, A., Hoffman, M. D., Lee, D., Goodrich, B., Betancourt, M., … Riddell, A. (2017). Stan: A probabilistic program-ming language. Journal of Statistical Software, 76, 1–32.
Carter, M. I. D., Russell, D. J. F., Embling, C. B., Blight, C. J., Thompson, D., Hosegood, P., & Bennett, K. A. (2017). Intrinsic and extrinsic fac-tors drive ontogeny of early-life at-sea behaviour in a marine top predator. Scientific Reports, 7, 15505. https ://doi.org/10.1038/s4159 8-017-15859 -8
Chaigne, A., Authier, M., Richard, P., Cherel, Y., & Guinet, C. (2013). Shift in foraging grounds and diet broadening during ontogeny in southern elephant seals from Kerguelen Islands. Marine Biology, 160, 977–986. https ://doi.org/10.1007/s0022 7-012-2149-5
Costa, D. P. (1991). Reproductive and foraging energetics of high latitude penguins, albatrosses and pinnipeds: Implications for life history patterns. American Zoologist, 31, 111–130. https ://doi.org/10.1093/ icb/31.1.111
Cotté, C., d'Ovidio, F., Dragon, A. C., Guinet, C., & Lévy, M. (2015). Flexible preference of southern elephant seals for distinct mesoscale features within the Antarctic Circumpolar Current. Progress in Oceanography,
131, 46–58. https ://doi.org/10.1016/j.pocean.2014.11.011
Cox, D. R. (1972). Regression models and life-tables. Journal of the Royal
Statistical Society: Series B (Methodological), 34, 187–220. https ://doi.
org/10.1111/j.2517-6161.1972.tb008 99.x
Cox, S. L., Orgeret, F., Gesta, M., Rodde, C., Heizer, I., Weimerskirch, H., & Guinet, C. (2018). Processing of acceleration and dive data on-board satellite relay tags to investigate diving and foraging performance in free-ranging marine predators. Methods in Ecology and Evolution, 9, 64–77.
Daunt, F., Afanasyev, V., Adam, A., Croxall, J. P., & Wanless, S. (2007). From cradle to early grave: Juvenile mortality in European shags
Phalacrocorax aristotelis results from inadequate development of
for-aging proficiency. Biology Letters, 3, 371–374.
de Grissac, S., Bartumeus, F., Cox, S. L., Weimerskirch, H. (2017). Early-life foraging: Behavioural responses of newly fledged albatrosses to environmental conditions. Ecology and Evolution, 7, 6766–6778. Dee, D. P., Uppala, S. M., Simmons, A. J., Berrisford, P., Poli, P.,
Kobayashi, S., … Vitart, F. (2011). The ERA-Interim reanalysis: Configuration and performance of the data assimilation system.
Quarterly Journal Royal Meteorological Society, 137, 553–597. https
://doi.org/10.1002/qj.828
Dragon, A., Monestiez, P., Bar-Hen, A., & Guinet, C. (2010). Linking for-aging behaviour to physical oceanographic structures: Southern elephant seals and mesoscale eddies east of Kerguelen Islands.
Progress in Oceanography, 87, 61–71. https ://doi.org/10.1016/j.
pocean.2010.09.025
Drymon, J. M., & Wells, R. J. D. (2017). Double tagging clarifies post-release fate of great hammerheads (Sphyrna mokarran). Anim
Biotelemetry, 5, 28. https ://doi.org/10.1186/s4031 7-017-0143-x
Fauchald, P., & Tveraa, T. (2003). Using first-passage time in the analysis of area-restricted search and habitat selection. Ecology, 84, 282–288. https ://doi.org/10.1890/0012-9658(2003)084[0282:UFPTI T]2.0.CO;2 Fieberg, J., & Kochanny, C. O. (2005). Quantifying home-range overlap: the importance of the utilization distribution. The Journal of Wildlife
Management, 69, 1346–1359.
Field, I. C., Bradshaw, C. J. A., Burton, H. R., & Hindell, M. A. (2004). Seasonal use of oceanographic and fisheries management zones by juvenile southern elephant seals (Mirounga leonina) from Macquarie Island. Polar Biology, 27, 432–440. https ://doi.org/10.1007/s0030 0-004-0615-3
Field, I. C., Bradshaw, C. J. A., Van den Hoff, J., Burton, H. R., & Hindell, M. A. (2007). Age-related shifts in the diet composition of southern elephant seals expand overall foraging niche. Marine Biology, 150, 1441–1452. https ://doi.org/10.1007/s0022 7-006-0417-y
Friedman, J., Hastie, T., Simon, N., Qian, J., & Tibshirani, R. (2017). Glmnet:
Lasso and elastic-net regularized generalized linear models.
Friedman, J., Hastie, T., & Tibshirani, R. (2010). Regularization paths for generalized linear models via coordinate descent. Journal of Statistical
Software, 33, 1–22. https ://doi.org/10.18637/ jss.v033.i01
Gaspar, P., Georges, J.-Y., Fossette, S., Lenoble, A., Ferraroli, S., & Le Maho, Y. (2006). Marine animal behaviour: Neglecting ocean cur-rents can lead us up the wrong track. Proceedings of the Royal Society
B: Biological Sciences, 273, 2697–2702. https ://doi.org/10.1098/
rspb.2006.3623
Gordine, S. A., Fedak, M., & Boehme, L. (2015). Fishing for drifts: Detecting buoyancy changes of a top marine predator using a step-wise filtering method. Journal of Experimental Biology, 218, 3816– 3824. https ://doi.org/10.1242/jeb.118109
Grambsch, P. M., & Therneau, T. M. (1994). Proportional hazards tests and diagnostics based on weighted residuals. Biometrika, 81, 515– 526. https ://doi.org/10.1093/biome t/81.3.515
Guinet, C. (1994). Poids a la naissance et croissance des éléphants de mer austraux. Quelles informations nous apportent-ils sur le milieu marin? Recueil De Medecine Veterinaire, 170, 105–110.
Guinet, C., Jouventin, P., & Weimerskirch, H. (1992). Population changes, movements of southern elephant seals on Crozet and Kerguelen Archipelagos in the last decades. Polar Biology, 12, 349–356. https :// doi.org/10.1007/BF002 43106
Hall, A. J., McConnell, B., & Barker, R. J. (2001). Factors affecting first-year survival in grey seals and their implications for life history strat-egies. Journal of Animal Ecology, 70, 138–149.
Hart, K. M., & Hyrenbach, K. D. (2009). Satellite telemetry of ma-rine megavertebrates: The coming of age of experimental science.
Endangered Species Research, 10, 9–20.
Hays, G. C., Bradshaw, C. J. A., James, M. C., Lovell, P., & Sims, D. W. (2007). Why do Argos satellite tags deployed on marine animals stop