HAL Id: hal-02358188
https://hal.archives-ouvertes.fr/hal-02358188
Submitted on 11 Nov 2019HAL is a multi-disciplinary open access archive for the deposit and dissemination of sci-entific research documents, whether they are pub-lished or not. The documents may come from teaching and research institutions in France or abroad, or from public or private research centers.
L’archive ouverte pluridisciplinaire HAL, est destinée au dépôt et à la diffusion de documents scientifiques de niveau recherche, publiés ou non, émanant des établissements d’enseignement et de recherche français ou étrangers, des laboratoires publics ou privés.
Unveiling the anatomy of Termination 3 using water and
air isotopes in the Dome C ice core, East Antarctica
Camille Bréant, Amaelle Landais, Anais Orsi, Patricia Martinerie, Thomas
Extier, Frédéric Prié, Barbara Stenni, Jean Jouzel, Valérie Masson-Delmotte,
Markus Leuenberger
To cite this version:
Camille Bréant, Amaelle Landais, Anais Orsi, Patricia Martinerie, Thomas Extier, et al.. Unveiling the anatomy of Termination 3 using water and air isotopes in the Dome C ice core, East Antarctica. Quaternary Science Reviews, Elsevier, 2019, 211, pp.156-165. �10.1016/j.quascirev.2019.03.025�. �hal-02358188�
1 Unveiling the anatomy of Termination 3 using water and air isotopes in the Dome C ice core, East 1
Antarctica 2
3
Camille Bréant1,2, Amaëlle Landais1,*, Anaïs Orsi1, Patricia Martinerie2, Thomas Extier1, Frédéric Prié1,
4
Barbara Stenni3, Jean Jouzel1, Valérie Masson-Delmotte1 and Markus Leuenberger4
5 6
1 Laboratoire des Sciences du Climat et de l’Environnement, LSCE/IPSL, CEA-CNRS-UVSQ, Université
7
Paris-Saclay, Gif-sur-Yvette, France 8
2 Univ. Grenoble Alpes, CNRS, IRD, Grenoble INP, IGE, Grenoble, 38000, France
9
3 Department of Environmental Sciences, Informatics and Statistics, University Ca’ Foscari of Venice,
10
Venice, Italy 11
4 Climate and Environmental Physics, Physics Institute and Oeschger Center for Climate Research,
12
University of Bern, Sidlerstrasse, 5, 3012 Bern, Switzerland 13
14
* corresponding author from February 2019: amaelle.landais@lsce.ipsl.fr
15 16 17 18 Abstract 19 20
Each glacial – interglacial transition of the Quaternary occurs in a different orbital context leading 21
to various timing for the deglaciation and sequence of high vs low latitudes events. Termination 3, 250 22
kiloyears before present (ka), is an unusual deglaciation in the context of the last 9 deglaciations 23
recorded in the old EPICA Dome C (EDC) Antarctic ice core: it exhibits a three-phase sequence, two 24
warming phases separated by a small cooling, the last phase suggesting a particularly rapid 25
temperature increase. We present here new high resolution 15N and deuterium excess (d-excess) data
26
from the EDC ice core to provide a detailed temperature change estimate during this termination. 27
Then, we combined the D and 18O to discuss the relationship between high and low latitude changes
28
through the d-excess. We also provide the high vs low latitude sequence of events over this 29
deglaciation without chronological uncertainty using low latitude ice core proxies. In agreement with 30
previous studies based on speleothem analyses, we show that the first phase of Termination 3 (256 to 31
249 ka) is associated with small Heinrich like events linked to changes in ITCZ position, monsoon 32
activity and teleconnections with Antarctica. In a context of minimum Northern Hemisphere insolation, 33
2 this leads to a rather strong Antarctic warming, as observed in the 15N record in contrast to the
34
relatively small D increase. The second warming phase occurs during the rise of the Northern 35
hemisphere insolation, with a large Heinrich like event leading to the characteristic Antarctic warming 36
observed in the 15N and D increase as for the more recent terminations.
37 38
Keywords 39
Termination 3, deglaciations, ice core, water and air isotopes, Antarctic temperature, firn densification 40
model, bipolar seesaw, Heinrich like events 41 42 43 1- Introduction 44 45
The climate of the Quaternary is characterized by the succession of glacial and interglacial periods, 46
with a detailed description of their characteristics thanks to a diversity of proxy records from oceanic, 47
terrestrial and glacial archives, and dating methods (Spratt & Lisiecki 2016; Jouzel et al. 2007; Tzedakis 48
et al. 2017). The occurrence of glacial and interglacial periods is generally attributed to the driving 49
effect of changes in the seasonal and latitudinal distribution of incoming solar radiation, due to 50
changes in the Earth’s astronomical characteristics (Milankovitch, 1941), as well as key Earth system 51
feedbacks, involving ice sheet and carbon cycle dynamics (Paillard & Parrenin 2004). 52
The exact mechanisms at play during glacial terminations remain however elusive, and 53
explanations for the timing of terminations, the different magnitudes of glacial-interglacial transitions, 54
and the interplay between multi-millennial trends and abrupt events are still incomplete. The accurate 55
documentation of multiple terminations, taking place under different orbital contexts, is one key line 56
of evidence (Yin and Berger, 2012; PAGES, 2016; Tzedakis et al., 2017). The important role of obliquity 57
is directly visible on the 40 kiloyears (hereafter ka) periodicity of glacial – interglacial cycles occurring 58
before the mid-Pleistocene transition and can also be dominant in the younger terminations (Huybers, 59
2007). In parallel, a recent study using East Asian speleothems showed that deglaciations of the last 60
650 ka occur every 4 or 5 precession cycles, confirming the important role of precession (Cheng et al., 61
3 2016). The unfolding (or not) of a deglaciation during a precession cycle has been suggested to be 62
related to the glacial state, such as the initial ice volume (Paillard et al., 1998), or integrated summer 63
insolation (Tzedakis et al., 2017). The concentration of atmospheric greenhouse gases also plays a 64
major role during deglaciations. Several studies have shown, within age scale uncertainties, that 65
atmospheric CO2 concentration and East Antarctic temperature started to increase synchronously at
66
the beginning of the last two deglaciations (Pedro et al., 2012; Landais et al., 2013; Parrenin et al., 67
2013). The amplitude of simulated global temperature changes over deglaciations has been shown to 68
depend jointly on the amplitude of CO2 concentration increase and insolation, namely obliquity for the
69
Southern Hemisphere and precession for the Northern Hemisphere (Yin and Berger, 2012). 70
The Antarctic EPICA Dome C (EDC) ice core provides very high resolution records encompassing 71
changes in local climate (with a resolution of 20 to 50 years back to 430 ka) as well as changes in 72
atmospheric composition and greenhouse gases concentrations of the last 9 terminations (EPICA 73
Community Members, 2004; Jouzel et al., 2007; Loulergue et al., 2008; Lüthi et al., 2008; Bereiter et 74
al., 2015). Together with the sea level record obtained from marine sediments (e.g. Röhling et al., 2014; 75
Spratt and Lisiecki, 2016), the D record from the EDC ice core shows that the last 5 terminations (i.e. 76
over the last 430 ka) are generally of higher amplitude than the terminations over the period 800 – 77
430 ka. Each termination still displays different characteristics (amplitude, rate of change) that were 78
discussed in previous studies (Röthlisberger et al., 2008; PAGES, 2016). In this context, Termination 3 79
seems associated with the most rapid temperature increase (increase of EDC D at 14.8 ‰.ka-1 for the
80
period 251.5 to 247.8 ka – Figure 1) making it a pertinent benchmark for the study of climate change 81
on relatively short timescales. 82
Marine records show that terminations of at least the last 500 ka are systematically associated 83
with the occurrence of iceberg discharges from the Laurentide ice sheet recorded as occurrence of 84
Heinrich like events in the IRD (Ice Rafted Debris characterized by a large amount of detrital quartz in 85
the sediment) in Atlantic marine cores (McManus et al., 1999; Hodell et al., 2008). In parallel, East 86
Asian speleothems highlight systematic Weak Monsoon Intervals (WMI) occurring during the 87
4 terminations synchronously with Heinrich like events and a rise in Northern Hemisphere summer 88
insolation (Cheng et al., 2009; 2016). Mechanistic links exist between Heinrich like events and WMI: 89
Heinrich like events are occurring over the same millennial periods as southward shifts of atmospheric 90
circulation in the Northern Hemisphere and in particular with southward shifts of tropical rain belts 91
(Chiang and Bitz, 2005). The Heinrich like events and associated lower latitudes climate changes are 92
hence fully embedded in the dynamic of terminations (e.g. Wolff et al., 2009; Denton et al., 2010). 93
Again, Termination 3 stands out being associated with 3 IRD peaks and 3 WMI while other terminations 94
over the last 450 ka are associated with only 1 or 2 IRD peaks (Jiang et al., 2010; Obrochta et al., 2014; 95
Figure 1). The unusual sequence observed over Termination 3 between millennial events and polar 96
temperature increase makes the study of Termination 3 key to understand the interactions between 97
millennial events (Heinrich Stadials, WMI) and orbital change (long term increase in CO2 and polar
98
temperature). 99
Only few studies provided up to centennial resolution data for Termination 3, all of them 100
highlighting millennial scale variability during the end of marine isotopic stage 8 and Termination 3, 101
both in the Northern and in the Southern Hemispheres (i.e. between ~260 and 245 ka) (Pahnke et al., 102
2003; Cheng et al., 2009; Jiang et al., 2010; Pérez-Mejías et al., 2017). In Antarctic deep ice cores, two 103
warming phases have been identified within Termination 3 (e.g. Watanabe et al., 2003; Röthlisberger 104
et al., 2008), the first one being associated with a relatively slow D increase (5.18 ‰.ka-1), interpreted
105
to reflect a gradual warming, before the fastest D rise interpreted to reflect a fast warming. 106
Here, we focus on Termination 3 using new datasets from the EDC ice core. We combine water 107
isotopes (published D and new 18O data) with new 15N of N
2 trapped in air bubbles, thereafter 15N.
108
The combination of water isotopes, D and 18O already published over the last 2 deglaciations at
109
Dome C (Stenni et al., 2001, 2010; Masson-Delmotte et al., 2010), can indeed be very useful to discuss 110
the relationship between local (18O and D at first order) and lower latitudes climatic changes
111
(deuterium excess or d-excess defined as D - 8*18O) (e.g. Vimeux et al., 1999; Uemura et al., 2018).
112
15N is a proxy of firn processes driven by changes in local accumulation and temperature
5 (Severinghaus et al. 1998) providing an indicator of Antarctic climate change in the gas phase of the 114
ice core records (Caillon et al., 2003; Landais et al., 2013). We briefly describe our methods, and discuss 115
our results, including the reconstruction of site and source temperatures from water stable isotopes, 116
and the drivers of 15N at EDC over Termination 3. We finally compare to previous records from other
117
archives (marine sediment cores and speleothems) and discuss the sequence of events encompassing 118
changes in Antarctic and global climate over Termination 3. 119
120
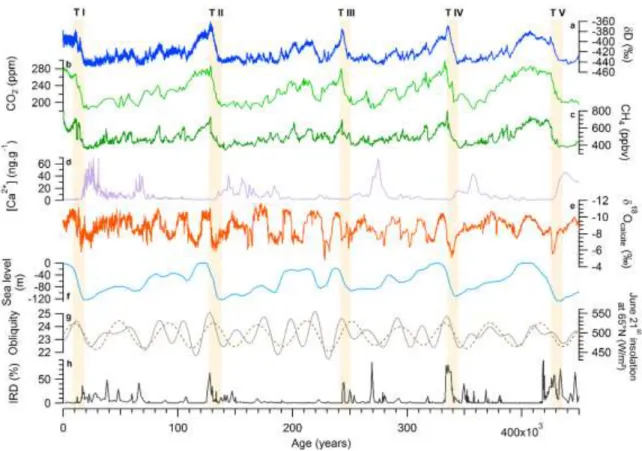
Figure 1: Climatic variations over the last 450 ka. a: D record from EDC (Jouzel et al., 2007). b: Antarctic CO2
121
from EDC and Vostok (Lüthi et al., 2008). c: East Antarctic CH4 record (Loulergue et al., 2008) d: Ca2+
122
concentration in the EDC ice core (Lambert et al., 2012). e: 18Ocalcite from East Asian speleothems (Cheng et al.,
123
2016). f: Global sea level change estimate (Bintanja et al., 2005). g: June 21st insolation at 65°N in solid line and
124
obliquity in dotted line (Laskar et al., 2004). h: IRD percentage at site ODP980 (McManus et al., 1999). The timing
125
of Termination 5 (TV) to Termination 1 (TI) is indicated by yellow bars. The 4 upper records are issued from the
126
same ice core, hence with a maximum relative uncertainty of 1 ka on the chronology. On opposite, the 4 lower
127
curves are all on their respective timescales (absolute timescale for obliquity and precession; timescale of each
128
archive for the others) so that uncertainties of up to 6 ka can be attached to the comparison of the different
129 records. 130 131 2- New data 132
2-1- EPICA Dome C (EDC) 18O and d-excess 133
6 Water 18O measurements of the Dome C ice core were performed along 55 cm samples at the
134
Department of Earth Sciences of University of Parma and at the Department of Geological, 135
Environmental and Marine Sciences of University of Trieste using a CO2 / water equilibration method
136
(Meyer et al., 2000). These new measurements complete the 800 ka D records of the EDC ice core 137
previously obtained at Laboratoire des Sciences du Climat et de l’Environnement and published in 138
(Jouzel et al., 2007). Home water standards were exchanged between the three institutes during the 139
measurement period to ensure the proper comparison of the D and 18O data series. d-excess was
140
then calculated from the combined measurements of D and 18O with a resulting accuracy of 1‰.
141
The D and d-excess series presented on the section 3 cover the time period 230 to 270 ka with 142
an uncertainty of about 3 ka on the AICC2012 timescale (Bazin et al., 2013). This period corresponds 143
to the depth range 2232 to 2381 m and extends the EDC 18O and d-excess records over the last 140
144
ka (Stenni et al., 2010). 145
As already noted, the D record shows a two-step increase for Termination 3: a first increase of 146
15‰ occurs from 253 to 249 ka (phase III-a, Figure 2). The same pattern was also observed on the 147
other deep ice cores covering Termination 3 on which water isotopes have been measured (SOM – 148
Figure S1). d-excess shows a parallel increase to D over phase III-a. d-excess and D are then anti-149
correlated during the major D increase of Termination 3 between 248 and 243 ka (phase III-b, Figure 150
2). Finally, d-excess reaches a maximum during the glacial inception, i.e. when D is decreasing from 151
243 to 230 ka (Figure 2). This d-excess signal during glacial inceptions is a classical pattern also observed 152
for other glacial inceptions in Antarctic ice cores (Vimeux et al., 1999; Stenni et al., 2010; Uemura et 153
al., 2018): d-excess increases while D decreases. 154
7 155
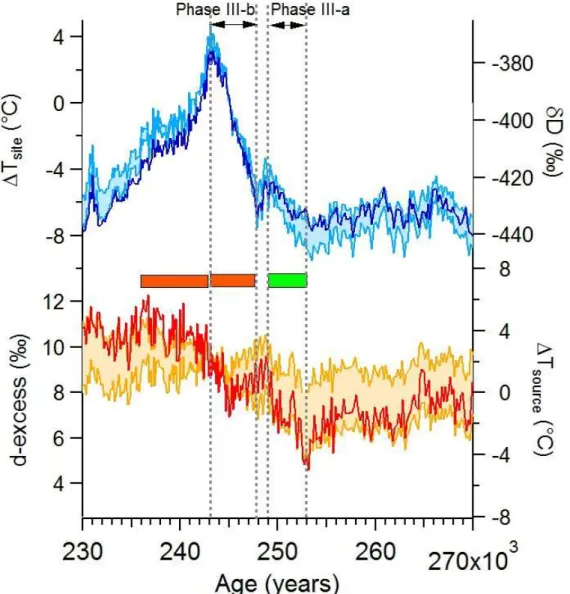
Figure 2: D (in dark blue) and d-excess (in red) measurements on Dome C ice core with highlights on the phases
156
of correlation (green rectangle) and anti-correlation (red rectangles) between these two proxies over the
157
Termination 3. The Tsite and Tsource reconstructions within their uncertainty ranges are displayed in shaded
158
areas. The vertical shaded lines display the limits of phase III-a and phase III-b.
159 160
2-2- EDC 15N 161
Three series of measurements of 15N of N
2 have been performed along Termination 3 on the EDC
162
ice core (Figure 3): 163
1- 50 duplicate samples (2262 to 2352 m depth) were measured in 2008 at Princeton University 164
using a semi-automated wet extraction line with associated uncertainty of 7 ppm (Dreyfus et al., 165
2010). 166
8 2- 48 duplicate samples (2268 to 2348 m depth) were measured in 2013 at LSCE using a semi-167
automated wet extraction line with associated uncertainty of 10 ppm (method in Capron et al., 168
2010). 169
3- 172 duplicate samples (1904 to 2580 m depth) were measured in 2015-2016 at LSCE using the 170
same semi-automated wet extraction line and similar associated uncertainty of 10 ppm. 171
15N measurements are expressed with respect to 15N of atmospheric air, with expected similar
172
values at Princeton University and at LSCE. Still, an average shift of + 0.007 ‰ has been found in the 173
original Princeton values compared to the LSCE data. The source of this offset is unknown. We thus 174
follow the correction of Dreyfus et al. (2010) and subtracted 0.007 ‰ from all Princeton data in the 175
set of data presented here. 176
As already shown in Dreyfus et al. (2010), 15N record shows a clear and strong increase from 2350
177
m to 2310 m depth probably corresponding to Termination 3 according to the AICC2012 gas age 178
timescale for EDC (Figure 3). After a 15N maximum at 2308 m probably associated with the end of
179
Termination 3, 15N shows a clear decrease from 2308 to 2250 m. Deeper in the core, the 15N record
180
is more scattered, showing a general decreasing tendency from 2580 m to 2350 m with some 181
fluctuations over the depth range 2480 m to 2350 m (Figure 3). 182
183
Figure 3: 15N data for Termination 3 of Dome C ice core using the correction for data measured in Princeton vs
184
LSCE proposed by Dreyfus et al. (2010).
9 The main 15N increase corresponding to Termination 3 on the EDC core was also observed on the
186
Vostok 40Ar data over the same termination (Caillon et al., 2003), 40Ar being assumed to be related
187
to physical fractionations in the firn before bubble enclosure as for 15N (see next section). Finally, 15N
188
deglacial increase of ~0.15‰ was also clearly observed over the other terminations at EDC (Dreyfus et 189
al., 2010, SOM – Figures S2 and S3). 190
191
3- Interpretation of the d-excess and 15N signals 192
3-1- Interpretation of water stable isotopes: site and source temperature 193
194
Records of d-excess in Antarctic polar ice cores have classically been used to infer changes in 195
moisture sources / evaporation conditions following the studies of Vimeux et al. (1999), Stenni et al. 196
(2001), Vimeux et al. (2001), Masson-Delmotte et al. (2010), Markle et al. (2016) and Uemura et al. 197
(2018). In surface water vapour, at synoptic timescales, d-excess variations are mainly influenced by 198
variations in relative humidity controlling the relative influence of kinetic and equilibrium effects 199
(Merlivat and Jouzel, 1979; Gat et al., 1991). This influence is however muted when looking at the d-200
excess evolution in polar regions and on longer timescales. Moreover d-excess is strongly modified 201
during distillation from the source to the polar precipitation regions through two effects: (1) the 202
dependence of equilibrium fractionation coefficient at condensation with temperature and (2) the 203
decrease of the slope D vs 18O when both D and 18O decrease toward very negative values (e.g.
204
Jouzel and Merlivat, 1984; Touzeau et al., 2016). This effect becomes predominant in very cold regions 205
of East Antarctica, for extremely low D and 18O. In these circumstances, local cooling leads to a
d-206
excess increase not linked to moisture source characteristics (Uemura et al., 2012). Alternative 207
definitions of d-excess using a logarithm formulation have thus been proposed to circumvent this site 208
temperature signal (e.g. Uemura et al., 2012; Markle et al., 2016; Dütsch et al., 2017). However, the 209
ln(D+1) vs ln(18O+1) slope is not as constant as the 18O vs D slope for large 18O – D ranges, hence
210
leading to variable slope as a function of 18O values when defining the excess with a logarithm
10 definition. Here, we made the choice to show the d-excess curves keeping the classical d-excess 212
definition. This choice of definition does not affect the reconstructions displayed below. 213
Following earlier studies of EDC d-excess, the combination of D and d-excess can be used to 214
reconstruct the local temperature (Tsite) and the moisture source temperature (Tsource). The moisture
215
sources for precipitation at Dome C are located mainly in the temperate area of the Indian ocean 216
(Masson-Delmotte et al., 2010). Here, we use the values for the Tsite and Tsource reconstructions for the
217
EDC site given by Stenni et al. (2010) based on the use of a theoretical, mixed cloud isotopic model and 218
the assumption that relative humidity is constant: 219 220 𝛥𝑇𝑠𝑖𝑡𝑒= 0.16 × 𝛥𝛿𝐷𝑐𝑜𝑟𝑟 + 0.44 × 𝛥𝑑−𝑒𝑥𝑐𝑒𝑠𝑠𝑐𝑜𝑟𝑟 (1) 221 𝛥𝑇𝑠𝑜𝑢𝑟𝑐𝑒 = 0.06 × 𝛥𝛿𝐷𝑐𝑜𝑟𝑟 + 0.93 × 𝛥𝑑−𝑒𝑥𝑐𝑒𝑠𝑠𝑐𝑜𝑟𝑟 (2) 222 223
The 𝛥 symbol stands for the difference at each level between the measured or reconstructed 224
parameter and the average of this parameter for the recent period (we performed the average over 225
the last 2000 years for the reference to “the recent period”). 𝛥𝑑𝐷𝑐𝑜𝑟𝑟 and 𝛥𝑑−𝑒𝑥𝑐𝑒𝑠𝑠𝑐𝑜𝑟𝑟 were
226
calculated following Jouzel et al. (2003) using the 18O
sea water obtained in Bintanja et al. (2005)
227
synchronized on EDC timescale (Parrenin et al., 2007): 228 229 𝛿𝐷𝑐𝑜𝑟𝑟 = [ 𝛿𝐷 − 8 × 𝛿18𝑂𝑠𝑒𝑎 𝑤𝑎𝑡𝑒𝑟× (1 +1000𝛿𝐷 )] ÷ [1 + 8 × (𝛿 18𝑂 𝑠𝑒𝑎 𝑤𝑎𝑡𝑒𝑟 1000 )] (3) 230 𝛿18𝑂 𝑐𝑜𝑟𝑟 = [ 𝛿18𝑂 − 𝛿18𝑂𝑠𝑒𝑎 𝑤𝑎𝑡𝑒𝑟× (1 +𝛿 18𝑂 1000)] ÷ [1 + ( 𝛿18𝑂 𝑠𝑒𝑎 𝑤𝑎𝑡𝑒𝑟 1000 )] (4) 231 ∆𝛿𝐷𝑐𝑜𝑟𝑟 = 𝛿𝐷𝑐𝑜𝑟𝑟− 𝛿𝐷𝑎𝑣𝑒𝑟𝑎𝑔𝑒 (5) 232 ∆𝛿18𝑂 𝑐𝑜𝑟𝑟= 𝛿18𝑂𝑐𝑜𝑟𝑟− 𝛿18𝑂𝑎𝑣𝑒𝑟𝑎𝑔𝑒 (6) 233 ∆𝑑 − 𝑒𝑥𝑐𝑒𝑠𝑠𝑐𝑜𝑟𝑟 = ∆𝛿𝐷𝑐𝑜𝑟𝑟− 8 × ∆𝛿18𝑂 𝑐𝑜𝑟𝑟 (7) 234 235
These temperature reconstructions are based on the use of a mixed cloud isotopic model (Ciais and 236
Jouzel, 1994) describing the evolution of water isotopic composition along a trajectory toward 237
Antarctica and run over a large range of Tsite and Tsource. Different tunings of this model can however
238
lead to significant variations in the coefficients of equations (1) and (2). Alternative reconstructions 239
11 have thus been proposed (e.g. Uemura et al., 2012 for a complete study) enabling one to provide the 240
uncertainty range to the Tsite and Tsource reconstructions displayed on Figure 2. These alternative
241
reconstructions do not affect the shape of the reconstructed Tsite and Tsource variations but the
242
amplitudes of variations over Termination 3 are significantly affected, especially for the Tsource
243
reconstruction (Figure 2). 244
The Tsite and Tsource reconstructions for Dome C are presented on Figure 2. While the evolution of
245
Tsite is mainly parallel to the δD evolution and share many similarities with it, some differences are
246
observed. Over phase III-a, Tsite displays an increase equivalent to 2/5 of the main Tsite increase over
247
Termination 3 occurring during phase III-b. Over the same period (phase III-a, 253 to 249 ka), δD only 248
shows an increase of 1/4 of the main δD increase over phase III-b. The fact that the increase of EDC D 249
over phase 1 of Termination 3 is relatively smaller than the corresponding Tsite increase is probably
250
because D is not only sensitive to the local temperature but rather to the temperature gradient 251
between the evaporative site and the precipitation site (i.e. between the first and final point of the 252
distillation trajectory). The Tsource reconstruction based on d-excess data shows an increase over phase
253
III-a on Termination 3, in parallel to the Tsite increase (Figure 2). Since both Tsite and Tsource increase by
254
similar amplitude, we expect that the result is the small D signal observed on the EDC record. Over 255
phase III-b, Tsource is not varying much (slight decrease) so that the dynamic of D increase is directly
256
reflected in the Tsite increase. Tsource evolution is very different from the Tsite evolution over glacial
257
inception: it follows the d-excess signal which remains at a relatively high level. This signal was already 258
largely discussed in Vimeux et al. (1999) and following studies: it reflects the fact that the temperature 259
of moisture source remains high during glacial inception favoring evaporation in temperate latitudes 260
and hence significant transport of moisture toward polar area to contribute to the growing of glacial 261
ice sheets. 262
The Tsite and δD signals exhibit some differences during the glacial inception with the Tsite signal
263
decreasing less rapidly than the δD signal. While this relatively slower decrease of Tsite compared to D
264
is also observed for other glacial inceptions and on the Vostok and Dome C ice cores (Vimeux et al., 265
12 2001; Stenni et al., 2010; SOM – Figure S1), the differences in the Tsite vs D behaviours observed over
266
Termination 3 is less obvious for the other terminations. Finally, note that the D vs Tsite differences
267
are much less visible at the Dome F site, the D signal at Dome F sharing more variability with the Tsite
268
signal than at Dome C or Vostok (SOM – Table T1). 269
3-2- Interpretation of the 15N signal 270
271
In a previous study (Bréant et al., 2017), we summarized the different possible influences on the 272
δ15N in Antarctic ice core. δ15N is directly related to the depth of the firn diffusive zone through
273
gravitational fractionation as15N
grav= gz/RT at first order approximation with z the depth of the
274
diffusive zone, g the gravity acceleration constant, R the gas constant and T the mean temperature. 275
Note that a second order thermal effect is also expected in Antarctica when temperature gradients 276
occur in the firn following the equation 15N
therm= Ω×T with Ω the thermal fractionation coefficient
277
for stable isotopes of nitrogen (Grachev and Severinghaus, 2003) and T the temperature gradient 278
between the top and the bottom of the firn. The depth of the firn diffusive zone is the difference 279
between the lock-in depth (LID) at the bottom of the firn and the depth of the convective zone at the 280
top of the firn. Previous studies based on dating constraints have shown that the existence of large 281
convective zones at Dome C during glacial periods is highly improbable (Parrenin et al., 2012; Bazin et 282
al., 2013; Veres et al., 2013) so that we concentrate here on the different influences on the firn LID. 283
The firn LID increases with increasing accumulation rate and decreases with increasing 284
temperature (increasing metamorphism speed). On the timescale of a deglaciation, both temperature 285
and accumulation increase so that LID is influenced by two opposite processes: LID decreases through 286
temperature increase and LID increases through accumulation increase. In addition, it has been 287
suggested that the concentration of impurities (taken into account through the Ca2+ concentration for
288
this purpose) can increase the densification speed in the firn (Hörhold et al., 2012; Freitag et al., 2013). 289
Since impurity concentration, as indicated by EDC calcium record (Röthlisberger et al., 2008), 290
systematically decreases during deglaciation, it should lead to an increase of LID and hence δ15N. While
291
these three effects can be accounted for in firn densification models (Freitag et al., 2013; Bréant et al., 292
13 2017), reproducing the evolution of δ15N over deglaciations in cold sites of East Antarctica with firn
293
densification models has long been a challenge (Sowers et al., 1992; Landais et al., 2006; Capron et al., 294
2013; Bréant et al., 2017). In general, modeled δ15N systematically decreases over terminations, while
295
ice core data indicate an increase of δ15N during these periods. The temperature effect is thus
296
dominating the LID and 15N evolutions in the model at very cold sites, a feature which is not supported
297
by ice core records. In a recent firn model development (new IGE – previously LGGE – firn model), we 298
resolved the model-data mismatch by assuming that the creeping mechanism is different at very low 299
temperature (around -60°C) from the creeping mechanism at higher temperature (around -30°C) 300
(Bréant et al., 2017), a behavior supported by evidence from hot ceramic sintering (Wilkinson and 301
Ashby 1975; Bernache-Assolant, 2005). 302
Despite these firn model improvements, disentangling the effects of temperature, accumulation 303
rate and impurity concentration on the δ15N evolution over deglaciations is challenging due to the
304
common co-variations of these parameters (SOM – Figure S2). Indeed, the reconstruction of snow 305
accumulation in ice cores from the East Antarctic plateau is based at first order on its relationship to 306
local temperature and inferred from water stable isotopic records (e.g. Parrenin et al., 2004). While 307
this assumption is challenged in coastal areas for centennial and millennial variability (e.g. Fudge et al., 308
2016), the thermodynamic effect dominates at glacial to interglacial transitions. This reconstruction 309
can then be further refined using dated horizons and thinning scenarios from glaciological models as 310
done for example during the construction of the coherent ice core chronology AICC2012 (Bazin et al., 311
2013; Veres et al., 2013). However, even with the constraints inferred from the dated horizons and 312
thinning scenarios, the accumulation rate increases significantly in parallel to D and Tsite over
313
deglaciations in Antarctica (SOM – Figure S2). In contrast, the link between temperature, accumulation 314
rate and Ca2+ is not always as strong. In particular, Termination 3 displays the strongest Ca2+
315
concentration decrease observed 20 to 30 ka before the main accumulation rate and temperature 316
increase, themselves parallel to the D signal (Figure 1, SOM – Figure S2). This makes Termination 3 a 317
unique deglaciation to disentangle the influences of impurity and temperature (accumulation). 318
14 EDC δ15N increase over Termination 3 is in two steps, the first one (+ 0.06 ‰) between 256 and
319
248 ka and the second one (+ 0.11 ‰) between 248 and 243 ka. These increases occur more than 15 320
ka later than the main impurity decrease, i.e. a temporal lag much larger than the maximum 1 ka 321
uncertainty in the relative chronology between gas age (on which 15N is displayed) and ice age (on
322
which Ca2+ and D are displayed) (Bazin et al., 2013; Veres et al., 2013). Only a small decrease in δ15N
323
(less than 0.06 ‰) is observed around 270 ka corresponding to the major Ca2+ concentration peak
324
(Figure 4) with no significant changes in temperature and accumulation as inferred from the D record. 325
All together, these observations suggest that impurity concentration is not the major driver of the 15N
326
evolution over Termination 3. 327
In order to address this result more quantitatively, we have run the IGE firn densification model 328
equipped with impurity effect parameterization (Bréant et al., 2017) over the sequence of Termination 329
3 making the assumption that only impurity concentration is varying, hence keeping constant average 330
values for temperature and accumulation rate. At EDC where the δ15N record is the longest, the model
331
produces a 15N decrease of 0.04 ‰ (compared to slightly less than 0.06 ‰ in the measurements) over
332
the major impurity concentration peak at 270 ka. Over the Termination 3 period where the main 15N
333
increase is observed (256 to 244 ka), the model forced by impurity concentration only simulates a + 334
0.03‰ 15N increase while the measured 15N increases by 0.16‰ (Figure 4). The impurity effect is
335
hence not able to explain the 15N increase corresponding to Termination 3.
336
Most of the 15N increase over Termination 3 should thus be explained by changes in
337
accumulation rate and temperature. Increase in accumulation rate leads to increases in LID and then 338
in 15N through gravitational fractionation. At first order, the increase in 15N due to accumulation is
339
thus expected to be parallel with the increase in D. To check such an hypothesis, we have simulated 340
the 15N evolution over the Termination 3 using the IGE firn densification model (Bréant et al., 2017)
341
forced by the AICC2012-derived accumulation rate only (i.e. with constant temperature and Ca2+
342
concentration). A 15N increase of 0.103 ‰ is modelled between 253 and 243 ka (Figure 4). This change
343
is smaller but of the same order than the 0.16 ‰ increase of measured 15N. However, the modeled
15 15N is delayed by 2 ka compared to the measured 15N. This shows that an additional effect also
345
influences the 15N signal.
346
The temperature effect is more complicated to infer than the accumulation rate effect. Indeed, 347
temperature can influence the 15N evolution either through the thermal effect or through the
348
gravitational effect because of a change of the LID induced by temperature variations. The 349
temperature increase during the deglaciation leads to a decrease of the LID because of increasing firn 350
metamorphism. This effect was dominating the modeled 15N evolution in cold sites in previous firn
351
densification models. However, this effect is muted in the new version of the IGE firn densification 352
model. Running this model over Termination 3 (Figure 4) with Tsite forcing only leads to a 15N decrease
353
of 0.058‰ between 246 and 241 ka, this decrease integrating both the thermal and the gravitational 354
effects. The thermal effect leads to a slow increase of the modeled 15N between 256 ka and 244 ka
355
(total increase of 0.044‰, Figure 4). On opposite, the gravitational effect shows a mostly late decrease 356
of 0.05 ‰ between 246-241 ka, linked to the decrease of the firn depth. Combined to a thermal 15N
357
decrease between 244 and 241 ka (Figure 4), it is responsible for the global modeled 15N decrease of
358
0.058‰ between 246 and 241 ka. 359
16 360
Figure 2: Comparison between EDC 15N data with 15N simulations run with the IGE firn densification model. a:
361
scenario for temperature forcing (difference with present-day surface temperature). b: accumulation rate
362
scenario (from AICC2012 – the modeled 15N is not significantly modified when using the accumulation rate
363
reconstructed from water isotopes as in Parrenin et al., 2007). c: Ca2+ concentration used as input scenario for
364
the firn densification model. d: comparison of measured (green) and modelled 15N for different configurations
365
of the IGE firn densification model (all forcing in dark blue dashed line, only accumulation forcing in dark blue,
366
only dust forcing in light blue, only temperature forcing in red, temperature and accumulation rate forcing in
367
yellow). e: the purple lines on the lower panel show the outputs of the IGE model forced by temperature only for
368
both its gravitational part (solid line, right y-axis) and its thermal part (dashed line, left y-axis). The blue rectangle
369
indicates phase 1 and the yellow rectangle indicates phase 2.
370 371
Summarizing and based on our model-data comparison, we are now able to better explain the drivers 372
of the 15N increase over the two increasing phases of Termination 3 (blue and yellow bars on Figure 4).
373
During the first 15N increasing phase (blue on figure 4), the 15N increase is explained by a combination of
374
thermal fractionation and accumulation effects, with a negligible contribution of impurity concentration. 375
During the second 15N increasing phase (yellow on figure 4), the 15N increase is essentially driven by the
376
increasing accumulation rate, itself mainly related to increasing temperature. The direct temperature effect 377
plays a role in the early 15N increase over the second phase. However a few ka after the beginning of this
17 second 15N increasing phase, increasing thermal 15N and decreasing gravitational 15N effects
379
compensate each other so that the total effect is nil. When taking into account the influence of 380
temperature, accumulation rate and impurity concentration in the firn densification model as adjusted for 381
cold and low accumulation sites of East Antarctica (Bréant et al., 2017), we observe a total modeled 15N
382
signal in very good agreement with our data for Dome C Termination 3 as was already observed for 383
Termination 1 (Bréant et al., 2017). This is an additional validation of the firn model development 384
performed by Bréant et al. (2017) since the phasing between changes in temperature and changes in 385
impurity concentrations is strongly different in Termination 1 and Termination 3. This good result can also 386
be extended to the whole 800 ka record (SOM – Figure S3). 387
388
4- Discussion – East Antarctic climate dynamic over Termination 3 389
390
One of the characteristics of Termination 3 on the EDC D record is the succession of two 391
increasing phases (a first minor one followed by a larger one) between 253 and 244 ka with an 392
interruption at 248-249 ka. The existence of these two D increasing phases are confirmed by the 15N
393
measurements and Tsite reconstruction. Indeed, the 15N increase over the first phase of Termination
394
3 at EDC is mainly influenced by local temperature and accumulation rate, itself partly related to 395
temperature through thermodynamic effects on multi-millennial timescale. The 15N and T
site data
396
hence show that the first phase of Termination 3 is of larger amplitude than suggested by the D record 397
and probably started earlier (at 256 ka instead of 253 ka as suggested by the 15N signal).
398 399
4-1- Specificity of Termination 3 in other climatic records 400
401
This feature of Termination 3 is also strongly expressed in other records from relatively high 402
latitudes of the Southern Hemisphere, such as the 18O
planktonic record of Pahnke et al. (2003) in the
403
Southern Ocean, close to the east of New Zealand (Chatham Rise), reflecting either a local climatic and 404
hydrologic modification or a front shift during the first phase of Termination 3 (Figure 5). Note that this 405
record can be paralleled to the Tsource reconstruction over the first phase of Termination 3 reflecting
18 either an increase of the oceanic temperature or a shift of the source evaporative region toward lower 407
latitudes. 408
In the Northern Hemisphere, several records highlighted a succession of millennial events 409
occurring prior to the main deglaciation signal of Termination 3 (Jiang et al., 2010; Obrochta et al., 410
2014; Cheng et al., 2009, 2016; Pérez-Mejías et al., 2017). The fingerprints of Heinrich-like events have 411
been identified over this period (McManus et al., 2004), through cold periods in the Northern Atlantic 412
(Obrochta et al., 2014), dry events in Southern Europe (Pérez-Mejías et al., 2017) and WMI in East 413
Asian speleothems (Jiang et al., 2010; Cheng et al., 2009, 2016) (Figure 5). In particular, Cheng et al. 414
(2009) proposed a three-phase sequence of Termination 3, the first and last phases corresponding to 415
weak monsoon intervals. A parallel is proposed between the intermediate phase and the slight 416
Antarctic cooling between the two Antarctic warming phases III-a and III-b displayed on Figure 2. The 417
bipolar seesaw mechanism is expected to synchronize Greenland stadials with Southern ocean and 418
Antarctic warming (Blunier and Brook 2001; Stocker and Johnsen 2003; EPICA Community members, 419
2006; Barker et al., 2009; Landais et al., 2015; Pedro et al., 2018). Within the chronological 420
uncertainties of AICC2012 and age models of other archives (larger than 2 ka each), we follow Cheng 421
et al. (2009) and propose that the Antarctic warming during phase III-a of Termination 3 coincides with 422
the Heinrich-like event at 250 ka and WMI-III-a, and the Antarctic warming during phase III-b of 423
Termination 3 corresponds to the Heinrich like event at 245 ka and WMI-III-b. To keep coherency with 424
the notation first introduced by Cheng et al. (2009), we thus refer to T III-a and T III-b for the two 425
Antarctic warming phases over Termination 3, these warming phases corresponding very likely to WMI 426
III-a and WMI III-b. 427
428
4-2- The sequence of Termination 3 on a coherent chronology using ice core proxies 429
430
A way to circumvent the chronological issue between Antarctic records and lower latitude records 431
and to confirm the hypothesis proposed above and by Cheng et al. (2009) is to make a direct 432
comparison between the high latitude proxies (15N, T
site, D) and low latitude proxies (18Oatm, CH4 as
19 indirect tracers of the low latitude cycle, see below) all measured on the same EDC ice core. There is 434
thus no relative chronology uncertainty between the records except the maximum 1 ka uncertainty 435
(inferred from AICC2012) between records displayed on the gas timescale (15N, 18O
atm, CH4) and
436
those displayed on the ice timescale (D, Tsite). The 18Oatm signal shares many similarities with East
437
Asian 18O
calcite records at both orbital and millennial timescales (Wang et al., 2008; Severinghaus et
438
al., 2009; Extier et al., 2018) because it is directly influenced by the low latitude meteoric water 18O
439
signal transmitted to the atmosphere through photosynthesis (e.g. Bender et al., 1994; Landais et al., 440
2010; Seltzer et al., 2017). Moreover, Reutenauer et al. (2015) used a model approach to show that 441
Heinrich events are associated with synchronous millennial variability of both 18O
calcite in East Asia and
442
18O
atm. CH4 can also provide information of low latitudes climate of the Northern Hemisphere since
443
the main CH4 sources are located in wetlands of the low latitudes during glacial periods (Brook et al.,
444
2000). Still, high latitudes of the Northern Hemisphere may strongly contribute to the CH4 atmospheric
445
signal especially when the high latitude continental areas are free of ice in warm periods (Yu et al., 446
2013). 447
18O
atm shows two increases over phases T III-a and T III-b (Figure 5). An interruption (18Oatm
448
decrease) is observed between the two phases, i.e. in phase with the slight decrease in Tsite and 15N.
449
This interruption at ~248 ka, also observed in the 18O
calcite and associated with the strengthening of
450
the East Asian Monsoon, could be linked to an Antarctic Cold Reversal as already observed over the 451
last deglaciation (Zhang et al., 2016) and suggested by Cheng et al. (2009). The correspondence 452
between 15N and 18O
atm is free from any chronological uncertainty since they are measured on
453
exactly the same air samples. This record hence supports a synchronicity between cold events in the 454
Northern Hemisphere (associated with Heinrich events and WMI) and warming in Antarctica over 455
phases T III-a and T III-b. 456
The CH4 record is of relatively low resolution (400 years) and probably bears a significant influence
457
of the high latitude Northern Hemisphere during deglaciations. Still, it shows a clear increase over 458
phase T III-a peaking at 250 ka before a low level over phase T III-b. This increase is difficult to link to a 459
20 warming of the high latitudes since it corresponds to a minimum of summer insolation at 65°N (despite 460
high obliquity). Another possible interpretation of this signal is to link it to millennial-scale variability. 461
A previous study performed over the last climatic cycle and last deglaciation showed that a CH4
462
increase of several tenths of ppb is observed at the time of iceberg discharge in the North Atlantic in 463
relationship with a shift of the tropical rain belts (Rhodes et al., 2015). The occurrence of a Heinrich 464
event and associated WMI over phase T III-a may hence explain this early CH4 peak. The main increase
465
of CH4 then occurs at the end of phase T III-b similarly to what is observed for the other deglaciations
466
(Figures 1 and 5). 467
Our new measurements hence permit to refine the sequence of events for Termination 3 468
including Antarctica without relative chronological uncertainty. During phase T III-a occurring during a 469
minimum of the summer insolation at 65°N, Heinrich like events are associated with a southward shift 470
of the Northern Hemisphere polar front and of the tropical rain belts linked with the ITCZ (Intertropical 471
Convergence Zone). This shift is observed in the increases of 18O
atm, East Asia 18Ocalcite and CH4 and is
472
associated with the weak monsoon interval referred as WMI-III-a. Connected to this Northern 473
Hemisphere change through atmospheric and oceanic teleconnections linked to the bipolar seesaw, 474
the Antarctic temperature increases as shown by the Tsite and 15N records. Despite evidences for the
475
Northern Hemisphere vs Antarctica correspondences, our records also show that the sub-millennial 476
variability recorded in the IRD and Chinese 18O
calcite records over phase T III-a (2 IRD peaks, 2 positive
477
18O
calcite excursions, red points in Figure 5) is not seen in the Antarctic records which record only one
478
monotonous temperature increase. 479
Phase T III-b occurs during the rise of 65°N summer insolation and is characterized by a Heinrich 480
like event of larger amplitude, which is also associated with WMI III-b, a southward shift of the ITCZ 481
and of the Northern Hemisphere polar front. In a context of high Northern Hemisphere insolation and 482
similarly to other deglaciations in the same insolation context (e.g. the most recent and well dated 483
Terminations 1 and 2, cf Figure 1), the Antarctic temperature increases faster than during phase T III-484
a. 485
21 Finally, the sequence of events over Termination 3 can be compared with the sequences observed 486
on Termination 1 and Termination 2 where dating constraints are strong enough (Figure 5). In 487
particular, Figure 5 shows that we systematically have parallel increase of 15N, T
site and Tsource at Dome
488
C over the one or two Antarctic warming phases of the terminations. These warming phases are also 489
systematically associated with IRD peaks as well as increasing phases in the 18O
calcite and 18Oatm. The
490
Antarctic warmings during the last 3 deglaciations are thus systematically correlated with the 491
occurrence of WMI and iceberg discharges in the North Atlantic, hence a southward shift of the ITCZ. 492
However, the peculiarity of Termination III is the fact that the warming over phase T III-a occurs during 493
a minimum in June 21st insolation at 65°N while all Antarctic warming phases occur during a phase of
494
increase in the June 21st insolation at 65°N. This may explain why phase T III-a is associated with a much
495
smaller D and Tsite increase than phase TI-a. The occurrence of phase T III-a of Termination 3 in a
496
context of low summer insolation at 65°N hence appears as an anomaly and suggests that other factors 497
than the increase in summer insolation in the Northern Hemisphere may play a role in the triggering 498
of the deglaciation in Antarctica. These factors may be local insolation (i.e. Southern Hemisphere 499
summer insolation) or occurrence of millennial scale variability related to changes in the ITCZ locations. 500
501
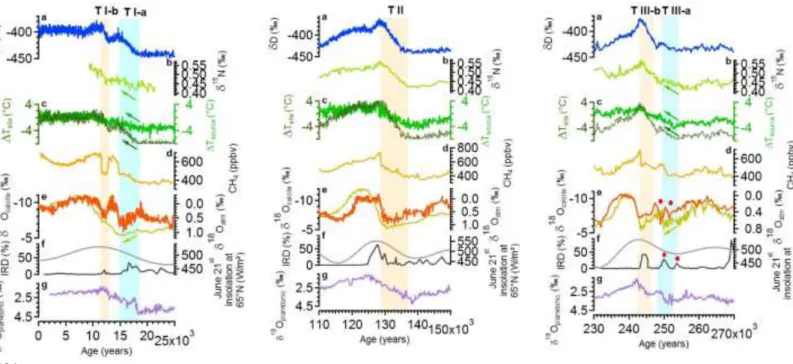
Figure 5: Millennial variability during the Terminations 1 (left), 2 (middle) and 3 (right). a: EDC D record (Jouzel
502
et al., 2007). b: measured EDC 15N (Dreyfus et al., 2010; Landais et al., 2013; this study). c: EDC Tsite (dark
22
green) and Tsource (green) reconstructions. d: EDC CH4 (Loulergue et al., 2008). e: 18Ocalcite from East Asian
504
speleothems in red (Cheng et al., 2016) and EDC 18Oatm in yellow (Extier et al., 2018). f: IRD percentage from site
505
ODP980 in black (McManus et al., 1999) and June 21st insolation at 65°N in grey (Laskar et al., 2004). g:
506
18Oplanktonic of core MD97-2120 (Pahnke et al., 2003). All ice core data are presented on the AICC2012 timescale,
507
the age estimate in AICC2012 between the gas and ice timescales being in excellent agreement (maximum
508
difference of 400 years) with the age obtained with the IGE firnification model presented here.
509 510
5- Conclusions and perspectives 511
512
We presented a high resolution record of 15N over Termination 3 on the Dome C ice core together
513
with a reconstruction of Tsite and Tsource from the combination of D and d-excess on the same ice core.
514
15N and T
site display early increases as soon as 256 and 253 ka while the D record is mostly stable
515
until 251 ka. Based on a thorough data – firn model comparison, we demonstrated that impurity 516
concentration does not influence the 15N signal over Termination 3 and that the major part of the
517
15N increase from 256 ka to the end of Termination 3 should better be related (directly or indirectly
518
through accumulation) to local temperature. It follows from this multiproxy analysis that the Antarctic 519
temperature increase over the first phase of Termination 3 is stronger than inferred from D only. 520
Using a comparison with other climatic archives as well as indication for the timing of Weak 521
Monsoon Intervals in the EDC ice core and change in the low latitude water cycle through the 18O atm
522
proxy, we confirm a sequence of events suggested by Cheng et al. (2009): the two phases of Antarctic 523
temperature increase over Termination 3 are related to Heinrich like events with a bipolar seesaw 524
mechanism at play. The first phase occurs during a minimum of summer Northern Hemisphere 525
insolation with the bipolar seesaw associated with Heinrich like events being the major explanation 526
for Antarctic temperature increase while the second phase is associated with both Heinrich like event 527
and increase in summer Northern Hemisphere insolation. This contrasts with the two younger 528
terminations when the first Antarctic warming phase is in phase with increased in summer insolation 529
at 65°N. 530
This study confirms that using D from the EDC ice core for reconstructing temperature evolution 531
should be done carefully. Indeed, millennial scale events can induce synchronous cooling of source and 532
23 site temperatures resulting in a stable D. Multiproxy studies like the one performed here are thus 533
desirable and should be applied to other terminations such as Termination 4 associated with a strong 534
millennial variability at the end of MIS 10. This study opens perspective for deciphering the role of 535
orbital forcing and millennial variability in the onset and amplitude of a deglaciation. 536
537
Acknowledgments 538
539
The research leading to these results has received funding from the European Research Council 540
under the European Union’s Seventh Framework Programme (FP7/2007-2013) / RC agreement 541
number 306045. It was also received funding from INSU/CNRS LEFE project NEVE-CLIMAT. Finally, this 542
work is a contribution to the European Project for Ice Coring in Antarctica (EPICA). 543
544 545
Supplementary Online Material 546
547
548
SOM - Figure S1: Comparison of the D (grey) and Tsite reconstructions for 3 deep ice cores in East Antarctica.
549 550 551
24 552
25 554
Correlation Dome F D Dome F Tsite EDC D EDC Tsite Vostok D Vostok Tsite
Dome F D 1 0.95 0.90 0.86 0.89 0.86 Dome F Tsite 0.95 1 0.89 0.89 0.86 0.89 EDC D 0.90 0.89 1 0.92 0.89 0.89 EDC Tsite 0.86 0.89 0.92 1 0.84 0.90 Vostok D 0.89 0.86 0.89 0.84 1 0.91 Vostok Tsite 0.86 0.89 0.89 0.90 0.91 1 555
SOM - Table T1: Correlation between D and Tsite over the last 300 ka for Dome F, EDC and Vostok ice cores.
556 557 558
559
SOM - Figure S2: Variations of 15N, Ca2+ concentration (Lambert et al., 2012), Tsite and accumulation rate (red
560
from water isotopes as in Parrenin et al., 2007; orange from AICC2012) on the EDC ice core. The grey error bars
561
show the uncertainty associated with accumulation rate reconstruction in AICC2012 for the glacial and
562
interglacial periods delimiting Termination 3.
563 564
26 565
SOM - Figure S3: Comparison of measured (green) and modeled (IGE model of Bréant et al., 2017, including all 566
dust, accumulation and temperature forcings, dashed black line) 15N over the last 800 ka at Dome C.
567 568
References 569
570
Barker, S., Diz, P., Vautravers, M.J., Pike, J., Knorr, G., Hall, I.R., Broecker, W.S., 2009. Interhemispheric 571
Atlantic seesaw response during the last deglaciation. Nature 457, 1097–1102. 572
Bazin, L., Landais, A., Lemieux-Dudon, B., Toyé Mahamadou Kele, H., Veres, D., Parrenin, F., Martinerie, 573
P., Ritz, C., Capron, E., Lipenkov, V., Loutre, M.-F., Raynaud, D., Vinther, B., Svensson, A., 574
Rasmussen, S.O., Severinghaus, M., Blunier, T., Leuenberger, M., Fischer, H., Masson-Delmotte, 575
V., Chappellaz, J., Wolff, E., 2013. An optimized multi-proxy, multi-site Antarctic ice and gas orbital 576
chronology (AICC2012): 120-800 ka. Clim. Past 9, 1715–1731. 577
Bender, M.L., Sowers, T., Labeyrie, L., 1994. The Dole effect and its variations during the last 130,000 578
years as measured in the Vostok ice core. Global Biogeochem. Cycles 8, 363–376. 579
Bereiter, B., Eggleston, S., Schmitt, J., Nehrbass-Ahles, C., Stocker, T. F., Fischer, H., Kipfstuhl, S., 580
Chappellaz, J., 2015. Revision of the EPICA Dome C CO2 record from 800 to 600 kyr before present.
581
Geophysical Research Letters 42, 542–549. 582
Bernache-Assollant, D., 2005. Frittage : aspects physico-chimiques Partie 2 : frittage en phase liquide. 583
27 Bintanja, R., van de Wal, R.S.W., Oerlemans, J., 2005. Modelled atmospheric temperatures and global 584
sea levels over the past million years. Nature 437, 125–128. 585
Blunier, T. and Brook, E.J., 2001. Timing of millennial-scale climate change in Antarctica and Greenland 586
during the last glacial period. Science 291 (5501), 109–112. 587
Bréant, C., Martinerie, P., Orsi, A., Laurent, A., Landais, A., 2017. Modelling firn thickness evolution 588
during the last deglaciation: constraints on sensitivity to temperature and impurities. Clim. Past 589
13(7), 833–853. 590
Brook, E.J., Harder, S., Severinghaus, J., Steig, E.J., Sucher, C.M., 2000. On the origin and timing of rapid 591
changes in atmospheric methane during the Last Glacial Period. Global Biogeochemical Cycles 14 592
(2), 559–572. 593
Caillon, N., Severinghaus, J.P., Jouzel, J., Barnola, J.M., Kang, J., Lipenkov, V.Y., 2003. Timing of 594
atmospheric CO2 and Antarctic temperature changes across Termination III. Science 299, 1728–
595
1731. 596
Capron, E., Landais, A., Lemieux-Dudon, B., Schilt, A., Masson-Delmotte, V., Buiron, D., Chappellaz, J., 597
Dahl-Jensen, D., Johnsen, S., Leuenberger, M., Loulergue, L., Oerter, H., 2010. Synchronising EDML 598
and NorthGRIP ice cores using 18O of atmospheric oxygen (18O
atm) and CH4 measurements over
599
MIS5 (80–123 kyr). Quat. Sci. Rev. 29, 222–234. 600
Capron, E., Landais, A., Buiron, D., Cauquoin, A., Chappellaz, J., Debret, M., Jouzel, J., Leuenberger, M., 601
Martinerie, P., Masson- Delmotte, V., Mulvaney, R., Parrenin, F., Prié, F., 2013. Glacial–interglacial 602
dynamics of Antarctic firn columns: comparison between simulations and ice core air-δ15N
603
measurements. Clim. Past 9, 983–999. 604
Ciais, P. and Jouzel, J. 1994. Deuterium and oxygen 18 in precipitation: Isotopic model, including mixed 605
cloud processes. Journal of Geophysical Research: Atmospheres 99, 16793-16803 606
Cheng, H., Edwards, R. L., Broecker, W. S., Denton, G. H., Kong, X., Wang, Y., . . . Wang, X. (2009). Ice 607
Age Terminations. Science, 326(5950), 248-252. doi:10.1126/science.1177840 608
28 Cheng, H., Edwards, R.L., Sinha, A., Spötl, C., Yi, L., Chen, S., Kelly, M., Kathayat, G., Wang, X., Li, X., 609
Kong, X., Wang, Y., Ning, Y., Zhang, H., 2016. The Asian monsoon over the past 640,000 years and 610
ice age terminations. Nature 534, 640–646. 611
Chiang, J.C.H., Bitz, C.M., 2005. Influence of high latitude ice cover on the marine Intertropical 612
Convergence Zone. Clim. Dyn. 25, 477–496. 613
Denton, G.H., Anderson, R.F., Toggweiler, J.R., Edwards, R.L., Schaefer, J.M., Putnam, A.E., 2010. The 614
last glacial termination. Science 328, 1652–1656. 615
Dreyfus, G.B., Jouzel, J., Bender, M.L., Landais, A., Masson-Delmotte, V., Leuenberger, M., 2010. Firn 616
processes and 15N: potential for a gas-phase climate proxy. Quat. Sci. Rev. 29, 28–42.
617
Dütsch, M., Pfahl, S., Sodemann, H., 2017. The impact of nonequilibrium and equilibrium fractionation 618
on two different deuterium excess definitions. Journal of Geophysical Research: Atmospheres 619
122, 12732–12746. 620
EPICA Community Members, 2004. Eight glacial cycles from an Antarctic ice core. Nature 429, 623– 621
628. 622
EPICA Community Members, 2006. One-to-one coupling of glacial climate variability in Greenland and 623
Antarctica. Nature 444, 195–198. 624
Extier, T., Landais, A., Bréant, C., Prié, F., Bazin, L., Dreyfus, G., Roche, D.M., Leuenberger, M., 2018. On 625
the use of δ18O
atm for ice core dating. Quat. Sci. Rev. 185, 244-257.
626
Fudge, T.J., Markle, B.R., Cuffey, K.M., Buizert, C., Taylor, K.C., Steig, E.J., Waddington, E.D., Conway, 627
H., Koutnik, M., 2016. Variable relationship between accumulation and temperature in West 628
Antarctica for the past 31,000 years. Geophys. Res. Lett. 43, 3795-3803. 629
Freitag, J., Kipfstuhl, S., Laepple, T., Wilhelms, F., 2013. Impurity-controlled densification: a new model 630
for stratified polar firn. Journal of Glaciology 59 (218), 1163–1169. 631
Gat, J.R., Matsui, E., 1991. Atmospheric water balance in the Amazon basin: an isotopic 632
evapotranspiration model. J. Geophys. Res. 96, 13179–13188. 633
29 Grachev, A.M. Severinghaus, J.P., 2003. Determining the thermal diffusion factor for Ar-40/Ar-36 in air 634
to aid paleoreconstruction of abrupt climate change. J. Phys. Chem. 107, 4636–4642. 635
Hodell, D.A., Channell, J.E.T., Curtis, J.H., Romero, O.E., Röhl, U., 2008. Onset of “Hudson Strait” 636
Heinrich events in the eastern North Atlantic at the end of the middle Pleistocene transition (∼640 637
ka)? Paleoceanography 23, PA4218. 638
Hörhold, M.W., Laepple, T., Freitag, J., Bigler, M., Fischer, H., Kipfstuhl, S., 2012. On the impact of 639
impurities on the densification of polar firn. Earth Planet. Sc. Lett. 325, 93–99. 640
Huybers, P., 2007. Glacial variability over the last two million years: an extended depth-derived 641
agemodel, continuous obliquity pacing, and the Pleistocene progression. Quat. Sci. Rev. 26(1-2), 642
37–55. 643
Jiang, X., Kong, X., Wang, Y., Cheng, H., Wu, J., & Chen, S., 2010. Orbital-and millennial-scale variability 644
of the Asian monsoon during MIS8 from Sanbao Cave at Mount Shennongjia, central China. 645
Chinese science bulletin 55 (11), 1041–1046. 646
Jouzel, J., and Merlivat, L., 1984. Deuterium and oxygen-18 in precipitation: Modeling of the isotopic 647
effects during snow formation. J. Geophys. Res. 89 (D7), 11749–11757. 648
Jouzel, J., Vimeux, F., Caillon, N., Delaygue, G., Hoffmann, G., Masson-Delmotte, V., Parrenin, F., 2003. 649
Magnitude of isotope/temperature scaling for interpretation of central Antarctic ice cores. J. 650
Geophys. Res. 108 (D12), 4361. 651
Jouzel, J., Masson-Delmotte, V., Cattani, O., Dreyfus, G., Falourd, S., Hoffmann, G., Minster, B., Nouet, 652
J., Barnola, J.M., Chappellaz, J., Fischer, H., Gallet, J.C., Johnsen, S., Leuenberger, M., Loulergue, 653
L., Luethi, D., Oerter, H., Parrenin, F., Raisbeck, G., Raynaud, D., Schilt, A., Schwander, J., Selmo, 654
E., Souchez, R., Spahni, R., Stauffer, B., Steffensen, J.P., Stenni, B., Stocker, T.F., Tison, J.L., Werner, 655
M., Wolff, E.W., 2007. Orbital and millennial Antarctic climate variability over the past 800,000 656
years. Science 317, 793–796. 657
Lambert, F., Bigler, M., Steffensen, J.P., Hutterli, M., Fischer, H., 2012. Centennial mineral dust 658
variability in high-resolution ice core data from Dome C, Antarctica. Clim. Past 8, 609–623. 659
30 Landais, A., Barnola, J. M., Kawamura, K., Caillon, N., Delmotte, M., Van Ommen, T., Dreyfus, G., Jouzel, 660
J., Masson-Delmotte, V., Minster, B., Freitag, J., Leuenberger, M., Schwander, J., Huber, C., 661
Etheridge, D., Morgan, V., 2006. Firn-air δ15N in modern polar sites and glacial–interglacial ice: a
662
model-data mismatch during glacial periods in Antarctica? Quat. Sci. Rev. 25, 49–62. 663
Landais, A., Dreyfus, G., Capron, E., Masson-Delmotte, V., Sanchez-Goñi, M.F., Desprat, S., Hoffmann, 664
G., Jouzel, J., Leuenberger, M., Johnsen, S., 2010. What drives the millennial and orbital variations 665
of δ18O
atm? Quat. Sci. Rev. 29, 235–246.
666
Landais, A., Dreyfus, G., Capron, E., Jouzel, J., Masson-Delmotte, V., Roche, D.M., Prié, F., Caillon, N., 667
Chappellaz, J., Leuenberger, M., Lourantou, A., Parrenin, F., Raynaud, D., Teste, G., 2013. Two-668
phase change in CO2, Antarctic temperature and global climate during Termination II. Nat. Geosci.
669
6, 1062–1065. 670
Landais, A., Masson-Delmotte, V., Stenni, B., Selmo, E., Roche, D.M., Jouzel, J., Lambert, F., Guillevic, 671
M., Bazin, L., Arzel, O., Vinther, B., Gkinis, V., Popp, T., 2015. A review of the bipolar seesaw from 672
synchronized and high resolution ice core water stable isotope records from Greenland and East 673
Antarctica. Quat. Sci. Rev. 114, 18–32. 674
Laskar, J., Robutel, P., Joutel, F., Gastineau, M., Correia, A.C.M., Levrard, B., 2004. A long-term 675
numerical solution for the insolation quantities of the Earth. Astron. Astrophys 428, 261–285. 676
Loulergue, L., Schilt, A., Spahni, R., Masson-Delmotte, V., Blunier, T., Lemieux, B., Barnola, J.-M., 677
Raynaud, D., Stocker, T.F., Chappellaz, J., 2008. Orbital and millennial-scale features of 678
atmospheric CH4 over the past 800,000 years. Nature 453, 383–386.
679
Lüthi, D., Le Floch, M., Bereiter, B., Blunier, T., Barnola, J.-M., Siegenthaler, U., Raynaud, D., Jouzel, J., 680
Fischer, H., Kawamura, K., Stocker, T.F., 2008. High-resolution carbon dioxide concentration 681
record 650,000–800,000 years before present. Nature 453, 379–382. 682
Markle, B.R., Steig, E.J., Buizert, C., Schoenemann, S.W., Bitz, C.M., Fudge, T.J., Pedro, J.B., Ding, Q., 683
Jones, T.R., White, J.W.C, Todd, S., 2016. Global atmospheric teleconnections during Dansgaard-684
Oeschger events. Nat. Geosci. 10, 36–40. 685