Received: 18 April 2006/Revised version: 17 May 2006 Published online: 29 June 2006 • © Springer-Verlag 2006
ABSTRACTA photoacoustic sensor using a laser diode emit-ting near 1532 nm in combination with an erbium-doped fibre amplifier has been developed for ammonia trace gas analysis at atmospheric pressure. NH3concentration measurements down to 6 ppb and a noise-equivalent detection limit below 3 ppb in dry air are demonstrated. Two wavelength-modulation schemes with 1 f and 2 f detection using a lock-in amplifier were in-vestigated and compared to maximise the signal-to-noise ratio. A quantitative analysis of CO2and H2O interference with NH3 is presented. Typical concentrations present in ambient air of 400 ppm CO2and 1.15% H2O (50% relative humidity at 20◦C) result in a NH3equivalent concentration of 36 ppb and 100 ppb, respectively.
PACS42.62.Fi; 43.35.Ud; 42.55.Px
1 Introduction
Sensitive and continuous ammonia (NH3) monitor-ing is relevant in various applications, such as DeNOx pro-cesses widely used in power plants and incinerators to reduce NOxemissions [1], process control in the semiconductor in-dustry, where extremely low levels of NH3 in clean rooms may drastically deteriorate the performances of the lithog-raphy process [2], environment monitoring to quantify NH3 emissions from animal production facilities and automobile traffic [3, 4], or in medicine to analyse breath NH3levels as a diagnostic tool [5]. Whereas detection limits in the parts-per-million (ppm) or sub-ppm range are sufficient for some of these applications (i.e., DeNOxprocess), most of them require much better performances at parts-per-billions (ppb) level.
Laser photoacoustic spectroscopy (PAS) is a widely recognised method for its excellent performance in trace gas measurements from ppm down to ppb levels. This technique provides many advantages such as high selectivity and sen-sitivity, on-line, real time and contactless measurements in a compact experimental arrangement. Since the sensitivity of this technique scales with optical power, high power lasers are generally required for high sensitivity. Semiconductor dis-tributed feedback lasers emit typical powers of several tens u Fax: +41-21-693 2614, E-mail: jean-philippe.besson@epfl.ch
of milliwatts enabling sensitivities in the sub-ppm range for many species [6, 7], including ammonia [8]. Better detection limits down to ppb level require higher output power gener-ally achieved using gas lasers (CO and CO2lasers). However, the use of fibre amplifiers combined with standard telecom diode lasers is an attractive alternative to these cumbersome gas lasers to improve the detection limits towards ppb levels. The first use of an erbium-doped fibre amplifier (EDFA) in combination with PAS was reported by Webber et al. in 2003 for NH3detection [9]. Even if these authors reported a detec-tion limit of a few ppb of NH3, this was extrapolated from higher concentration and no real measurement below 100 ppb is shown. Monitoring ammonia at sub-ppm level is a challeng-ing task due to the sticky nature of this polar molecule and the related adsorption–desorption problems [10, 11]. The work reported here aims at presenting ammonia measurements at atmospheric pressure down to a concentration of a few ppb in dry air (80% nitrogen, 20% oxygen) and at evaluating car-bon dioxide (CO2) and water vapour (H2O) interferences in typical atmospheric conditions.
2 Sensor design
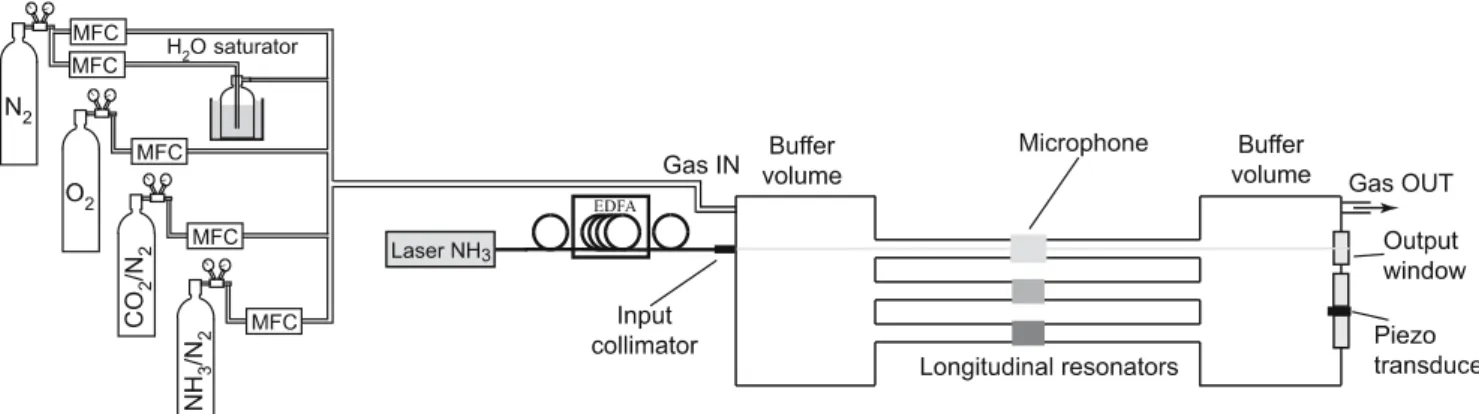
The photoacoustic (PA) sensor is based on reso-nant PAS in combination with a laser diode emitting near 1532 nm. The PA cell consists of three acoustic resonators, offering the possibility of measuring up to three gases simul-taneously using three lasers (Fig. 1). For NH3measurements, only one resonator with the corresponding laser diode was used, whereas the two other lasers were not connected. The resonator oscillates in its first longitudinal mode at a fre-quency of 970 Hz in air. A quality factor Q of 20 was obtained in this condition. The PA signal was generated by wavelength-modulation of the laser through a wavelength-modulation of the injection current. It was detected using a sensitive electret microphone placed in the centre of the resonant cavity where the maximum of the acoustic wave occurs. The PA signal was amplified and measured using a lock-in amplifier with a time constant usu-ally set to 10 s. The PA signals were demodulated at the mod-ulation frequency (1 f detection) or at twice the modmod-ulation frequency (2 f detection) [12]. These two techniques were investigated and compared to determine the optimal configu-ration to achieve the minimum detection limit (see Sect. 3.1).
FIGURE 1 Scheme of the experimental set-up including the PA sensor, the erbium-doped fibre amplifier and the gas handling system. Current-modulated light from the DFB laser is amplified and launched into the resonator through a fibre collimator. Mass-flow controllers (MFC) are used to prepare varying low concentrations of NH3in dry air (80% N2–20% O2). CO2and water vapour (generated by a N2flow through a H2O saturator) can be added to the mixture to
study the interference of these species
The pigtailed DFB laser connected to a fibered collima-tor is directly mounted on the outer flange of the cell and is aligned along the axis of the resonator. The diode laser is op-erated in wavelength-modulation mode at either the frequency of the first longitudinal mode of the PA cell (1 f demodu-lation) or at half of the PA cell’s resonant frequency (2 f demodulation). The temperature- and current-tuning coeffi-cients are−13.9 GHz/◦Cand−0.85 GHz/mA. This fibered configuration allows an easy insertion of the EDFA to boost the optical power launched into the PA cell. The optical ampli-fier was operated in the saturation regime and delivered about 750 mWof amplified power at 1531.67 nm from the 18.5 mW laser, thus providing a 16 dB gain to the laser optical power. The total power of the EDFA including spontaneous emission was about 1 W. Additional details on the sensor can be found in [7, 13].
The gas handling system was composed of a certified mix-ture containing 100 ppm of NH3buffered in nitrogen (N2). N2
and oxygen (O2) cylinders were used for dilution and a
cer-tified mixture of 5000 ppm of CO2was used for quantitative
interference measurements. H2Ointerference was also
inves-tigated by passing part of the flow through a saturator which consists in a water-filled glass cuvette placed in a thermo-stat bath (see Fig. 1). The flow exiting the cuvette was satu-rated in water vapour and the humidity was only dependent on the bath temperature. Dilutions were obtained with mass-flow controllers with a total mass-flow of 1000 sccm (standard cubic centimetre per minute) in the PA cell. This flow reduces the adsorption–desorption process of ammonia in the PA cell and ensures a fast response time of the sensor without adding any extra acoustic noise. However, low NH3 concentrations
ob-tained with mass-flow controllers are approximative because of the adsorption–desorption processes.
The actual NH3concentrations in the gas stream after the
gas mixing system and ahead of the PA cell are measured with an Omnisens TGA300Series trace gas analyzer. The analyzer is based on resonant PAS in combination with a high power CO2 laser. Calibration of the instrument has been validated
by using continuous gas generator, based on the dynamic evaporation of an aqueous ammonia solution into a contin-uous N2 gas stream while being cross-checked with the
im-pinger method (ion chromatography) [14]. The analyzer
fea-tures online measurements at relatively high flow rates of up to 5 l/min and short response times. Its wide measurement range (0.1 ppb–6 ppm) and linearity of r2> 0.9998 over the
measurement range, low detection limit (0.1 ppb) and demon-strated accuracy (0.25 ppb or 1%) makes this analyzer a ref-erence ammonia sensor in the industry and is being used for contamination monitoring in the semiconductor industry and for atmospheric pollution and air quality monitoring appli-cations [14]. The analyser calibration accuracy together with its measurement linearity and range enables precise measure-ments even at low ppb level and was used throughout the tests as a reference.
3 Results and discussion 3.1 Performance of the sensor
In order to quantify adsorption–desorption pro-cesses in the system, the sensor response time was investi-gated. The response time of the sensor was first measured at high ammonia concentration (at ppm level) and then in the ppb range. A concentration step from 1 ppm down to 0.5 ppm at 1000 sccm was applied to the sensor and an exponential fit was used to precisely determine the time decay constant. By considering 95% of gas renewal (1− 1/e3), the response
time was equal to 95 s. The same process was then applied at low concentration (step from 40 ppb to 20 ppb NH3) and a
re-sponse time of about 6 min was obtained. This decay time was compared with the TGA reference instrument and was found to be 85 s. The difference between the two instruments is prin-cipally due to the quality of the coating deposited on the inner surface of the PA cell. In addition, the coating deposition in-side the resonators and in a short 6 mm stainless steel tube at the inlet of the PA cell could not be properly applied for tech-nical reasons.
Two modulation schemes were investigated in order to achieve the best minimum detectable concentration. Firstly, wavelength-modulation mode with first-harmonic detection (1 f detection) was investigated. This modulation scheme yields to a PA signal which is proportional to the first deriva-tive of the absorption feature. The principal drawback of 1 f detection is the presence of either window or wall noise which contributes to the PA signal [15]. Window and wall noise are
plitude used to maximise the PA signal.
The detection limit of the PA sensor was determined by measuring NH3dilutions in dry air (80% N2, 20% O2) from
150 ppb down to 6 ppb and by measuring the noise level. Ammonia concentrations were precisely monitored with the commercially available trace gas analyser (TGA) provided by Omnisens SA. NH3 concentrations obtained from
mass-flow controllers differed as much as 30% in comparison with the TGA value (see Table 1), thus proving the importance of a properly calibrated instrument.
Experimental results obtained with 1 f detection with re-spect to NH3 concentration are shown in Fig. 3. The
mini-mum detectable concentration is given by the crossing point between the linear fit and the noise level. In the present con-figuration, the noise level is as high as 20µV (due to wall or window noise), which is about five times higher than the mi-crophone noise level. A concentration of 6 ppb NH3 passed
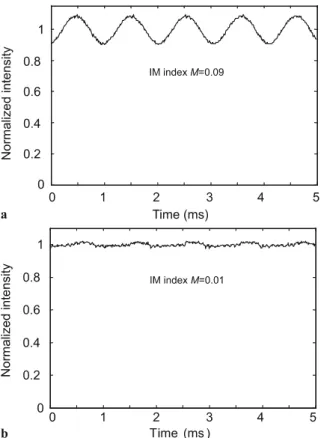
FIGURE 2 Residual intensity modulation of the DFB laser (a) and with the EDFA operated in the saturation regime (b). The signals are normalised to the dc value and the laser modulation frequency is 1 kHz
into the sensor could not be detected. Thus, in this configura-tion, the noise-equivalent detection limit is around 12 ppb.
The detection limit may be significantly improved by re-ducing the noise down to the level of the microphone noise. Since wall noise and window noise result from the residual IM, they mainly occur at the laser modulation frequency and have negligible contribution at higher harmonics. Therefore, a second-harmonic (2 f ) detection scheme was applied to im-prove the sensor performances. For this purpose, a sinusoidal waveform modulation was applied to the laser at half the res-onance frequency. The modulation depth was optimised to maximise the PA signal for NH3 detection. Results are
pre-sented in Fig. 4, which shows the dependance of the PA signal as a function of the modulation depth for NH3and CO2. An
optimal value of 20 mA was obtained. The PA signal demod-ulated at the resonance frequency (2 f ) looks like a second-derivative of the absorption feature.
Results obtained with 2 f detection with respect to NH3
concentration are presented in Fig. 5. High concentrations starting from 90 ppb were diluted to achieve low concentra-tions down to nearly 6 ppb. 6 ppb was the lowest concentration achievable with the available mass-flow controllers. Unfortu-nately, a residual level of a few ppb of ammonia (dot-dashed line in Fig. 5) was very difficult to wash out from the cell and the gas line due to the sticky nature of NH3 and thus
con-tributed to low PA signals. In that case, the sensitivity of the sensor seemed to be limited by this residual level. However,
FIGURE 3 PA signal demodulated at 1 f as a function of ammonia concen-tration. Error bars shown on the plot correspond to one standard deviation of the PA signal recorded in a 5-min period with an integration time of 10 s. The line is the result of a linear fit. The dashed line is the noise level ob-tained by the average over 5 min of the PA signal recorded with N2purge.
FIGURE 4 Amplitude of the NH3and CO2PA signals as a function of the
laser current modulation depth in the case of a sinusoidal waveform with 2 f detection. An optimal modulation depth of 20 mA is determined for the detection of ammonia
FIGURE 5 PA signal demodulated at 2 f as a function of ammonia concen-tration. Error bars shown on the plot correspond to standard deviation of the PA signal recorded in a 5-min period with an integration time of 10 s. The solid lines are the result of linear fits. The dot-dashed line corresponds to the residual level obtained with a N2purge. The dashed line is the system
noise level (average over 5 min, 10 s integration) observed after an inten-sive purge of the sensor with high N2flow saturated with water vapour. The
noise-equivalent detection limit is 2.4 ppb
by carefully purging the PA cell during one night with a high air flow saturated with water vapour, the sensor was properly cleaned and the residual level was reduced to the noise of the microphone integrated over 10 s (dashed line in Fig. 5). This configuration yields to a noise-equivalent detection limit of 2.4 ppb, thus improving the sensitivity by a factor five com-pared to 1 f detection.
3.2 CO2and H2O interference with NH3
In order to identify H2O and CO2 interferences
with NH3, a PA spectrum of these compounds was
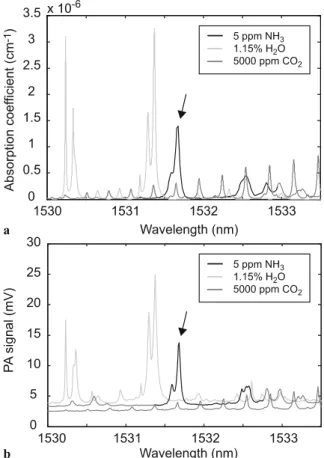
meas-ured at atmospheric pressure using the EDFA and an exter-nal chopper for the modulation of the incident laser beam (Fig. 6b). For this measurement, a mechanical chopper has been preferred to the direct modulation of the laser injection current in order to produce pure IM. In such conditions, the generated PA spectrum is proportional to the gas absorption coefficient, which makes easier the comparison between
ex-FIGURE 6 (a) H2O and CO2 spectra calculated from the HITRAN
database [16] and NH3spectrum obtained from the PNNL database [17] for
concentrations of respectively 1.15%, 5000 ppm and 5 ppm. (b) Correspond-ing PA spectra measured usCorrespond-ing the EDFA and an external chopper for the same compounds concentrations. The arrow shows the selected ammonia line used for measurements
perimental and calculated spectra. Concentrations of 1.15% of H2O(corresponding to 50% of relative humidity at 20◦C),
5000 ppmof CO2and 5 ppm of NH3were used to record each
spectrum separately. The DFB laser diode temperature was tuned to between 5◦C and 40◦Ccovering a spectral range from 1530 nm to 1534 nm. CO2 and H2Ospectra calculated
from HITRAN database [16] and a FTIR NH3spectrum
ob-tained from the PNNL database [17] are presented in Fig. 6a. A good agreement between experimental and databases spec-tra is observed. The strongest NH3 absorption line is
lo-cated at 1531.67 nm where H2Oand CO2also contribute to
the PA signal. Since ammonia detection is performed using a wavelength-modulation scheme in combination with 2 f de-tection, the same scheme was applied to quantify H2Oand
CO2 interferences. A scan of the absorption lines of 1 ppm
NH3, 4000 ppm CO2 and 1.9% H2Oin a balance of dry air
(80% of N2 and 20% of O2) was carried out by tuning the
laser current from 60 mA to 120 mA, corresponding to a fre-quency scan of 51 GHz (see Fig. 7). The output power of the EDFA was considered to be constant over this scan since the amplifier was used in the saturation regime. In order to deter-mine the equivalent NH3concentration due to the contribution
of CO2and H2O, an average value of the corresponding PA
signals measured at the centre of the NH3 line was
deter-mined over 5 min (10 s integration time). Typical CO2 and
FIGURE 7 NH3, CO2and H2O measured spectra at 2 f . Interferences are
calculated by measuring the contribution of CO2and H2O at the centre of
the ammonia feature (0 GHz). Typical concentrations in air of 1.15% of H2O
(50% of relative humidity at 20◦C) and 400 ppm of CO2correspond to an
ammonia equivalent concentration of 36 and 100 ppb. The frequency shift represents the shift to apply on the laser dc current to obtain a 0 contribution of CO2interference
to deduce the interference contribution. Thus, it was deter-mined that 400 ppm of CO2 and 1.15% (50% of relative
hu-midity at 20◦C) correspond to 36 ppb and 100 ppb of NH3at
1531.67 nm, respectively.
These interferences can be reduced by operating the sys-tem at low pressure [9], but operation at atmospheric pressure was nevertheless preferred to maintain a simple configuration. In that case, water vapour contribution can be compensated by measuring the ambient humidity with a commercially avail-able hygrometer or spectroscopically at another wavelength of the laser. In the latter case, an appropriate choice of wave-length, where only water vapour contributes to the absorbed signal, is necessary, for instance atλ = 1530.94 nm. This con-tribution may then be subtracted from the overall signal meas-ured on the NH3line at 1531.67 nm. For CO2interference, the
same procedure may be applied with a different wavelength ofλ = 1532.25 nm. However, a simple and original approach may also be implemented to suppress the interference from ambient CO2. The proposed method takes advantage of the
slight shift between the centre of the NH3and CO2absorption
lines around 1531.67 nm. The main NH3 absorption feature
located at 1531.67 nm (6528.79 cm−1) is made of two close lines that overlap at atmospheric pressure, whereas the cen-tre of the strongest CO2line is shifted by only 0.1 cm−1from
the NH3feature. As a result of this shift and of the different
broadening coefficients of these lines (see Table 2), the zero-crossing point in the 2 f signal of the CO2line is located only −1.19 GHz (−0.04 cm−1) away from the centre of the NH
3
line in our modulation conditions. By operating the laser at this specific wavelength, the CO2contribution to the PA
sig-nal may be efficiently reduced, while keeping a strong sigsig-nal from NH3.
and 4000 ppm CO2 have been calculated using a theoretical
model of the harmonic signals generated in WM-PAS [12]. The laser modulation amplitude has been chosen to maximise the PA signal for NH3at atmospheric pressure as in the
experi-ments, thus corresponding to a modulation index (ratio of the frequency modulation amplitude to the width of the target ab-sorption line) m= 2.2 for NH3. The same modulation depth has been considered for CO2, hence corresponding to a larger
modulation index due to the smaller linewidth of the CO2line.
The effect of the ambient pressure on the CO2and NH3signals
has been considered in order to demonstrate that the proposed CO2-interference reduction scheme is not pressure sensitive.
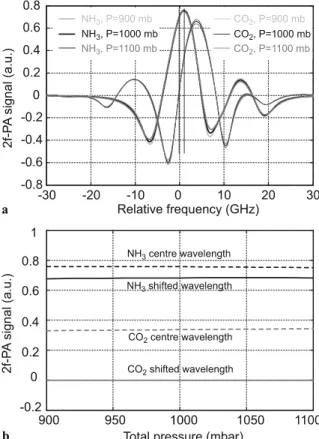
It can be noticed in Fig. 8 that the NH3 signal is reduced by
only 10% when the laser is slightly tuned to the zero-crossing
FIGURE 8 (a) Comparison of the simulated 2 f PA signals for 1 ppm NH3
and 4000 ppm CO2at different pressures. The parameters of the absorption
lines have been taken according to Table 2 and a modulation depth corres-ponding to a modulation index m= 2.2 for NH3at atmospheric pressure has
been considered. (b) Comparison of the NH3signal and CO2interference
ob-tained when the laser is tuned to the centre of the NH3absorption feature
point of the CO22 f signal compared to the maximum signal
achieved at the centre of the NH3 absorption feature. At the
same time, the CO2 interference is reduced by two orders of
magnitude when the laser is slightly frequency shifted to this specific wavelength. The equivalent signal for 4000 ppm of CO2is reduced to 4 ppb NH3over a pressure range of±10%
around atmospheric pressure, thus corresponding to a sub-ppb interference for a typical atmospheric concentration of 400 ppm CO2.
4 Conclusion
A PA gas sensor was developed to monitor ammo-nia at ppb level. Since the power of laser diodes is limited to several tens of mW, a configuration using an optical am-plifier was investigated to reach such extreme sensitivities. In addition, a well-adapted modulation scheme in combina-tion with an optimised PA cell design are essential to achieve the best signal-to-noise ratio. A carefully designed system re-sults in a powerful sensor capable of measuring a few ppb of ammonia. Finally, interferences from H2Oand CO2must be
taken into account to measure NH3 in ambient air. An
ori-ginal method consisting in a wavelength shift of the laser to measure these compounds separately have been proposed to overcome this problem. The robustness of this technique over pressure variations has been validated by simulating 2 f -PA signals from NH3and CO2.
ACKNOWLEDGEMENTS The authors would like to acknow-ledge Omnisens SA for providing the reference ammonia trace gas analyser (TGA300Series).
REFERENCES
1 G. Ramis, L. Yi, G Busca, Catal. Today 28, 373 (1996)
2 S. MacDonald, N. Clecak, R. Wendt, C.G. Willson, C. Snyder, C. Knors, N. Deyoe, J. Maltabes, J. Morrow, A. McGuire, S. Holmes, Proc. SPIE 1466, 2 (1991)
3 D. Marinov, M. Sigrist, Photochem. Photobiol. Sci. 2, 774 (2003) 4 M.E. Webber, T. MacDonald, M.B. Pushkarsky, C.K.N. Patel, Y. Zhao,
N. Marcillac, F.M. Mitloehner, Meas. Sci. Technol. 16, 1547 (2005) 5 L.R. Narasimhan, W. Goodman, C.K.N. Patel, Proc. Nat. Acad. Sci. 98,
4617 (2001)
6 V. Z´eninari, B. Parvitte, D. Courtois, V.A. Kapitanov, Y.N. Ponomarev, Infrared Phys. Technol. 44, 253 (2003)
7 J.-P. Besson, S. Schilt, L. Th´evenaz, Spectrochim. Acta A 63, 899 (2006)
8 A.A. Kosterev, F.K. Tittel, Appl. Opt. 43, 6213 (2004)
9 M.E. Webber, M. Pushkarsky, C.K.N. Patel, Appl. Opt. 42, 2119 (2003)
10 J. Henningsen, N. Melander, Appl. Opt. 36, 7037 (1997) 11 A. Schmohl, A. Miklos, P. Hess, Appl. Opt. 41, 1815 (2002) 12 S. Schilt, L. Th´evenaz, Infrared Phys. Technol. 48, 154 (2006) 13 J.-P. Besson, S. Schilt, L. Th´evenaz, Spectrochim. Acta A 60, 3449
(2004)
14 S. Schilt, L. Th´evenaz, M. Niklès, L. Emmenegger, C. Hüglin, Spec-trochim. Acta A 60, 3259 (2004)
15 C. Brand, A. Winkler, P. Hess, Miklos A., Z. Bozoki, J. Sneider, Appl. Opt. 34, 3257 (1995)
16 L.S. Rothman, D. Jacquemart, A. Barbe, D. Chris Benner, M. Birk, L.R. Brown, M.R. Carleer, C. Chackerian Jr., K. Chance, L.H. Cou-dert, V. Dana, V.M. Devi, J.-M. Flaud, R.R. Gamache, A. Goldman, J.-M. Hartmann, K.W. Jucks, A.G. Maki, J.-Y. Mandin, S.T. Massie, J. Orphal, A. Perrin, C.P. Rinsland, M.A.H. Smith, J. Tennyson, R.N. Tolchenov, R.A. Toth, J. Vander Auwera, P. Varanasi, G. Wagner, J. Quantum Spectrosc. Radiat. Transf. 96, 139 (2005)
17 S.W. Sharpe, T.H. Johnson, R.L. Sams, P.M. Chu, G.C. Rhoderick, P.A. Johnson, Appl. Spectrosc. 58, 1452 (2004)