Clinical Chemistry and Metabolism
Edited by: W. M ä rz
Arnold von Eckardstein *
Laboratory diagnostics of non-alcoholic fatty liver
disease
Abstract: Owing to the high prevalence and associated complications of liver fibrosis, of any etiology, and non-alcoholic fatty liver disease (NAFLD), both have become important public health issues. Liver biopsy is consid-ered the gold standard for diagnosis and staging of liver fibrosis, as well as NAFLD. Recent studies have discov-ered and validated several non-invasive biochemical bio-markers and imaging procedures for the diagnostics of liver fibrosis and NAFLD. In comparison to patented tests (FibroTest ® , Fibrometer ® , and Hepascore ® ), non-patented
tests (APRI, ELFG, FIB-4, Forns Index, and MP3) tend to have a lower diagnostic performance, especially for the diagnosis of significant fibrosis (METAVIR stage F2). The difference in performance is less pronounced for the diag-nosis of cirrhosis (METAVIR stage F4). Elastography is superior to biomarkers in the diagnosis of cirrhosis (F4) but not fibrosis (F2). However, in 20% of patients elastog-raphy cannot be performed or evaluated due to anatomi-cal reasons. Cytokeratin 18 (CK-18) is the most promising single biomarker for the diagnosis of non-alcoholic stea-tohepatitis (NASH). Scores and algorithms have been less extensively validated for their diagnostic performance in diagnosing and staging of NAFLD and NASH as compared with fibrosis in chronic hepatitis. Data are promising. Patented scores as well as CK-18 appear slightly superior to freely available scores including the NAFLD fibrosis score, which is recommended by American guidelines. In conclusion, non-invasive biomarkers and elastography appear promising as prescreening tools to limit the num-ber of liver biopsies.
Keywords: chronic hepatitis; fatty liver diseases; liver fibrosis.
DOI 10.1515/labmed-2014-0026
Received July 8 , 2014 ; accepted July 18 , 2014
Introduction
Liver diseases are characterized by four basic patho-mechanisms, three of which are captured by traditional clinical laboratory parameters: necrosis, cholestasis and metabolic insufficiency. Fibrosis and its most pronounced form, cirrhosis, however, have been impenetrable to non-invasive diagnostics for a long time. With the advancement of therapeutic options, the need for reliable diagnostics of liver fibrosis has increased massively. However, it is dif-ficult to develop biomarkers for the noninvasive staging of liver fibrosis, because it is a component of the normal healing process after injury, infection, and many other etiological factors. For decades, liver biopsy has been the gold standard for the diagnosis and staging of liver fibro-sis, especially since it also allows for the assessment of necrosis, inflammatory activity, and deposits of fat (stea-tosis), iron or copper. In recent years, a number of indirect methods based on laboratory parameters and/or imaging procedures have been developed and validated, but they have been incorporated into clinical practice to varying degrees internationally. The noninvasive methods appear particularly suitable for pre-screening in order to limit the number of liver biopsies [1 – 4] .
The gold standard – liver biopsy
Although considered the gold standard, liver biopsy is subject to significant disadvantages such as limited access, high cost and risk for the patient. Among the complications, pain (85%) and hypotension are the most common; intraperitoneal bleeding (approximately 0.2%) and injury the most severe. The risk of hospitalization after a liver biopsy is 1% – 5%; the mortality approximately 0.01%. Due to fear of these complications, many patients
*Corresponding author: Arnold von Eckardstein, Institut f ü r Klinische Chemie, Universit ä tsspital Z ü rich, R ä mistrasse 100, 8091 Zurich, Switzerland, Phone: 0041 44 255 2260,
Fax: 0041 44 255 45 90, e-mail: [email protected] ; and Institute of Clinical Chemistry, University Hospital Zurich, Zurich, Switzerland
avoid having a liver biopsy performed. In addition, the quality of a liver biopsy is limited by errors in sample col-lection and assessment (inaccuracy) as well as reproduc-ibility (high intra- and inter-observer variability) [4] .
The most commonly used methods for the semiquan-titative scoring of the fibrosis degree are the Ishak and the Metavir scores, which were originally developed to assess chronic hepatitis, and the Brunt score, which was developed for the assessment of non-alcoholic fatty liver disease ( Table 1 ). The most important, quality-limiting factor of these standardized methods is the collection of samples, which causes unreliable staging classifications or, among different pathologists, discrepant staging clas-sifications in one third of the cases. Accordingly, biopsies should be at least 20 – 25 mm and/or have at least 11 portal tracts. Unfortunately, this requirement is met only by approximately half of the biopsies. Another limitation is the non-linear relationship between the degree of fibro-sis and clinical relevance. Thus, the F0 → F1 transition is clinically less relevant than the F2 → F3 transition. For cir-rhosis (F4), there is no sub-differentiation of severity [4] . Taken together, these limitations demonstrate that the gold standard of liver biopsy is not ideal.
Noninvasive methods have several fundamental advantages over liver biopsies. By comparison, they are virtually free of side effects, easier to control in pre-analyt-ical terms, more objective because they are less dependent on the tester, easily repeatable and more cost-effective. However, they match histology only to a limited extent. Furthermore, they are strongly influenced by the specific etiology of the underlying liver disease and other clinical conditions of the patient (e.g., medication).
The limited quality and reliability of the gold standard of liver biopsy means that, in comparative
cross-sectional studies, biomarkers are by definition inferior to a liver biopsy in terms of diagnostic signifi-cance. This dilemma can only be resolved by longitu-dinal studies in which the predictive values of biopsies and biomarkers are compared with respect to clinical endpoints, such as death, portal hypertension or pro-gression/regression of fibrosis in response to alcohol abstinence, virostatic therapy for hepatitis B and C or an improved metabolic situation in connection with non-alcoholic steatohepatitis (NASH).
Biomarkers that are measurable in
the blood
In recent years a number of potential biomarkers of liver fibrosis have been discovered and evaluated in what often amounted to small-scale studies. In principle, the blood markers can be divided into direct and indirect markers: direct markers are molecules which are released from the extracellular matrix, or from stellate cells, e.g., hyal uronic acid or α 2-macroglobulin. Indirect markers are mole-cules that reflect the response of the liver parenchyma to fibrosis: cell death (ALT), cholestasis (bilirubin, γ GT), metabolic insufficiency (INR), and portal hypertension (thrombocytopenia, hypergammaglobulinemia). Direct markers detect the fibrosis at earlier stages, but are less specific, because they are also formed in non-hepatic fibrosis. Therefore, direct and indirect markers are fre-quently combined. Table 2 summarizes the best validated marker combinations.
The diagnostic quality of simple clinical or laboratory findings, independent of etiology, has been examined in
Table 1 Semi-quantitative histological methods for assessing liver fibrosis [4] .
Chronic hepatitis B or C
NAFLD
METAVIR Ishak Brunt
F0 = no fibrosis F0 = no fibrosis F0 = no fibrosis F1 = expanded portal fibrosis F1 = fibrous expansion of some portal areas, with or without fibrous
septa
F1A = mild perisinusoidal fibrosis F2 = periportal fibrosis with
formation of few septa
F1 = fibrous expansion of most portal areas, with or without fibrous septa
F1B = moderate perisinusoidal fibrosis
F3 = extensive bridging F3 = fibrous expansion of most portal areas with occasional portal-portal bridging
F1C = exclusive portal/periportal fibrosis
F4 = cirrhosis F4 = fibrous expansion of most portal areas with extensive portal-portal and portal-portal-central bridging
F2 = both perisinusoidal and portal/periportal fibrosis
F5 = extensive bridging with occasional nodes (incomplete cirrhosis) F3 = Bridging fibrosis
a large meta-analysis of 86 studies that were qualified by the authors as appropriate and that verified liver cir-rhosis by means of biopsies [6] . A total of 19,533 patients were included in the meta-analysis, of whom 4725 suf-fered from cirrhosis diagnosed by biopsies (prevalence: 24%; 95% CI, 20% – 28%). Several findings of physical examinations or simple laboratory tests increase the probability of cirrhosis, that is, the existence of an ascites (likelihood ratio LR = 7.2, 95% CI: 2.9 – 12), a plate-let count < 160 × 10 3 / μ L, (LR = 6.3, 95% CI: 4.3 – 8.3), spider
angiomas (LR = 4.3, 95% CI: 2.4 – 6.2) or the combination of simple laboratory test results, such as a Bonacini cirrhosis discriminant score > 7 (LR = 9.4, 95% CI: 2.6 – 37) or an APRI index > 2 (LR = 4.6, 95% CI: 3.2 – 6.0). For ruling out cirrho-sis, a Lok index < 0.2 (LR = 0.09, 95% CI: 0.03 – 0.31), a plate-let count < 160 × 10 3 / μ L, (LR = 0.29, 95% CI: 0.20 – 0.39) and
the absence of hepatomegaly (LR = 0.37, 95% CI: 0.24 – 0.51) have proved to be the most appropriate characteristics. In total, a physician ’ s overall clinical impression was less informative than the individual or combined medical laboratory findings, particularly in connection with ruling out cirrhosis (positive LR = 4.8, 95% CI, 2.5 – 7.2; negative LR = 0.52, 95% CI, 0.33 – 0.71) [6] .
The biomarkers and the thereof derived algorithms were evaluated particularly for patients with hepatitis B or C, as well as patients with non-alcoholic fatty liver disease (NAFLD). The monitoring of liver disease in patients with hepatitis B or C is important in order to determine the prognosis and indicate antiviral therapies. Overall, the biomarkers are more reliable in the detection of cirrhosis than in the detection of intermediate fibrosis stages [1 – 5] . The most frequently validated tests are APRI (a free, non-patented algorithm that combines the measured variables
AST and platelet count) and FibroTest ® (a patented test,
which is common in France and comprises the measured variables γ GT, haptoglobin, bilirubin, apolipoprotein AI and α 2-macroglobulin).
A meta-analysis of the results of the APRI test on 6259 HCV patients from 33 studies found mean AUROC values of 0.77, and 0.83 for the detection of significant fibrosis or cirrhosis [7] . A meta-analysis of the FibroTest ® test on
3501 patients infected with the hepatitis C virus [HCV], and 1457 patients infected with the hepatitis B virus [HBV] [8] found a standardized AUROC of 0.84 for the diagnosis of significant fibrosis, without any significant difference between HCV (AUROC = 0.85) and HBV (AUROC = 0.80). The proportion of discordant results between the biopsy and FibroTest ® is about 25%. As set forth above, the diagnostic
quality of the biomarkers is also limited by the pre-analyt-ical and analytpre-analyt-ical errors of the biopsy. The developer and provider of FibroTest ® estimates that the discordant results
are caused by biopsy errors and errors of the biomarker test in equal parts. They developed, therefore, the concept of “ risk of false-positive and false-negative results ” (RFPFN) and evaluated their database of nearly 370,000 measure-ment results [9] . In the general population, the RFPN was 0.5% – 1%. It increased to 2% and more in high-risk groups, such as patients from tertiary care centers or HIV centers or in Africans of sub-Saharan origin. Among the laboratory parameters, a low concentration of haptoglobin (0.46%) and a high concentration of apoA-I (0.2%) contributed the most to the RFPFN. Overall, the authors concluded from their data that FibroTest ® could be applied to 99% of all
patients and 97% of high-risk patients.
In a direct comparison study of 913 HCV and 284 HBV patients, the diagnostic qualities of the three patented
Table 2 Combinations of serum biomarkers for the diagnosis of liver fibrosis [5, 6] .
Score Components
APRI AST/platelet ratio
Forn ’ s index Age, platelets, γ GT, cholesterol Bonacini Platelets, AST, ALT, INR GUCI AST, INR, platelets
HALT C Hyaluronic acid, TIMP1, platelets LOK index AST, ALT, INR, platelets
MP3 TIMP1, P3NP
ViraHep Race, age, AST, platelets, alkal. phosphatase FIB-4 AST, ALT, platelets
ELF plus ® Hyaluronic acid, TIMP1, P3NP, BMI, diabetes mellitus type 2/impaired fasting glucose, AST, ALT, platelets, albumin Fibrometer ® Age, weight, fasting plasma glucose, AST, ALT, ferritin, platelets
FibroSpect ® α 2-macroglobulin, hyaluronate, TIMP1
FibroTest ® α 2-macroglobulin, apolipoprotein AI, haptoglobin, bilirubin, γ GT, ALT HepaScore ® Age, sex, α 2-macroglobulin, hyaluronate, TIMP1, γ GT,
tests (FibroTest ® , Fibrometer ® and Hepascore ® ) and the
non-patented APRI test did not differ. The AUROC values ranged between 0.72 and 0.78 for significant fibrosis, and between 0.77 and 0.86 for cirrhosis [10] . In another com-parative study of nine biomarker tests on 436 patients with hepatitis C, the AUROC values in connection with detecting significant fibrosis (F>2) were 0.75 – 0.78 for non-patented tests (hyaluronic acid, Forn ’ s index, APRI, MP3, FIB-4, ELFG) and 0.80 – 0.82 for patented tests (FibroTest ® ,
Fibrometer ® , Hepascore ® ). For the detection of cirrhosis,
the corresponding AUROC ranges were 0.83 – 0.88 and 0.86 – 0.89 [11] .
Almost all models for assessing the quality of clini-cal or histologiclini-cal methods for assessing the severity of fibrosis are based on baseline clinical, laboratory or pathology findings. Since the severity and the clinical and laboratory surrogates of liver disease change over time, dynamic models should yield a better prognostic value. With this hypothesis, two models were developed from the data of the Hepatitis C Long-Term Treatment Against Cirrhosis (HALT-C) study to predict clinical decompensa-tion (model 1) and/or liver transplantadecompensa-tion or hepatogenic death (model 2) [12] . In 470 patients, an algorithm of plate-let count, AST/ALT ratio, bilirubin at baseline, as well as at times of major changes in platelet count and bilirubin and albumin levels, yielded the best prediction of clinical decompensation in 60 patients (model 1). In 483 patients, an algorithm of platelet count and albumin concentration at baseline, as well as the deterioration of the AST/ALT ratio and the decrease in the albumin level were the best predictors of 79 transplantations or liver-related deaths (model 2) [12] .
Imaging methods
The activation of hepatic stellate cells and the formation of the extracellular matrix lead to changes in the microstruc-ture of the liver, which manifest themselves in decreas-ing elasticity and altered blood flow [1 – 4] . The changes in elasticity can be measured noninvasively by means of sonographic elastography (FibroScan ™ ), magnetic reso-nance imaging (MR) or acoustic radiation force impulse (ARFI).
In the case of ultrasound-based transient elastography (Fibroscan ™ ), the elasticity of the hepatic parenchyma is measured by 5 MHz ultrasound, and the initiation of low-frequency elastic waves by means of a special ultra-sonic vibrator. The propagation speed of the pulse-echo waves is measured by means of ultrasound imaging. Since
fibrotic tissue is harder than healthy liver parenchyma, the propagation speed correlates with the degree of fibro-sis. FibroScan ™ has been approved in Europe for clini-cal diagnosis. The method has been evaluated for various liver diseases, such as hepatitis B and C, alcoholic liver disease and NAFLD. Meta-analyses demonstrated the reliability of Fibroscan ™ for the diagnosis of significant fibrosis (F2, AUC = 0.84), severe fibrosis (F3, AUC = 0.89), and cirrhosis (F4, AUC = 0.94). However, the AUC in F2 varied greatly depending on the underlying disease. In the diagnosis of cirrhosis, the FibroScan technology is limited by necrotic activity and inflammation in NAFLD patients. Other quality-limiting factors are the expertise of the phy-sician, the patient ’ s age, the presence of ascites, a body mass index ≥ 28 kg/m 2 and abdominal obesity, as well as
the width of the intercostal spaces. Thus, a large study did not yield any results in 20% of the cases studied [2] .
ARFI combines conventional ultrasound with a local examination of liver elasticity. Overall, the results of FibroScan ™ and ARFI correlate well. In comparison with FibroScan ™ , the limiting influence of anatomical obstacles (e.g., large vessels) or steatosis is minimized for ARFI. Another advantage is the possible integration of the ARFI software with conventional ultrasound devices, thus eliminating the need for the expensive investment of Fibro Scan ™ [2] .
Liver elasticity and changes in water diffusion, which occur in connection with cirrhosis, can be measured by MRI. In magnetic resonance elastography (MRE), the acoustic shear waves propagating through the liver tissue are visualized and quantified directly in three steps: 1) Generation of mechanical waves in the tissue; 2) Imaging of micron level displacements caused by the propagat-ing waves by means of a special MRI technique (oscillat-ing motion-sensitiz(oscillat-ing gradients); and 3) Process(oscillat-ing the wave images using an algorithm that creates quantitative maps of the physical properties of the liver. This is how MRE represents the distribution of connective tissue in the liver. Compared to biopsies, MRE shows a very good match regarding the detection of fibrosis degree: in con-trast to FibroScan ™ , MRE is characterized by the fact that it can capture even the lowest fibrosis degree and that the failure rate is smaller: 94%, instead of 84%, of the tests can be performed. Only very severely obese patients who do not fit into the MRI machine are an obstacle [2] .
In the ANRS HCEP23 study, the diagnostic value of transient elastography (FibroScan ™ ) and nine blood biomarkers was compared in almost 500 patients with chronic hepatitis C: Fibrometer ® , FibroTest ® , Forns index,
APRI, MP3, ELFG, Hepascore ® , Fib4 and hyaluronic acid.
patients, therefore all methods were compared for 382 patients [11] . As for the diagnosis of significant fibrosis, FibroScan ® with an AUROC of 0.82 was not superior to the
patented biomarkers (0.81 for FibroTest ® , 0.82 for
Hepas-core ® and 0.83 for Fibrometer ® ), but it was superior to
the clinical scores (0.74 – 0.78). Elastography performed better than the biomarkers in the detection of cirrhosis [AUROC = 0.93 vs. 0.84 (Fib4) to 0.90 (Fibrometer ® )]. The
authors also calculated the number of biopsies to be avoided by the use of imaging or biomarkers, using as the default the 90% cut-off values for negative and posi-tive predicposi-tive values. The differences between Fibrom-eter ® (36.6%), Fibrotest ® (35.6%), Hepascore ® (30.5%) and
FibroScan (45.8%) were not statistically significant [11] . The non-optimal diagnosis of significant fibrosis by both biomarkers and imaging suggests that the two strate-gies should be combined. In fact, this concept has already been tested in initial studies. In the above-described study of Zarski et al., the combination of elastography and patented biomarkers increased the proportion of correctly classified patients with significant fibrosis (F2) from 70% – 73% to 80% – 83% [11] . In another study involv-ing patients with chronic hepatitis C, 97% of patients were correctly classified by a combination algorithm of FibroTest ® and APRI – theoretically 48% of biopsies could
have been avoided. The combination of elastography and
Fibrotest would have helped to avoid as many as 79% of biopsies [13] . Similar results were found for the combina-tion of elastography and Fibrometer ® [14] .
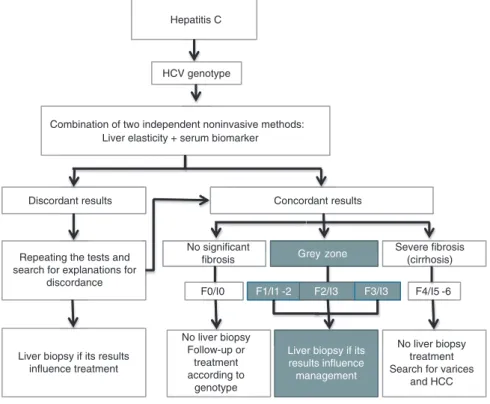
These promising results for the noninvasive diagnosis of fibrosis are reflected in the most recent recommenda-tions of the European Association for the Study of Liver
Dis-eases on Chronic Hepatitis C, which recommend the use
of noninvasive methods for the diagnosis and monitor-ing of fibrosis in connection with chronic hepatitis C [15] . Figure 1 illustrates a clinical path for implementing this concept.
Definitions and epidemiology of
non-alcoholic fatty liver disease
(NAFLD)
The diagnosis of NAFLD requires firstly the detection of steatosis by means of histology or imaging, and secondly the exclusion of causes of secondary fatty liver such as excessive drinking, the taking of steatogenic drugs or hereditary storage diseases ( Table 3 ). NAFLD is divided histologically into NAFL (non-alcoholic steatosis or fatty liver) and NASH (non-alcoholic steatohepatitis or fatty liver hepatitis) ( Table 4 ) [16] .
Grey zone
F1/I1 -2 F2/I3 F3/I3
Liver biopsy if its results influence management
Grey zone
F1/I1 -2 F2/I3 F3/I3
Hepatitis C
HCV genotype
Combination of two independent noninvasive methods: Liver elasticity + serum biomarker
Discordant results Concordant results
Repeating the tests and search for explanations for
discordance
No significant fibrosis
Severe fibrosis (cirrhosis)
Liver biopsy if its results influence treatment F0/I0 F4/I5 -6 No liver biopsy Follow-up or treatment according to genotype No liver biopsy treatment Search for varices
and HCC
Figure 1 Proposal of a clinical path for the use of noninvasive methods for risk and treatment stratification of chronic hepatitis C. F0 – F4 = Metavir stages of fibrosis, I0 – I6 = Ishak stages of fibrosis. Modified from reference [3] .
Frequently, patients with NAFLD are overweight or obese, or suffer from diabetes mellitus and dyslipidemia characterized by hypertriglyceridemia and low HDL cho-lesterol. Accordingly, NAFLD today is considered the hepatic manifestation of the metabolic syndrome. NAFLD occurs frequently with other diseases and symptoms associated with the metabolic syndrome, e.g., polycystic ovary syndrome, sleep apnea syndrome and male hypo-gonadism [16] . The diagnosis is clinically relevant, given the increased risk, due to NAFLD, of the manifestation of diabetes, coronary heart disease, chronic kidney disease, as well as given the progression of NAFLD to cirrhosis and, eventually, liver cancer [16 – 19] .
A diagnosis of NAFLD is becoming increasingly common with the rising prevalence of obesity and the metabolic syndrome. In many countries, NAFLD is con-sidered the most common cause of elevated liver enzyme activities in plasma. However, the epidemiologically docu-mented prevalence of NAFLD varies significantly, depend-ing on the diagnostic methods and criteria used, between
Table 3 Causes of secondary steatosis [16] .
Macrovesicular steatosis – Excessive alcohol consumption – Hepatitis C (genotype 3) – Wilson ’ s disease – Lipodystrophy – Starvation – Parenteral nutrition – Abetalipoproteinemia
– Medication (e.g., amiodarone, methotrexate, tamoxifen, corticosteroids)
Microvesicular steatosis – Reye syndrome
– Medication (valproate, anti-retroviral drugs) – Acute fatty liver of pregnancy
– HELLP syndrome
– Congenital metabolic diseases (e.g., LCAT deficiency, cholesteryl ester storage disease/Wolman disease)
Table 4 Staging of non-alcoholic fatty liver disease (NAFLD) [16] .
– Non-alcoholic fatty liver disease (NAFLD):
Umbrella term for all manifestations (steatosis = NAFL), steatohepatitis (NASH), fibrosis, cirrhosis
– Non-alcoholic fatty liver (steatosis = NAFL):
Fatty liver with no evidence of liver cell necrosis (ballooning) or fibrosis (bridging): Low risk for cirrhosis or liver failure – Non-alcoholic fatty liver hepatitis (steatohepatitis = NASH): Fatty liver with signs of inflammation: Liver cell necrosis
(ballooning) and/or fibrosis (bridging): Increased risk for cirrhosis or liver failure. Hepatocellular carcinoma rather rare
3% and 50%. In two histology studies of live liver donors, the prevalence was 20% and 51%, respectively [20, 21] . A Texas population study of middle-aged people that meas-ured the liver fat by magnetic resonance spectroscopy, but ignored patients ’ alcohol history, showed a prevalence of 31% [22] . In another American study [23] , which cap-tured steatosis sonographically and took alcohol history into account, the prevalence of NAFLD was 46%, of whom almost 30% had NASH (12.2% overall prevalence). In the National Health and Nutrition Examination Survey III (NHANES III), which was conducted between 1988 and 1994, the prevalence of NAFLD among 11,613 subjects was almost 19% (sonographic steatosis with exclusion of chronic alcohol consumption as well as hepatitis B and C). Almost 12% of NAFLD patients, or more than 2% of the total population, had NASH [24] . Within the total popu-lation, NAFLD is associated with sex, age and ethnicity: men are affected more often than women; the probability of advanced stages (NASH, cirrhosis) increases with age, overweight/obesity and the presence of hypertension [24] ; and Hispanic whites are affected more often than non-Hispanic whites, who in turn are affected more frequently than Africans or Native Americans [16, 24] .
The prevalence of NAFLD in at-risk groups is even higher than in the general population. In NHANES III, the prevalence of NAFLD in 7156 overweight or obese individuals was 27.8%, compared to 7.4% among 4457 normal-weight subjects. It is interesting to note that the independent NAFLD predictors differed for the normal-weight and the overnormal-weight: they are younger and more often female and exhibit fewer components of the meta-bolic syndrome [24] . More than 90% of massively obese patients who undergo bariatric surgery have NAFLD. Up to 5% suffer from cirrhosis, which is often unknown prior to surgery [16] . In patients with type 2 diabetes mellitus (T2DM), the prevalence fluctuates between 69% and 87% [16] . In pre-diabetic patients with impaired fasting plasma glucose or glucose intolerance, the prevalence of NAFLD is already increased [17, 18] . In lipid-clinic patients, the NAFLD prevalence is 50%.
Practical recommendations on the
diagnostics and management of
NAFLD
The American Gastroenterological Association, the
American Association for the Study of Liver Diseases and the American College of Gastroenterology published joint practical recommendations on the diagnosis and
management of NAFLD in 2012 [16] . A position paper by the European Society for Pediatric Gastroenterology, Hepatology, and Nutrition (ESPGHN) dealt with NAFLD in childhood and adolescence [24, 25] .
As is common today, and recommended by the AASLD Practice Guidelines Committee, the total of 45 practical recommendations of the American gastroenterologists and hepatologists are classified according to GRADE (Grading of Recommendation Assessment, Development,
and Evaluation) , as strong (1) or weak (2). In addition, the
recommendations are weighted according to the quality of their evidence: high (A), moderate (B) and low (C). Below, only the recommendations relevant to the diagnostics have been summarized [16] . The numbers and letters in parentheses refer to the GRADE classification or quality of evidence, as described above.
– In investigating cases of suspected NAFLD, it is essen-tial to exclude other causes of fatty liver disease and co-existing liver diseases (1A).
– Patients with unexpected findings of steatosis obtained through imaging that also exhibit clini-cal or laboratory evidence of liver disease should be subjected to differential diagnosis for clarification (1A). In order to differentiate between alcoholic and non-alcoholic liver disease, an average consumption of > 21 drinks/week for men and > 14 drinks/week for women is defined (2C ). In the case of persistently high ferritin levels and pathological transferrin saturation, hemochromatosis (HFE 282Y homozygosity) should be ruled out genetically or through biopsy (1B). In the presence of auto-antibodies or other indications of autoimmune hepatitis (very high ALT activity, strong γ –globulin increase), all tests should be performed consistently to rule out autoimmune hepatitis (1B). – Patients with unexpected findings of steatosis
obtained by imaging that exhibit no clinical or labo-ratory evidence of liver disease should have their condition clarified in relation to metabolic risk fac-tors (overweight, obesity, diabetes and glucose intol-erance, dyslipidemia) and secondary causes of fatty liver (alcohol, drugs) (1A). For them, no liver biopsy should be performed (1B).
– As for adult patients in primary care or in diabetes and obesity clinics, screening for NAFLD is currently not recommended, because the long-term benefits and cost-effectiveness are unknown (1B). For the same reasons, a systematic screening of family members for NAFLD is not recommended (1B).
– The NAFLD Fibrosis Score ( www.nafldscore.com ) is helpful in identifying NAFLD patients with severe fibrosis (bridging) or cirrhosis (1B). The plasma
concentration of cytokeratin 18 fragments (CK-18) is a promising biomarker for the identification of patients with NASH or advanced fibrosis. Nevertheless, it is too early to recommend the marker for clinical rou-tine (1B).
– The presence of a metabolic syndrome increases the probability of steatohepatitis in NAFLD patients. Accordingly, a biopsy is to be considered (1B). The presence of a metabolic syndrome and high NAFLD fibrosis score can be used for the identification of patients at high risk of NASH or advanced fibrosis (1B). Liver biopsies should be considered for NAFLD patients with an increased risk of NASH or advanced fibrosis (1B). Liver biopsies should also be considered for patients with suspected NAFLD, in cases where competing causes cannot be ruled out without a liver biopsy (1B).
– Patients with NASH/cirrhosis should be screened for esophageal varices (1B). Patients with NASH/cirrho-sis should be monitored for the development of liver cancer (1B). Routine repetition of liver biopsies are not recommended for patients with NAFL or NASH (2C). – Apart from the causes to be clarified in adults, in
non-overweight children with fatty liver, monogenic causes should also be examined, that is, disorders of fatty acid oxidation, lysosomal storage diseases and peroxisomal disorders (2C). Low auto-antibody titers are commonly found in children with NAFLD. High titers, especially in combination with marked eleva-tions of ALT and γ –globulin, should give rise to a liver biopsy to rule out autoimmune hepatitis (2B). A sys-tematic screening for NAFLD in overweight or obese children is not recommended as there is no evidence of any benefit. This is in contrast to another expert committee, which recommended a biennial screening of liver enzymes (1B). In children, a liver biopsy is rec-ommended if the diagnosis is uncertain, if multiple diagnoses seem possible or before potentially hepa-totoxic medication is administered (1B) [25] . In chil-dren, a biopsy is recommended also before the start of any drug treatment for NASH (2C). Pathologists are to be familiar with the histological characteristics of NAFLD in children (1B).
Individual biomarkers of NAFLD and
NASH
The gold standard for NAFLD and NASH diagnoses is the liver biopsy in conjunction with the exclusion of
chronic alcohol consumption and other underlying dis-eases (Table 3). Indirect evidence may arise from clinical signs and symptoms as well as findings of laboratory and imaging tests, and the combination thereof. Most clinical, laboratory and radiological tests are not sensitive and spe-cific enough to differentiate between NAFLD and NASH and to determine the presence and extent of fibrosis [26 – 28] .
Most patients with NAFLD are asymptomatic. If present at all, the symptoms and clinical findings are non-specific. Components of the metabolic syndrome most com-monly found are: overweight or obesity, diabetes and/or hypertension.
There is no single laboratory parameter that allows for the diagnosis of NAFLD or differentiates between stea-tosis, NASH and fibrosis. Although elevated aminotrans-ferase activities often point towards NAFLD, liver enzyme activities are normal in up to 78% of NAFLD patients. If at all. ALT and AST activities are moderately increased up to four times the upper limit of the reference range. In patients with little or no fibrosis, the ALT/AST ratio is typically < 1; in the case of cirrhosis, > 1. The activity of gamma-glutamyl transferase ( γ GT) is often increased in patients with NAFLD. Increased γ GT is associated with fibrosis and increased mortality risk in NAFLD patients. Using a cut-off of 100 U/L, sensitivity and specificity are at approximately 80% and 70%, respectively [26 – 28] .
In recent years, an increased apoptosis rate was dis-covered to be a typical sign of NASH. This knowledge led to the discovery of fragments produced by the enzymatic cleavage of cytokeratin-18 (CK-18) by the caspases 3 and 7, which are released into the plasma [29] . Plasma levels of CK-18 fragments are increased in patients with NASH and enable their differentiation from steatosis. CK-18 frag-ments are superior to other candidate biomarkers, such as the adipocyte fatty acid binding protein (FABP4) or the fibroblast growth factor 21 (FGF21), both in the differ-entiation of NAFLD patients from controls (AUROC = 0.91 compared to 0.66 or 0.84) as well as in the differentiation between steatosis and NASH (AUROC = 0.70 compared to 0.59 or 0.62) [30] . In several studies, CK-18 fragments had an AUROC of 0.80 – 0.93. At the optimal diagnostic cut-offs, specificity was 81% – 100%, and sensitivity amounted to 62% – 82%. The biggest and only multicenter valida-tion study to date revealed an AUROC of 0.83 (ALT, by comparison: 0.58), with a sensitivity of 75% and a speci-ficity of 81% at the ideal cut-off [31] . However, the com-mercially available CK-18 fragment immunoassays differ in their specificity for caspase-cleaved CK-18, which may have led to considerable variation in the diagnostic effi-ciency in the previous studies. A Hannover-based working group, therefore, compared the M30-ELISA in 121 NAFLD
patients, which only recognizes caspase-cleaved CK-18 fragments and thus measures liver cell apoptosis, with the M65-ELISA, which detects both cleaved and uncleaved CK-18 and thus measures cell death in total. Both in the differentiation between steatosis and NASH as well as in differentiating mild fibrosis degrees, the M65 ELISA per-formed better than the M30-ELISA [32] .
Biomarker panel and algorithms
for diagnosis and stratification
of NAFLD
In recent years, several algorithms and scores have been developed to diagnose NAFLD and NASH with simple laboratory parameters and clinical information and to categorize NASH by fibrosis stages.
The NAFLD liver fat score, the fatty liver index (FLI) and the hepatic steatosis index (HSI) were developed to identify patients with steatosis. The NAFLD liver fat score contains as variables the presence of the metabolic syn-drome or type 2 diabetes mellitus, fasting insulin, AST as well as AST/ALT ratio and showed an AUROC of 0.86 – 0.87. The fatty liver index takes into account the body mass index (BMI), waist circumference, triglyceride levels, and thus generates a scale from 0 to 100. The AUROC was 0.84. The HSI integrates ALT, AST, BMI, age and sex and, in a cohort of over 5000 people, reached an AUROC of 0.81 [28] .
A whole range of scores and algorithms has been developed to diagnose NASH. Their average AUROCs amounted to 0.76. Some of these algorithms use simple information, such as the HAIR score (integrating H yper-tension, A LT and I nsulin R esistance), or a clinical model that combines age, sex, BMI, AST, AST/ALT ratio and hya-luronic acid. More complicated models, which partially require also less common laboratory parameters, such as the NashTest with 13 variables (age, sex, height and weight as well as the serum levels of triglycerides, choles-terol, α 2 macroglobulin, apolipoprotein AI, haptoglobin, γ GT, ALT, AST, and total bilirubin), or a model developed by Younoussi et al. (diabetes, sex, BMI, triglycerides, CK-18 fragments and total CK-18), did not produce any improved diagnostic performance either [26, 28] .
For the detection and staging of fibrosis in NASH patients, algorithms were evaluated that were developed either for patients with chronic hepatitis C (FibroTest ® ,
Fibrometer ® , ELF, APRI) or specifically for NAFLD patients
summarizes the evaluated NAFLD scores. American gas-troenterologists favor the NAFLD fibrosis score in their guidelines [16] . In a meta-analysis, the NAFLD sis score in the detection of NASH with advanced fibro-sis ( ≥ F3) yielded an AUROC, sensitivity and specificity at the ideal cut-off of 0.85, 0.90 and 0.97 [33] . In a direct comparison, Fibrometer ® , in the detection of significant
fibrosis ( > F2), produced an AUROC of 0.94 and was thus superior to the NAFLD fibrosis score (AUROC 0.88) and APRI (AUROC 0.87) favored by American gastroenterolo-gists. There was no difference in the diagnosis of cirrhosis (AUROCs: 0.90, 0.90, 0.84) [34] . In another comparative study [35] , transient elastography, AST/ALT ratio, APRI, FIB-4, BARD and NAFLD fibrosis score were compared. As with chronic hepatitis, imaging was superior to all bio-marker scores. For ≥ F3 fibrosis, the AUROC of transient elastography was 0.93 compared to 0.66 (AST/ALT ratio) and 0.80 (FIB4) in the biomarkers. In connection with cir-rhosis, the AUROCs were 0.95 for transient elastography and 0.62 (BARD) as well as 0.80 or 0.81 (NAFLD score or FIB-4, respectively) for the biomarkers.
In summary, there is unfortunately no single labora-tory parameter that allows for the reliable diagnosis or staging of NAFLD or NASH. CK-18 is currently the most promising single parameter for the diagnosis of NASH. Accordingly, American gastroenterologists and hepatolo-gists have emphasized CK-18 in their recommendations, but without calling for its routine use [16] . Further valida-tion studies are needed. CK-18 is currently not available as a routine test. The data situation regarding the sig-nificance of scores and algorithms for the diagnosis and severity classification of NAFLD and NASH is not as reli-ably secured or confirmed as is the significance of scores used in connection with chronic hepatitis. Nevertheless, the fibrosis scores seem well suited to estimate fibrosis in
connection with NAFLD. Again, the patented scores seem superior to the freely available ones, including the NAFLD fibrosis scores favored in the guidelines. The latter, of course, are easily available. Scores created by conven-tional markers also seem inferior to CK-18 in the diagnosis of NASH.
Conflict of interest statement
Authors ’ conflict of interest disclosure: The authors stated that there are no conflicts of interest regarding the publication of this article.
Research funding: None declared.
Employment or leadership: None declared. Honorarium: None declared.
References
1. Mart í nez SM, Crespo G, Navasa M, Forns X. Noninvasive assess-ment of liver fibrosis. Hepatology 2011;53:325 – 35.
2. Baranova A, Lal P, Birerdinc A, Younossi ZM. Non-invasive mark-ers for hepatic fibrosis. BMC Gastroenterol 2011;11:91. 3. Clark PJ, Patel K. Noninvasive tools to assess liver disease. Curr
Opin Gastroenterol 2011;27:210 – 6.
4. Duarte-Rojo A, Altamirano JT, Feld JJ. Noninvasive markers of fibrosis: key concepts for improving accuracy in daily clinical practice. Ann Hepatol 2012;11:426 – 39.
5. Castera L. Noninvasive methods to assess liver disease in patients with hepatitis B or C. Gastroenterology 2012;142:1293 – 302. 6. Udell JA, Wang CS, Tinmouth J, FitzGerald JM, Ayas NT, Simel DL,
et al. Does this patient with liver disease have cirrhosis ? J Am Med Assoc 2012;307:832 – 42.
7. Lin ZH, Xin YN, Dong QJ, Wang Q, Jiang XJ, Zhan SH, et al. Perfor-mance of the aspartate aminotransferase-to-platelet ratio index for the staging of hepatitis C-related fibrosis: an updated meta-analysis. Hepatology 2011;53:726 – 36.
Table 5 Biomarker algorithms for the diagnosis of fibrosis in connection with NAFLD [3, 28, 33 – 35] .
Score Components AUROC ≥≥ F2 AUROC ≥≥ F3 AUROC F4
AAR AST/ALT ratio 0.66 a 0.66 a
APRI AST/platelet ratio 0.87 b 0.84 b
FibroTest ® α 2-macroglobulin, apolipoprotein AI, haptoglobin, bilirubin, γ GT, ALT 0.84
Fibrometer ® Age, weight, FPG, AST, ALT, ferritin, platelets 0.94 b 0.90 b
FIB-4 AST, ALT, platelets 0.80 a 0.81 a
ELF plus ® Hyaluronic acid, TIMP1, P3NP, BMI, T2DM/IFG, AAR, platelets, albumin 0.84 0.93 0.98 NAFLD score Age, hyperglycemia, BMI, platelets, AAR, albumin 0.88 b 0.75 a 0.90 b
0.80 a
BARD BMI, AAR, T2DM 0.69 a 0.62 a
AAR, AST/ALT ratio; AUROC, area under the receiver operator characteristics curve; BMI, body mass index; FPG, fasting plasma glucose; IFG, impaired fasting glucose; P3NP, amino-terminal peptide of procollagen III; T2DM, type 2 diabetes mellitus; TIMP1, tissue inhibitor of metal-loproteinase 1. AUROC values with lowercase alphabets originate in two comparative studies in which the respective scores were directly compared with each other ( a : 35; b : 34).
8. Poynard T, Morra R, Halfon P, Castera L, Ratziu V, Imbert-Bismut F, et al. Meta-analyses of FibroTest diagnostic value in chronic liver disease. BMC Gastroenterol 2007;7:40.
9. Poynard T, Munteanu M, Deckmyn O, Ngo Y, Drane F, Messous D, et al. Applicability and precautions of use of liver injury bio-marker FibroTest. A reappraisal at 7 years of age. BMC Gastroen-terol 2011;11:39 AM.
10. Degos F, Perez P, Roche B, Mahmoudi A, Asselineau J, Voitot H, et al. Diagnostic accuracy of FibroScan and comparison to liver fibrosis biomarkers in chronic viral hepatitis: a multicenter pro-spective study (the FIBROSTIC study). J Hepatol 2010;53:1013 – 21. 11. Zarski JP, Sturm N, Guechot J, Paris A, Zafrani ES, Asselah T,
et al. Comparison of nine blood tests and transient elastography for liver fibrosis in chronic hepatitis C: the ANRS HCEP-23 study. J Hepatol 2012;56:55 – 62.
12. Ghany MG, Kim HY, Stoddard A, Wright EC, Seeff LB, Lok AS, et al. Predicting clinical outcomes using baseline and follow-up laboratory data from the hepatitis C long-term treatment against cirrhosis trial. Hepatology 2011;54:1527 – 37.
13. Cast é ra L, Sebastiani G, Le Bail B, de L é dinghen V, Couzigou P, Alberti A. Prospective comparison of two algorithms combin-ing non-invasive methods for stagcombin-ing liver fibrosis in chronic hepatitis C. J Hepatol 2010;52:191 – 8.
14. Boursier J, de Ledinghen V, Zarski JP, Fouchard-Hubert I, Gallois Y, Oberti F, et al. Comparison of eight diagnostic algorithms for liver fibrosis in hepatitis C: new algorithms are more precise and entirely noninvasive. Hepatology 2012;55:58 – 67.
15. European Association for the Study of the Liver. EASL Clinical Practice Guidelines: management of hepatitis C virus infection. J Hepatol 2011;55:245 – 64.
16. Chalasani N, Younossi Z, Lavine JE, Diehl AM, Brunt EM, Cusi K, et al. The diagnosis and management of non-alcoholic fatty liver disease: practice guideline by the American Gastroenterological Association, American Association for the Study of Liver Diseases, and American College of Gastroenterology. Gastroenterology 2012;142:1592 – 609. Erratum in: Gastroenterology 2012;143:503. 17. Targher G, Byrne CD. Nonalcoholic Fatty liver disease: a novel
cardiometabolic risk factor for type 2 diabetes and its complica-tions. J Clin Endocrinol Metab. 2013;98:483 – 95.
18. Bonora E, Targher G. Increased risk of cardiovascular disease and chronic kidney disease in NAFLD. Nat Rev Gastroenterol Hepatol 2012;9:372 – 81.
19. Williams KH, Shackel NA, Gorrell MD, McLennan SV, Twigg SM. Diabetes and nonalcoholic Fatty liver disease: a pathogenic duo. Endocr Rev 2013;34:84 – 129.
20. Lee JY, Kim KM, Lee SG, Yu E, Lim YS, Lee HC, et al. Prevalence and risk factors of non-alcoholic fatty liver disease in potential living liver donors in Korea: a review of 589 consecutive liver biopsies in a single center. J Hepatol 2007;47:239 – 44. 21. Marcos A, Fisher RA, Ham JM, Olzinski AT, Shiffman ML,
Sanyal AJ, et al. Selection and outcome of living donors for adult to adult right lobe transplantation. Transplantation 2000;69:2410 – 5.
22. Williams CD, Stengel J, Asike MI, Torres DM, Shaw J,
Contreras M, et al. Prevalence of nonalcoholic fatty liver disease
and nonalcoholic steatohepatitis among a largely middle-aged population utilizing ultrasound and liver biopsy: a prospective study. Gastroenterology 2011;140:124 – 31.
23. Browning JD, Szczepaniak LS, Dobbins R, Nuremberg P, Horton JD, Cohen JC, et al. Prevalence of hepatic steatosis in an urban population in the United States: impact of ethnicity. Hepatology 2004;40:1387 – 95.
24. Younossi ZM, Stepanova M, Negro F, Hallaji S, Younossi Y, Lam B, et al. Nonalcoholic fatty liver disease in lean individuals in the United States. Medicine (Baltimore) 2012;91:319 – 27. 25. Vajro P, Lenta S, Socha P, Dhawan A, McKiernan P, Baumann U,
et al. Diagnosis of nonalcoholic fatty liver disease in children and adolescents: position paper of the ESPGHAN Hepatology Committee. J Pediatr Gastroenterol Nutr 2012;54:700 – 13. 26. Miller MH, Ferguson MA, Dillon JF. Systematic review of
per-formance of invasive biomarkers in the evaluation of non-alcoholic fatty liver disease. Liver Int 2011;31:461 – 73. 27. Adams LA, Feldstein AE. Non-invasive diagnosis of
nonalco-holic fatty liver and nonalcononalco-holic steatohepatitis. J Dig Dis 2011;12:10 – 6.
28. Obika M, Noguchi H. Diagnosis and evaluation of nonalcoholic fatty liver disease. Exp Diabetes Res 2012;2012:145754. 29. Strnad P, Paschke S, Jang KH, Ku NO. Keratins: markers
and modulators of liver disease. Curr Opin Gastroenterol 2012;28:209 – 16.
30. Shen J, Chan HL, Wong GL, Choi PC, Chan AW, Chan HY, et al. Non-invasive diagnosis of non-alcoholic steatohepatitis by combined serum biomarkers. J Hepatol 2012;56:1363 – 70. 31. Feldstein AE, Wieckowska A, Lopez AR, Liu YC, Zein NN,
McCullough AJ. Cytokeratin-18 fragment levels as noninvasive biomarkers for nonalcoholic steatohepatitis: a multicenter validation study. Hepatology 2009;50:1072 – 8.
32. Joka D, Wahl K, Moeller S, Schlue J, Vaske B, Bahr MJ, et al. Pro-spective biopsy-controlled evaluation of cell death biomarkers for prediction of liver fibrosis and nonalcoholic steatohepatitis. Hepatology 2012;55:455 – 64.
33. Musso G, Gambino R, Cassader M, Pagano G. Meta-analysis: natural history of non-alcoholic fatty liver disease (NAFLD) and diagnostic accuracy of non-invasive tests for liver disease sever-ity. Ann Med 2011;43:617 – 49.
34. Cal è s P, Lain é F, Boursier J, Deugnier Y, Moal V, Oberti F, et al. Comparison of blood tests for liver fibrosis specific or not to NAFLD. J Hepatol 2009;50:165 – 73.
35. Wong VW, Vergniol J, Wong GL, Foucher J, Chan HL, Le Bail B, et al. Diagnosis of fibrosis and cirrhosis using liver stiffness measurement in nonalcoholic fatty liver disease. Hepatology 2010;51:454 – 62.
Article note: This article is based on a script for DiagnosticUpdate 2013 (8 – 9 March, 2013, Mannheim, Germany). Original German online version at: http://www.degruyter.com/view/j/labm.2014.38. issue-2/labmed-2013-0054/labmed-2013-0054.xml ? format = INT. The German article was translated by Compuscript Ltd. and authorized by the authors.
![Table 1 Semi-quantitative histological methods for assessing liver fibrosis [4]](https://thumb-eu.123doks.com/thumbv2/123doknet/14887239.647505/2.892.90.821.848.1090/table-semi-quantitative-histological-methods-assessing-liver-fibrosis.webp)
![Table 4 Staging of non-alcoholic fatty liver disease (NAFLD) [16] .](https://thumb-eu.123doks.com/thumbv2/123doknet/14887239.647505/6.892.94.443.128.421/table-staging-non-alcoholic-fatty-liver-disease-nafld.webp)
![Table 5 Biomarker algorithms for the diagnosis of fibrosis in connection with NAFLD [3, 28, 33 – 35]](https://thumb-eu.123doks.com/thumbv2/123doknet/14887239.647505/9.892.77.801.122.309/table-biomarker-algorithms-diagnosis-fibrosis-connection-nafld.webp)
