IMPACT 2002+
A New Life Cycle Impact Assessment Methodology
Presemmg a New Meth6d
IMPACT 2002+: A New Life Cycle Impact Assessment Methodology
Olivier Jolliet*, M a n u e l e Margni, Raphael Charles, S6bastien H u m b e r t , J~r6me Payet, Gerald Rebitzer and Ralph R o s e n b a u mIndustrial Ecology & Life Cycle Systems Group, GECOS, Swiss Federal Institute of Technology Lausanne (EPFL), CH-1015 Lausanne, Switzerland
*Corresponding author ([email protected])
Abstract
The new IMPACT 2002+ life cycle impact assessment methodol- ogy proposes a feasible implementation of a combined midpoint/ damage approach, linking all types of life cycle inventory results (elementary flows and other interventions) via 14 midpoint cat- egories ro four damage categories. For IMPACT 2002% new con- cepts and methods have been developed, especially for the com- parative assessment of human toxicity and ecotoxicity. Human Damage Factors are calculated for carcinogens and non-carcino- gens, employing intake fractions, best estimates of dose-response slope factors, as well as severities. The transfer of contaminants into the human food is no more based on consumption surveys, but accounts for agricultural and livestock production levels. In- door and outdoor air emissions can be compared and the inter- mittent character of rainfall is considered. Both human toxicity and ecoroxicity effect factors are based on mean responses rather than on conservative assumptions. Other midpoint categories are adapted from existing characterizing methods (Eco-indicator 99 and CML 2002). All midpoint scores are expressed in units of a reference substance and related to the four damage categories human health, ecosystem quality, climate change, and resources. Normalization can be performed either at midpoint or at damage level. The IMPACT 2002+ method presently provides characteri- zation factors for almost 1500 different LCI-results, which can be downloaded at http://www.epfl.ch/impact
Keywords: Ecotoxicity; human toxicity; IMPACT 2002+; life cycle impact assessment (LCIA); midpoint/damage approach
Introduction
Life cycle impact assessment (LCIA) methods aim to con- nect, as far as possible, and desired, each life cycle inventory (LCI) result (elementary flow or other intervention) to the corresponding environmental impacts. According to ISO 14042, LCI results are classified into impact categories, each with a category indicator. The category indicator can be lo- cated at any point between the LCI results and the category endpoints (where the environmental effect occurs) in the cause-effect chain. Within this framework, two main schools of methods have developed:
a) Classical impact assessment methods [e.g. CML (Guin& et al. 2002) and EDIP (Hauschild and Wenzel 1998)] which restrict quantitative modeling to relatively early stages in the cause-effect chain to limit uncertainties and group LCI
results in so-called midpoint categories, according to themes. Themes are common mechanisms (e.g. climate change) or commonly accepted grouping (e.g. ecotoxicity).
b) Damage oriented methods such as Eco-indicator 99 (Goedkoop and Spriensma 2000) or EPS (Steen 1999), which try to model the cause-effect chain up to the endpoint, or damage, sometimes with high uncertainties.
Recently, the definition study of the SETAC/UNEP Life Cy- cle Initiative suggested utilizing the advantages of both ap- proaches by grouping similar category endpoints into a struc- tured set of damage categories. In addition, the concept also works with midpoint categories, each midpoint category relating to one or several damage categories.
As shown in Fig. 1, LCI results with similar impact path- ways (e.g. all elementary flows influencing stratospheric ozone concentrations) are grouped into impact categories at midpoint level, also called midpoint categories. A midpoint indicator characterizes the elementary flows and other envi- ronmental interventions that contribute to the same impact. The term 'midpoint' expresses the fact that this point is lo- cated somewhere on an intermediate position between the
Midpoint Damage
categories categories
Z Human toxicity
/ / Respiratory effects ~ Human Health / / / I o n i z i n g radiation
/ / / / Ozonelayerdepletion " " ~ ....
/ / / / / Photochemical oxidation ... " ... =
/ / / S . ~ Aquatic ecot oxicity ~ ~ Ecosystem QualRy
"~k~\ik~t" "~ Terrest dal ecotoxicity ~ ~ \ "~ Aquatic acidification J / /
\ \ \ \ ~ Aquatic eutrophication / / ?L~limate ?hange
" ~ ' ~ ~ Terrestrial acid/nutr / / /,.,J ('eSuppo Systems) ~ ~ Land occupation / J
\
\ G,oba,
wa--g
Non-renewable energy = Resources
Mineral extraction
Fig. 1 : Overall scheme of the IMPACT 2002+ framework, linking LCI re- sults via the midpoint categories to damage categories, based on Jolliet et al. (2003a)
324
Int J LCA 8 (6) 324 - 330 (2003)A New Life Cycle Impact Assessment Methodology
IMPACT 2002+
LCI results and the damage (or endpoint) on the impact pathway. In consequence, a further step may allocate these midpoint categories to one or more damage categories, the latter representing quality changes of the environment. A dam- age indicator result is the quantified representation of this quality change. In practice, a damage indicator result is al- ways a simplified model of a very complex reality, giving only a coarse approximation to the quality status of the item. More information on the general concept of such a methodological LCIA framework can be found in Jolliet et al. (2003a). The new IMPACT 2002+ LCIA methodology proposes a feasible implementation of the aforementioned combined midpoint/damage-oriented approach. Fig. 1 shows the overall scheme of the IMPACT 2002+ framework, linking all types of LCI results via 14 midpoint categories (human toxicity, respiratory effects, ionizing radiation, ozone layer depletion, photochemical oxidation, aquatic ecotoxicity, terrestrial eco- toxicity, terrestrial acidification/nutrification, aquatic acidi- fication, aquatic eutrophication, land occupation, global warm- ing, non-renewable energy, mineral extraction) to four damage categories (human health, ecosystem quality, climate change, resources). An arrow symbolizes that a relevant impact path- way is known or assumed to exist. Uncertain impact path- ways between midpoint and damage levels that are not modeled quantitatively are represented by dotted arrows.
In addition to this combined midpoint/damage structure, sev- eral scientific challenges had to be tackled, especially in the areas of human toxicological and ecotoxicological impacts: 9 How to adapt conventional regulatory-orientated risk
assessment methods, often based on conservative assump- tions, in order to estimate cumulative chronic toxico- logical risks and potential impacts in comparative appli- cations such as LCA?
9 How to account in a generic but accurate way for non linear functions, such as the intermittent character of rain- fall or the differences between indoor and outdoor emis- sions, which can generate large errors if neglected?
9 How to structure fate, exposure, and effect of chemicals in
a consistent way following impact pathways, looking at production-based rather than subsistence-based exposures? To address these challenges new concepts and methods for the c o m p a r a t i v e assessment of h u m a n t o x i c i t y and ecotoxicity were developed for the IMPACT 2002+ meth- odology. For other categories, methods have been transferred or adapted mainly from the Eco-indicator 99 (Goedkoop and Spriensma 2000) and the CML 2002 (Guin6e et al. 2002) methods. The following Sections of this paper discuss the main assessment characteristics for midpoint and damage categories, as well as related normalization factors, with a focus on innovative features and performed adaptations.
1 IMPACT 2002+ at Midpoint Category Level
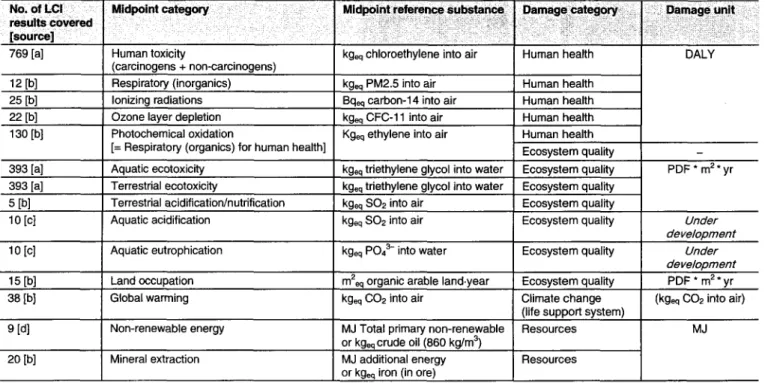
Midpoint characterization factors are based on equivalency principles, i.e. midpoint characterization scores are expressed in kg-equivalents of a substance compared to a reference substance. Table I shows the reference substances and dam- age units used in IMPACT 2002+. The principal scope is common to all impact categories: overall long-term effects are being considered through the use of infinite time hori- zons (sometimes approximated by a 500 years horizon). In general, the average impact has been modeled, avoiding the use of conservative assumptions in determining effect fac- tors. The updated midpoint characterization factors for the number of substances indicated in Table 1 can be down- loaded from the Internet at http://www.epfl.ch/impact.
Table 1: Number of LCI results covered, main sources for characterization factors, reference substances, and damage units used in IMPACT 2002+. Sources are: [a] IMPACT 2002 (Pennington et al. 2003a, 2003b), [b] Eco-indicator 99 (Goedkoop and Spriensma 2000), [c] CML 2002 (Guin6e et al. 2002), and [d] ecoinvent (Frischknecht et al. 2003)
769 [a] 12 [b] 25 [b] 22 [b] 130 [b]
Human toxicity kg~ chloroethylene into air Human health
(carcinogens + non-carcinogens)
Respiratory (inorganics) kgeq PM2.5 into air Human health
Ionizing radiations Bqeq carbon-14 into air Human health
Ozone layer depletion Human health
Photochemical oxidation
[= Respiratory (organics) for human health] 393 [a] Aquatic ecotoxicity
393 [a] Terrestrial ecotoxicity
5 [b] Terrestrial acidification/nutrification 10 [c] Aquatic acidification 10 [c] AqUatic eutrophication 15 [b] Land occupation 38 [b] Global warming 9 [d] Non-renewable energy 20 [b] Mineral extraction
kgeq CFC-11 into air
Kgeq ethylene into air Human health Ecosystem quality kgeq triethylene glycol into water Ecosystem quality kgeq triethylene glycol into water Ecosystem quality
DALY
MJ Total primary non-renewable or kg~ crude oil (860 kg/m 3)
PDF * m 2 * yr
kgeq SO2 into air Ecosystem quality
kgeq SO2 into air Ecosystem quality Under
development
kgeq PO43- into water Ecosystem quality Under
de velopment
m2eq organic arable land.year Ecosystem quality PDF * m 2. yr
kgeq CO2 into air Climate change (kgeq CO2 into air)
(life support system)
Resources MJ
MJ additional energy or kgeq iron (in ore)
Resources
IMPACT 2002+
A New Life Cycle Impact Assessment Methodology
1.1 Human toxicity (carcinogens and non-carcinogens) Characterization factors for chronic toxicological effects on human health, termed Human Toxicity Potentials (HTP) at midpoint- and Human Damage Factors (HDF) at damage level, provide estimates of the cumulative toxicological risk and potential impacts associated with a specified mass (kg) of a chemical emitted into the environment. These are determined with the tool IMPACT 2002 (Impact Assessment of Chemical Toxics) 1, which models risks and potential impacts per emis- sion for several thousand chemicals (Pennington et al. 2003a, 2003b). Generic factors are calculated at a continental level for Western Europe, whereas spatial differentiation for 50 watersheds and air cells in Europe is also enabled.
(
I
Emissi~ in compartment m]
]
89
Fate J I Fraction transferred ton I Chf,?~ca[
factor}
c n Tinn I
L
,'"u~
L
j exposurencentration i e~eS~ake I Dose taken in I Potency
l - response l ' ... ~, ... ' ~' L fEffoeC~r ,~ LI Potentiallaffected I IRisk~ J (D response) . . . .
/ r l fraction of species
[
I persons I]
( ~ ] ("'~:~at~ "~ Damage onf
Severity~" I damage on I human health J I ecosystems Intake fraction iF Effect factor
Fig. 2: General scheme of the Impact pathway for human toxicity and ecotoxicity (Jolliet et al. 2003b)
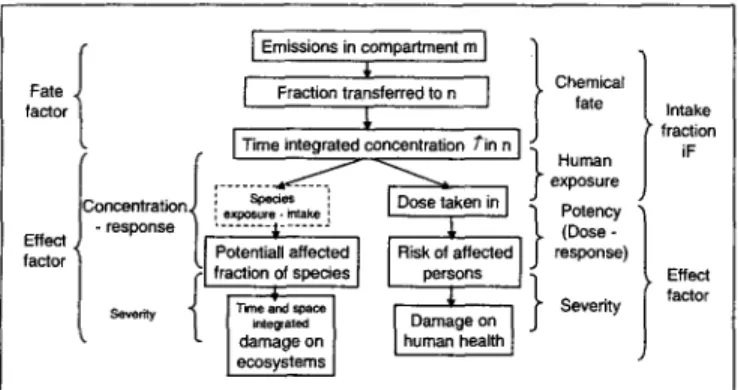
Fig. 2 summarizes the different types of relevant informa- tion regarding human toxicity: fate, which is composed of transport in the environment, exposure, and the resulting intake. This is then combined with an effect factor charac- terizing the potential risks linked to the toxic intakes. Sever- ity finally characterizes the relative magnitude of the dam- age due to certain illnesses. The Human Damage Factor of substance i (HDFi, in DALY (Disability Adjusted Life Years) per kgemitted) is calculated as follows:
HDF i = iF l " EF i = iF I" 13i " Di (1) The intake fraction (iF) is the fraction of mass of a chemical released into the environment that is ultimately taken in by the human population as a result of food contamination, inhalation, or dermal exposure (Bennet et el. 2002a, 2002b), in kgintake per
kgemitte d.
The effect factor (EF) is the product of the dose-response slope factor (6, in risk of incidence per kgintake) and of the severity (D, in DALY per incidence). The intake fraction, therefore, accounts for a chemical's fate in regards to multimedia and spatial transport as well as human exposure associated with food production, water supply, and inhalation. The complete fate and exposure as- sessment enables the estimation of a chemical's mass (or1 'IMPACT 2002' denotes the model which focuses on human toxicity and ecotoxicity, while the complete LCIA methodology, with all impact cat- egories, is termed 'IMPACT 2002+'
concentration) in the environmental media at a regional or at a global scale using the same basic model. Per default, characterization factors are calculated for emissions into a Western European system nested in a global box. Special attention was paid to air modeling and a new simple and accurate method has been developed to account for the in- termittent character of rainfall in a steady-state model. The IMPACT 2002 model accounts for multiple exposure path- ways that link a chemical's concentration in the atmosphere, soil, surface water, or in vegetation to human uptake through inhalation and ingestion. Ingestion pathways include drink- ing water consumption, incidental soil ingestion, and intake of contaminants from agricultural products (fruits, vegeta- bles, grains, etc.), as well as from animal products, such as beef-, pork-, and poultry-meat, eggs, fish, and milk. Com- pared to conventional approaches, the transfer of contami- nants into the human food is no more based on consump- tion surveys, but accounts for agricultural and livestock production levels that are eventually eaten by humans, in- dependently from their living location. Latest developments also include the calculation of pesticide residues in food due to direct applications. The intake fraction concept also fa- cilitates the comparison between indoor and outdoor emis- sions, with the intake fraction for indoor air emissions be- ing a direct function of the ventilation rate per inhabitant. For the effect factor, IMPACT 2002 uses a new approach to calculate the health effect metric for non-cancer toxicologi- cal impacts. The selected measure is the EDa0 , the effect dose inducing a 10 % response over background. It is derived from the health-risk-assessment concept of benchmark dose to estimate a default linear low-dose extrapolation, as detailed by Crettaz et al. (2002) for cancer effects and by Pennington et el. (2002) for non-cancer effects. One gets:
0.1 1. ~human ED1---- ~ B W - L T h 9 N365
(2)
with:J~human
EDt0 BW LTh NaesHuman health effect factor [risk of an incidence per kg cumu- lative intake]
Benchmark dose resulting in 10% effect over background [mg/ kg/day]
Average body weight in considered population [kg/pers] Average lifetime of humans in considered population in years
[yr]
Number of days per year [days/yr]
Preliminary ~ slope factors were calculated from bioassays on animal data using best-estimate extrapolation factors from TDh0, NO(A)EL, and LO(A)EL data 2. The DALY (Disability Adjusted Life Years (Murray and Lopez 1996)) characterizes severity, accounting for both mortality (Years of Life Lost (YLL) due to premature death) and morbidity. Default DALY values of 6.7 and 0.67 [years/incidence] are adopted for most carci- nogenic and non-carcinogenic effects, respectively.
2 Toxic Dose 50%, No and Low Observed (Adverse) Effect Levels
A New Life Cycle Impact Assessment Methodology
IMPACT 2002+
There is no real midpoint for human toxicity as intermedi- ary parameters for fate and exposure like intake fraction (see above) cannot be interpreted on their own. A real mid- point could be the number of cases for the same illness. However, as one or several substances cause a large number of illnesses, risk of illnesses cannot be added up without considering implicitly (equal severity), or preferably explic- itly, their respective severity. The characterization factors at midpoint are therefore simply obtained by dividing the Hu- man Damage Factor of the considered substance by that of the reference substance, which is chloroethylene (declared human carcinogen with well defined fate data and a main impact pathway by air inhalation):
HTPi=HDFi/HDFchl .... thyl ....
in kgeq chloroethylene into air per kg i
(3)
Expressing scores in kg-equivalent of a reference substance facilitates communication and stresses that these characteri- zation factors are mostly interesting for relative compari- sons rather than for their absolute values.
1.2 Aquatic and terrestrial ecotoxicity
In many respects, impacts on aquatic ecosystems are treated similar to human toxicity including both fate and effect, with however some noticeable differences. First, one is generally interested in effect at species level rather than on individu- als. Second, the same fate model is applied as for human toxicity, but the interface between fate and effect is at the level of concentration (see Fig. 2). Fate enables to relate emissions to the change in concentration in the pure aque- ous phase of freshwater. Exposure is generally implicitly taken into account in the effect factor that characterizes the risks at species level, eventually leading to a Potentially Af- fected Fraction (PAF) or Potentially Disappeared Fraction (PDF) of species and to a preliminary indicator of damages on ecosystems.
For aquatic freshwater ecosystems, the time- and space-in- tegrated Potentially Affected Fraction of species per unit of emission (APAF, in PAF-m3-year/kg) is therefore estimated on the basis of a fate factor ( F. 0 , in years) and an effect factor (13, in PAF m3/kg) as follows:
APAI~i = Vi mw" 0w" ~i, in PAF.m3.year/kg
(4)
The fate factor itself is obtained by the multiplication of two parameters that are calculated using the IMPACT 2002 model (Pennington et al. 2003a): F mw is the dimensionless i fraction of the emission of substance i in compartment m transferred to freshwater. 0 w , in years, is the equivalent resi- dence time of substance i in water, equal to the inverse of the overall decay rate constant in water (k). It also corre~ sponds to the time- and space-integrated increase in concen- tration in the aquatic freshwater per mass input of chemical M released into the aquatic environment:
O = I / k = A C - V . A t / M
(5)
tiC (in kg/m 3) is the concentration increase in the volume of water V (in m3), due to an emission flow of MAt (in kg/ year). This space integration differs from traditional regula- tory-orientated risk assessment based on pure PEC/PNEC approaches (predicted concentration divided by predicted no effect concentration). Introducing the volume of water that is polluted to a certain level accounts for the fact that polluting all the lakes in Europe versus a small lake is not equivalent in term of impacts. The aquatic ecotoxicological characterization factors do not include an exposure compo- nent to account for bio-magnification (additional exposure due to contaminants in food, including suspended particulate matter). Only bio-concentration is considered (direct trans- fer of chemicals from the exposure medium to the species, as observed in aquatic laboratory toxicity tests).
The risk-based effect factor (~3 i) is the change in the Poten- tially Affected Fraction of species that experiences an increase in stress for a change in contaminant concentration. As de- scribed in the A_MI method for aquatic ecosystems (Payet et al. 2003), the effect factor assesses the mean impact on spe- cies, using the HC50, the mean hazardous concentration af- fecting 50 % of the species present in the ecosystem:
13i
=0.5/HcSOw
(in PAF m3/kg)(6)
This HC50, in kg/m 3, is itself calculated as the geometric mean of available EC50s 3 on individual species. For com- parative assessments it is better suited than regulatory PNEC approaches based on most sensitive species, since the latter are too sensitive to the species eventually tested.
At midpoint level, the freshwater Aquatic Ecotoxicity Po- tential (AEP i in kgeq triethylene glycol into water per kgi) is derived by normalization to the reference substance, trie- thylene glycol:
AEP i = APAFi
APAFtriethylene glycol
(7)
Terrestrial ecotoxicity potentials are calculated in a similar way. As data availability is limited, terrestrial HC50s are mostly extrapolated from aquatic HC50 w with the method proposed by Hauschild and Wenzel (1998), as a function of the adsorption coefficient of the considered substance i (Kdi , in m3/kg), the soil density (fls, in kg/m3), and the dimen- sionless volumetric water content of soil (fw):
HC50~ = HC50 w (KdiP s + fw)
(8)
1.3 Other midpoint category effects
The characterization factors for the midpoint categories res- piratory effects, photochemical oxidation, ionizing radiation, ozone layer depletion, terrestrial acidification/nutrification, land use occupation, and mineral extraction are obtained from
3 Effect concentration, where 50% of the population of a species are af- fected
I M P A C T 2 0 0 2 + A N e w L i f e C y c l e I m p a c t A s s e s s m e n t M e t h o d o l o g y
Eco-indicator 99 (Goedkoop and Spriensma 2000), adopting the default egalitarian scenario and by normalization to a ref- erence substance. For climate change, the latest IPCC Global Warming Potentials (IPCC 2001) have been used with a 500 years time horizon to account for long term effects.
The characterization factors for aquatic acidification and aquatic eutrophication are adapted from Hauschild and Wenzel (1998), which also correspond to Guin& et al. (2002). Aquatic eutrophication is divided into two classes, respectively valid for P-limited and N-limited watersheds. The values for P-limited watersheds are applied by default as recent evidence shows that ultimately phosphorus is the relevant compound in most cases. This can be explained by the fact that cyano-bacteria in lakes and rivers are fixing the atmospheric N when nitrates are limiting in the aquatic media. Therefore, in the long term, increases in nitrate con- centration will not influence the ecosystem's development, whilst an increase in phosphate will always lead to an in- creasing impact, except in particular areas as for example estuarial ecosystems (Barroin 2003).
Characterization factors for non-renewable energy consump- tion, in terms of the total primary energy extracted, are calcu- lated with the upper heating value (Frischknecht et al. 2003).
2 Damage Categories
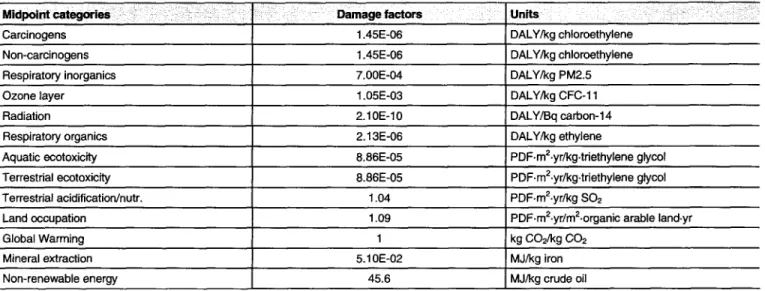
Damage characterization factors of any substance can be ob- tained by multiplying the midpoint characterization potentials with the damage characterization factors of the reference sub- stances (Table 2). The present Section shortly details how these damage characterization factors were determined.
Human Health. Human toxicity (carcinogenic and non-car- cinogenic effects), respiratory effects (inorganics and organ- ics), ionizing radiation, and ozone layer depletion all con- tribute to human health damages. As for human toxicity (see Eq. 3), all of these midpoint characterization factors
can be expressed straightforwardly in
[DALY/kgemission] 4.
4 Or [/Bqernission ] for the 'ionizing radiation' midpoint category
Ecosystem Quality. The midpoint categories terrestrial acidi- fication, terrestrial nutrification, and land occupation were directly taken from Eco-indicator 99 and their impact can directly be determined as a Potentially Disappeared Frac- tion over a certain area and during a certain time per kg of emitted substance, expressed in [PDF-m2-year/kgemittea]. For ecotoxicity, the midpoint assessment is based on the time- and volume-integrated Potentially Affected Fraction of spe- cies, expressed in terms of [PAF.m3.year/kg] (see Eq. 4). Four different approaches are possible to convert PAF into PDF: (1) Eco-indicator 99 (Goedkoop and Spriensma 2000), which uses a direct extrapolation factor of ten between the NOEC based PAF and PDF; (2) The second family of models fo- cuses on the recovery potential of species exposed to chemi- cals; (3) Tools based on an assessment of the probability of the extinction of species under toxicant stress, which are currently used in conservation biology; (4) An assessment of change in genetic diversity. After a comparison of all these options (Payer 2002), the simple extrapolation factor has been employed for Impact 2002+. The variability among the different methods was less than one order of magnitude and the alternative methods cannot be easily applied in LCIA approaches, since they are not compatible with the assump- tion of time and space integration of impacts. For Impact 2002+, though, the factor has to be changed compared to Eco-indicator 99, as the HC50 is based on EC50 instead of NOEC, yielding a factor 0.5. This represents the assump- tion that one half of the species affected over their level of chronic EC50 will disappear due to the toxic stress, result- ing in the following Aquatic Ecotoxicity Damage Factor (AEDF, in [PDF.mZ.year/kg~mitte~]) for a substance i:
AEDF i = 0.5- APAF i / hW,
where h w is the mean depth of freshwater, in [m]
(9)
Extrapolation methods are presently under development for damage factors characterizing impacts on ecosystem qual- ity caused by aquatic acidification and aquatic eutrophi- cation. In addition, photochemical oxidation and ozone de- pletion also potentially contribute to the overall impacts on
Table 2: Characterization damage factors of the various reference substances
Carcinogens 1.45E-06 DALY/kg chtoroethylene
Non-carcinogens 1.45E-06 DALY/kg chloroethylene Respiratory inorganics 7.00E-04 DALY/kg PM2.5
Ozone layer 1.05E-03 DALY/kg CFC-11
Radiation 2.10E-10 DALY/Bq carbon-14
Respiratory organics 2.13E-06 DALY/kg ethylene
Aquatic ecotoxicity 8 . 8 6 E - 0 5 PDF.m2.yr/kg.tdethylene glycol Terrestrial ecotoxicity 8 . 8 6 E - 0 5 PDF.m2.yr/kg.tdethylene glycol Terrestrial acidification/nutr. 1.04 PDF-m2-yr/kg SO2
Land occupation 1.09 PDF.m2.yr/m2.organic arable land.yr
Global Warming 1 kg CO2/kg CO2
Mineral extraction 5.10E-02 MJ/kg iron
Non-renewable energy 45.6 MJ/kg crude oil
A New Life Cycle Impact Assessment Methodology
IMPACT 2002+
ecosystems. However, lack of adequate scientific informa- tion does not allow, at the moment, to quantify their single contributions in term of Potentially Disappeared Fraction. If desired, these effects could be considered by including these midpoints categories in the weighting phase (see below). Climate Change. From the authors' point of view, thus far the modeling up to the damage of the impact of climate change on ecosystem quality and human health is not accurate enough to derive reliable damage characterization factors. The inter- pretation, therefore, directly takes place at midpoint level, which can be interpreted as damage on life support systems that deserve protection for their own sake. The global warm- ing is considered as a stand-alone endpoint category with units of [kgeq CO2] , which is normalized in the next step. The as- sumed time horizon is also 500 years to account for both short- term and long-term effects as there is little evidence that glo- bal warming effects will decrease in the future.
Resources. The two midpoint categories contributing to the endpoint category 'resources' are mineral extraction and non- renewable energy consumption. Damages due to mineral resource extraction are specified according to Eco-indicator 99, with the concept of surplus energy (in [MJ]). This is based on the assumption that a certain extraction leads to an additional energy requirement for further mining of this resource in the future, caused by lower resource concentra- tions or other unfavorable characteristics of the remaining reserves (Goedkoop and Spriensma 2000).
Whereas minerals could still be potentially accessible for further use, even after waste disposal, dissipated non-renew- able energy is not any more available at a functional exergy level. If an infinite time horizon is considered, this implies that the total energy content is lost as a resource, in addition to the surplus energy. Therefore, contrary to Eco-indicator 99, the overall non-renewable primary energy is assessed for non-renewable energy resources, including feedstock energy for energy carriers (upper heating values). The endpoint unit of impacts on resources is the amount of ad- ditional primary energy required per unit of mineral and of total non-renewable primary energy for energy carriers, in [ M J / u n i t e . . . d]"
3 Normalization and Weighting
The idea of normalization is to analyze the respective share of each impact to the overall damage by applying normali- zation factors to midpoint- or damage impact classes in or- der to facilitate interpretation. The normalized factor is de- termined by the ratio of the impact per unit of emission divided by the total impact of all substances of the specific category for which characterization factors exist, per per- son per year. The unit of all normalized midpoint/damage factors is therefore [pers.year/unitemission] 5, i.e. the number of equivalent persons affected during one year per unit of emission. An alternative would be to normalize to m2-years equivalents, as in the Critical Surface-Time 95 LCIA method (Jolliet 1994, Jolliet and Crettaz 1997), the predecessor of
5 The units can be expressed per [kgem~ed], per [Bqer.~.ea ], or per [m2.year]
Table 3: Normalization factors for the four damage categories for West- ern Europe D a m a g e Categories Human health Ecosystem Quality Climate Change Resources Normalization U n i t i . . . . f a c t o r s ' . . . . 0.0077 DALY/pers/yr 4650 PDF-m2.yr/pers/yr 9950 kg CO2/pers/yr 152000 MJ/pers/yr
IMPACT 2002+. In priority, the authors suggest to perform normalization after the damage characterization. For those who would like to stop at midpoint level, appropriate normal- ization factors are also available. An overview of normaliza- tion factors for the four damage categories is given in Table 3.
Human Health. The normalization factor is calculated ac- cording to Eco-indicator 99, with two modifications: im- pacts on human health caused by climate change are not taken into account (see above) and human toxicity is calcu- lated as the sum of carcinogenic and non-carcinogenic ef- fects. For each pollutant, the impact in [DALYs/kgemit~j is multiplied with the annual emissions in Western Europe (per media: air, soil and water). This gives the overall DALYs annually lost by this specific pollutant in Europe. The total human health impacts per year is obtained by summing up the results for all pollutants, i.e. 2.92.106 [DALY/year]. Fi- nally, this value is divided by the European population (380.106) to obtain the adopted human health normalization factor of 7.7.10 .3 [DALYs/pers/year], expressing a reduction of life ex- pectancy of about three days per year and per person. Ecosystems Quality. This normalization factor is determined similarly to Eco-indicator 99, with two modifications: the damage to ecosystem quality caused by land conversion and photochemical oxidation have not been taken into account and the damage to ecosystem quality caused by ecotoxico- logical emissions has been broken down into damages to aquatic ecosystems and terrestrial ecosystems.
Climate Change. The normalization factor for climate change is based on the total gaseous emissions released in Europe per year multiplied with the global warming potentials for a 500 years horizon. The total global warming score related to Western European emissions is 3.78.1012 [kgeq CO2/year]. This value has been divided by the Western European popu- lation (380.106 inhabitants) to obtain the amount of global warming gases emitted per person and per year, which is
9.95.103 [kg~q CO2/pers/year ].
Resources. The normalization factor for resources is calcu- lated with the total non-renewable energy consumption in Western Europe, including nuclear energy consumption. Weighting. The authors suggest considering the four-dam- age oriented impact categories human health, ecosystem quality, climate change, and resources separately for the in- terpretation phase of LCA. However, if aggregation is needed, one could use self-determined weighting factors or a default weighting factor of one, unless other social weighting val- ues are available.
IMPACT 2002+
A New Life Cycle Impact Assessment Methodology
4 Conclusions and Outlook
The I M P A C T 2002+ LCIA m e t h o d o l o g y proposes an at- tractive implementation of a combined m i d p o i n t / d a m a g e a p p r o a c h , with n e w developments in the comparative as- sessment o f h u m a n toxicity and ecotoxicity. Several limita- tions m u s t h o w e v e r be mentioned: several impact catego- ries have n o t been considered that far, such as impacts on the marine environment, noise, etc. For the ecotoxicity and h u m a n toxicity of metals, further research is presently un- der way, a i m i n g at the c o n s i d e r a t i o n of speciation and bioavailability. Efforts are also carried o u t to extend the as- sessment to a m u c h wider n u m b e r of considered LCI-re- sults, aided by newly available databases.
Acknowledgments. The authors would like to thank all researchers who have very significantly contributed to the development of the sci- entific basis supporting the IMPACT 2002+ model, especially David Pennington, Christophe Amman and Pierre Crettaz. We would also like to thank the Swiss EPA (BUWAL) and the French EPA (ADEME), who funded some of the research leading to IMPACT 2002+.
References
Barroin G (2003): Phosphore, Azote et Prolif&ation des V~g&aux Aquatiques. Courrier de l'Envirormement de I'INRA; no. 48, 13--25 Bennett DH, Margni M, McKone TE, Jolliet O (2002b): Intake Frac- tion for Multimedia Pollutants: A Tool for Life Cycle Analysis and Comparative Risk Assessment. Risk Analysis 22, 903-916 Bennett DH, McKone "rE, Evans JS, Nazaroff WW, Margni MD,
Jolliet O, Smith KR (2002a): Defining Intake Fraction. Environ Sci Technol 36, 207A-211A
BUWAL (1999): Okologische Bewertung mit Hilfe der Grauen Energie. Schriftenreihe Umwelt, Okobilanzen, Vol. 307, Bern (CH) Crettaz P, Pennington D, Rhomberg L, Brand B, Jolliet O (2002): Assessing Human Health Response in Life Cycle Assessment Us- ing ED10s and DALYs: Part 1-Cancer Effects. Risk Analysis 22, 931-946
Frischknecht et al. (2003): ecoinvent Database, http://www.ecoinvent.ch/ Goedkoop M, Spriensma R (2000): The Eco-indicator 99: A Damage Oriented Method for Life Cycle Assessment, Methodology Report, second edition. Pr~ Consultants, Amersfoort (NL), Netherlands Guin6e JB, Gorr6e M, Heijungs R, Huppes G, Kleijn R, van Oers L,
Wegener Sleeswijk A, Suh S, Udo de Haes HA, de Bruijn H, van Duin R, Huijbregts MAJ (2002): Life Cycle Assessment: An Op- erational Guide to the ISO Standards. Kluwer Academic Publish- ers, Dordrecht (NL)
Hauschild M, Wenzel H (1998): Environmental Assessment of Products - Vol. 2: Scientific Background, Chapman & Hall, London (UK)
Heijungs R, Guin6e JB, Huppes G, Lankreijer RM, Udo de Haes HA, Wegener Sleeswijk A, Ansems AMM, Eggels PG, van Duin R, Goede HP (1992): Environmental Life Cycle Assessment of Products. Centre of Environmental Science (CML), Leiden (NL) IPCC (2001): Climate change 2001: The Scientific Basis. Intergov-
ernmental Panel on Climate Change (IPCC), htm://www.~rida.no/ climate/ipcc tar/, 385-391
Jolliet O (1994): Critical Surface-Time: An Evaluation Method for Life Cycle Assessment. In: Udo de Haes HA et al. fEd.): Integrat- ing Impact Assessment into LCA. SETAC Press, 133-142 Jolliet O, Brent A, Goedkoop M, Itsubo N, Mueller-Wenk R, Pefia
C, Schenk R, Stewart M, Weidema B (2003a): LCIA Definition Study of the SETAC-UNEP Life Cycle Initiative. UNEP, http:// www.unet~tie.or~tDC/SUstain/lcinitiadve/
Jolliet O, Crettaz P (1997): Critical Surface-Time 95, a Life Cycle Impact Assessment Methodology, including Exposure and Fate, EPFL (CH)
Jolliet O, Pennington D, Amman C, Pelichet T, Margni M, Crettaz P (2003b): Comparative Assessment of the Toxic Impact of Metals on Humans within IMPACT 2002. In: Dubreuil A fEd.): Life Cycle Assessment of Metals - Issues and Research Directions, SETAC Press, ISBN 1-880611-62-7
Murray C, Lopez A (1996): The Global Burden of Disease, a Com- prehensive Assessment of Mortality and Disability from Diseases, Injuries, and Risk Factors in 1990 and Projected to 2020. Global Burden of Disease and Injury Series, Vol.1 & 2; Harvard School of Public Health, World Health Organization and World Bank Payet J (2002): Developpement de la M&hode AMI. ADEME Report,
Agence de l'Environnement et de la Maltrise de l'Energie; Paris (F) Payet J, Jollier O (2003): Comparative Assessment of the Toxic Im- pact of Metals on Aquatic Ecosystems: the AMI Method. In: Dubreuil A fEd.): Life Cycle Assessment of Metals - Issues and Research Directions, SETAC Press, ISBN 1-880611-62-7 Payet J, Pennington D, Hauschild M., Jolliet O (2003): Comparative
Assessment of Toxic Impacts on Aquatic Ecosystems: The AMI method (Assessment of the Mean Impact). Submitted to Environ Toxicol Chem
Pennington D, Amman C, Pelichet T, Margni M, Jolliet O (2003b): Spatial Multimedia Chemical Fate and Human Exposure Model for Western Europe. Submitted to Environ Sci Technol
Pennington D, Crettaz P, Tauxe A, Rhomberg L, Brand B, Jolliet O (2002): Assessing Human Health Response in Life Cycle Assess- ment Using ED10s and DALYs: Part 2-Noncancer Effects. Risk Analysis 22, 947-963
Pennington D, Margni M, Payet J, Charles R, Jolliet O (2003a): Es- timating Cumulative Toxicological Risks and Potential Impacts for Human Health and Ecosystems in LCA. Submitted to Environ Toxicol Chem
Steen B (1999): A systematic Approach to Environmental Priority Strategies in Product Development (EPS). 2000-General System Characteristics & 2000-Models and Data. Chalmers, CPM re- port: 1999, 4 and 5, httD://et~s.esa.chalmers.se/download.htm
Olivier Jolliet is assistant professor at the Swiss Federal Insti- tute of Technology Lausanne (EPFL), Switzerland, heading the Industrial Ecology & Life Cycle Systems Group. His research fo- cuses on preventing and reducing emissions and resource con- sumption by modeling life cycle systems, with an emphasis on innovative technologies (telecommunication & information sys- tems, environmentally friendly biomaterials, waste treatment tech- nologies & recycling). A second focus is the modeling of multi- compartment systems for fate & exposure to assess the life cycle impacts of toxics on human health and ecosystems, in collabora- tion with the chemical and automotive industries.
Olivier Jolliet is the scientific responsible and manager of the Life Cycle Impact Assessment programme of the UNEP (United Na- tions Environment Program) / SETAC Life Cycle Initiative.
He is editor and/or reviewer for several scientific joumals (Envi- ronmental Toxicity and Chemistry, Chemosphere, Int J LCA, Jour- nal of Industrial Ecology, Journal of Cleaner Production). Olivier Jolliet obtained a Master, and a Ph.D. in physics in 1988. He worked as a postdoc at the Silsoe Research Institute (GB) and as a visiting scholar at MIT (USA).
Prof. Olivier Jolliet, Ecole Polytechnique F6d6rale de Lausanne (EPFL), Industrial Ecology - Life Cycle Systems Group, EPFL- ENAC-GECOS, CH-1015 Lausanne, Switzerland; T: +41-21-693- 5775; F: +41-21-693-5760; olivier.iolliet @ epfl.ch; http://eecos.eofl. ch/Icsystems/