HAL Id: hal-00169778
https://hal.archives-ouvertes.fr/hal-00169778
Submitted on 4 Sep 2007HAL is a multi-disciplinary open access
archive for the deposit and dissemination of sci-entific research documents, whether they are pub-lished or not. The documents may come from teaching and research institutions in France or abroad, or from public or private research centers.
L’archive ouverte pluridisciplinaire HAL, est destinée au dépôt et à la diffusion de documents scientifiques de niveau recherche, publiés ou non, émanant des établissements d’enseignement et de recherche français ou étrangers, des laboratoires publics ou privés.
HD189733b
David Ehrenreich, Guillaume Hébrard, Alain Lecavelier Des Etangs, David K
Sing, Jean-Michel Désert, François Bouchy, Roger Ferlet, Alfred Vidal-Madjar
To cite this version:
David Ehrenreich, Guillaume Hébrard, Alain Lecavelier Des Etangs, David K Sing, Jean-Michel Désert, et al.. A Spitzer Search for Water in the Transiting Exoplanet HD189733b. The Astrophysical journal letters, Bristol : IOP Publishing, 2007, 668, pp.L179. �hal-00169778�
hal-00169778, version 1 - 4 Sep 2007
—Accepted for publication in ApJ Letters—
David Ehrenreich, Guillaume H´ebrard, Alain Lecavelier des Etangs, David K. Sing, Jean-Michel D´esert, Fran¸cois Bouchy, Roger Ferlet, and Alfred Vidal-Madjar Institut d’astrophysique de Paris, CNRS (UMR 7095), Universit´e Pierre et Marie Curie,
98 bis boulevard Arago, 75014 Paris, France ABSTRACT
We present Spitzer Space Telescope observations of the extrasolar planet HD 189733b primary transit, obtained simultaneously at 3.6 and 5.8 µm with the Infrared Array Camera. The system parameters, including planetary ra-dius, stellar rara-dius, and impact parameter are derived from fits to the tran-sit light curves at both wavelengths. We measure two consistent planet-to-star radius ratios, (Rp/R⋆)3.6 µm = 0.1560 ± 0.0008(stat) ± 0.0002(syst) and
(Rp/R⋆)5.8 µm = 0.1541 ± 0.0009(stat) ± 0.0009(syst), which include both the
random and systematic errors in the transit baseline. Although planet radii are determined at 1%-accuracy, if all uncertainties are taken into account the re-sulting error bars are still too large to allow for the detection of atmospheric constituants like water vapour. This illustrates the need to observe multiple transits with the longest possible out-of-transit baseline, in order to achieve the precision required by transmission spectroscopy of giant extrasolar planets. Subject headings: planetary systems — stars: individual (HD 189733)
1. INTRODUCTION
During a planetary transit, the eclipsed light from the star filters through the atmo-spheric limb of the planet. Transmission spectroscopy of this light lead to detect and probe the deep and upper-escaping atmospheres of HD 209458b (Charbonneau et al. 2002; Vidal-Madjar et al. 2003, 2004; Ballester et al. 2007). Richardson et al. (2006) obtained the first infrared (IR) transit measurement for this planet and found its radius at 24 µm consistent with the visible radius. Based on planetary radius measurements by Knutson et al. (2007a)
at optical wavelengths, Barman (2007) claimed the identification of water in the planet atmosphere.
HD 189733b, discovered by Bouchy et al. (2005), is orbiting a small, close, and bright main sequence K star, thus giving the deepest transit occultation ever detected (∼2.5%). The planet has a mass Mp = 1.13 Jovian mass (MJ) and its radius in the visible is Rp =
1.16 Jovian radius (RJ; Bakos et al. 2006; Winn et al. 2007). Fortney & Marley (2007)
suggested a possible water detection in this planet, yielding from Spitzer observations of an anti-transit, whereas Knutson et al. (2007b) obtained the planet-to-star radius ratio at 8 µm and found (Rp/R⋆)8 µm= 0.1545 ± 0.0002.
Here we describe the Spitzer observations collected during the primary transit of HD 189733b in order to measure its radius at two different IR wavelengths and search for atmospheric water (H2O). Models of the IR transmission spectrum of this planet (Tinetti et al. 2007a,b)
have shown that Spitzer is well suited to probe the planet atmospheric composition, in par-ticular by comparing two photometric bands, centered at 3.6 and 5.8 µm. The absorption by H2O should give a difference in the spectral ratios measured at those two wavelengths of
∆ℜ′(H2O) ≡ (ℜ′
5.8µm− ℜ ′
3.6µm)/ℜ ′
3.6µm ∼ 1.7–3.4%, depending on the set of H2O absorption
cross-section coefficients used for the calculation, and where ℜ′
≈ (Rp/R⋆)2, as defined by
Brown (2001). This corresponds to a predicted planetary radius relative difference due to absorption by H2O of ∆R(H2O) ∼ 0.85–1.7%.
2. OBSERVATIONS
We observed HD 189733 on 2006 October 31, during a primary transit of its planet with the Infrared Array Camera (IRAC, Fazio et al. 2004). Our 4.5-h observations covers the 1.8-h transit of HD 189733b. We used only one IRAC channel pair to avoid repointing the telescope during the observations: the 0.75-µm-wide channel 1 centered on 3.6 µm, and the 1.42-µm-wide channel 3 centered on 5.8 µm. We did not dither the pointing in order to keep the source on a particular position of the detector and increase the photometric accuracy.
The observations were split in 1936 consecutive sub-exposures, each integrated over 0.4 and 2 s (frame times) for channels 1 and 3, respectively. The short exposure times in IRAC ‘stellar mode’ avoid the saturation of the detector due to HD 189733, a K = 5.5 magnitude star. We used the flat-fielded, cosmic-ray-corrected, and flux-calibrated data files provided by the Spitzer pipeline.
3. DATA ANALYSIS
3.1. Photometry and background
To obtain a transit light curve from the two-dimensional 1936 images, we calculate a weighted aperture photometry by summing the weighted background-subtracted flux on each pixel within an aperture of given radius r (Horne 1986; Naylor 1998). The optimal weighting on a pixel is P/σ2, where P and σ are the values of the point spread function (PSF) and
photon noise for this pixel. The PSF is estimated in each channel and for each pixel as the median of the background-subtracted fluxes. Finally, the estimated error on the weighted integrated flux is calculated as the square-root of the weighted photon-noise quadratic sum; it remains a constant throughout the time series.
To estimate the sky and instrumental background for each exposure, we calculated the mean value of the image in an annulus centered on the star with inner and outer radii of 16 and 18 pixels, respectively. Different ring sizes were tested to check that (1) the stellar PSF does not contaminate the background and (2) other field stars contribution is minimized. Typical background estimates are ∼ 0.05 and 0.1–0.2 mJy per pixel in channels 1 and 3, respectively. They are ∼ 104 times less than stellar flux integrated over the 113-pixel
photometric aperture.
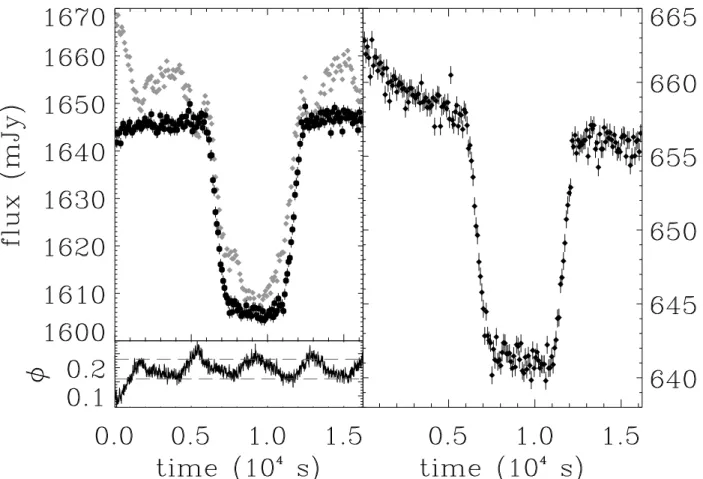
The initial weighted flux time series were extracted with an aperture radius r = 6 pixels. The raw weighted light curves in channels 1 and 3 are plotted in Fig. 1. Beyond the main trend due to the expected planetary transit, with an occultation depth of more than 2% during about 6,500 s, additional effects pollute the signal. In both channels, there is a strong decrease of the flux during the first ∼ 1, 000 s of observations. Most noticeable in channel 1 at 3.6 µm, the star is close to nominal saturation limits and the light curve presents large fluctuations, attributed to the ‘pixel-phase effect’. A close look to the 2D images obtained in channel 3 at 5.8 µm reveals a contamination of the photometry caused by the ‘bandwidth effect’. The light curve baseline is also affected in this channel by a decreasing drift. These effects and their corrections are now further detailed.
3.2. Instrumental artifacts
Saturation. The flux of HD 189733 is 1,700 mJy at 3.6 µm. This is about twice the maximum recommended (and conservative) point source value for a frame time of 0.4 s in
stellar mode.1 Looking into the raw data from channel 1, we found that the brightest pixel
of the stellar PSF is above the detector array saturating value (DN = 30, 000) only during the ∼ 100 first sub-expsosures. Those are already discarded for the data reduction. In the following sub-exposures, the flux remains below the saturation limit, in the linear regime.
Pixel-phase effect at 3.6 µm. The telescope jitter and intra-pixel sensitivity variations for the observation of a bright star are likely responsible for the large fluctuations seen in the light curve obtained at 3.6 µm in channel 1. These fluctuations are correlated to the pixel-phase variation, whose effect is most severe in channel 1. A description of this effect and a correction method are given in the IRAC data handbook (Reach et al. 2006, p. 50). The method, also reported by Morales-Calder´on et al. (2006), consists in calculating a pixel-phase dependent correction on the flux, Fcor
w = Fw[1 + k (1/2π − φ)] −1
, where the pixel phase is φ = [(x − x0)2+ (y − y0)2]1/2, (x, y) is the centroid of the point source, and x0 and y0 are the
integer pixel numbers containing the source centroid. The optimized correction is determined by iteratively fitting the out-of-transit flux baseline. The pixel phase variations and the raw and corrected light curves are plotted in Fig. 1 (left). The relative difference introduced by this correction on the value of (Rp/R⋆)3.6 µm can be estimated to ∆3.6µmR (phase) ∼ 2–3%.
Bandwidth effect at 5.8µm. The bandwidth effect reportedly affects those IRAC chan-nels fitted with detector arrays made of arsenic doped silicon (Si:As), such as channel 3. The IRAC data handbook (Reach et al. 2006, p. 24) describes it as decaying echoes 4, 8, and 12 columns to the right of a bright or saturated pixel. HD 189733 is no brighter than 700 mJy at 5.8 µm, whereas the maximum unsaturated point source brightness at this wavelength and for 2-s frame time is 1,400 mJy.1 Yet, the pixel located 4 columns to the right of the
stellar maximum is anomalously bright in all exposures and appears as a peak in the wing of the stellar PSF, ∼ 2–3 times brighter than closer-to-the-centroid adjacent pixels. Therefore, we rejected this suspicious pixel from the aperture photometry integration, as recommended by IRAC status reports.2 This decreases the value obtained for (R
p/R⋆)5.8 µm, and the
rel-ative difference between the corrected and uncorrected values is ∆5.8µmR (band) ∼ 1%. The bandwidth effect could typically lead to obtain a planetary radius systematically larger at 5.8 than at 3.6 µm and mimic an absorption due to atmospheric water, hence leading to a false detection.
1See http://ssc.spitzer.caltech.edu/irac/sat.html.
2See the October and December 2005 IRAC status reports at
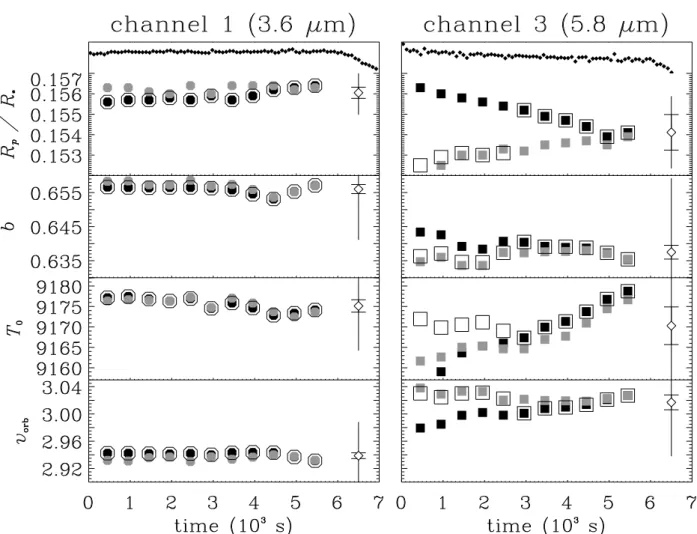
Drift of the flux at 5.8 µm. A non-linear decreasing drift can be seen in the channel-3 light curve (Fig. 1, right). After steeply decreasing, the drift seems to set as a nearly linear trend after 2,500 s. This gives us the choice to drop the exposures before that time and linearly fit the out-of-transit baseline after, or keep most of the exposures at the beginning of the observations and perform either a quadratic or exponential fit to the baseline. We tested the influence of both the polynomial fitted to the baseline and the number of exposures dropped from the beginning of the observations on the system parameters yielding from the fitting procedure. To this purpose, the time ts defining the start of the fit was set
as a free parameter. For consistency, the same tests were performed in channel 1, and their results are plotted in Fig. 2. A large dispersion of values is obtained, especially for (Rp/R⋆)5.8 µm in channel 3. Depending on the fit parameters, the dispersion obtained are
∆3.6µmR (drift) ∼ 0.1% and ∆5.8µmR (drift) ∼ 0.6% at 3.6 and 5.8 µm, respectively. The limited knowledge of the baseline exact level during the transit introduces systematic uncertainties in the determination of the system parameters. These uncertainties are further taken into account as systematic errors.
3.3. Determination of the system parameters
Selection of sub-exposures. We made a selection within the 1936 sub-exposures to obtain the best possible photometry. Sub-exposures where the aperture contains at least one pixel flagged by the Spitzer pipeline, are removed from our time series. We did not apply such selection to one particular pixel always present in the wing of the PSF in channel 1: it is systematically flagged as having a ‘photometric accuracy unacceptably low,’ which is verified when compared to adjacent pixels. However, we found no significant differences when including or excluding it from the aperture photometry. We also removed the dozen sub-exposures in each channel where the integrated photometry of HD 189733 presents strong and isolated variations. Finally, we kept in channel 1 the exposures where the pixel phase was between 0.16 < φ < 0.23 (see Fig. 1), and rejected the others in order to minimize the influence of residuals from the correction for the pixel-phase effect. As a result, when cutting out the first 500 s of data after the beginning of the observations, we consider 75 and 96% of the total number of exposures in channels 1 and 3, respectively.
Fitting the transit light curves. The transit light curves at 3.6 and 5.8 µm are fitted with a procedure based on the analytical model of Mandel & Agol (2002), which includes the effect of limb-darkening. The procedure is able to fit either linear, quadratic, or exponential baselines. The resulting parameters of the fit at each wavelength are the planet-to-star
radius ratio Rp/R⋆, the impact parameter b in units of stellar radii, the orbital velocity vorb
in units of stellar radii which, because the planet orbital period is known to high accuracy (2.218574 days, according to H´ebrard & Lecavelier des Etangs 2006), can be converted into R⋆M
−1/3
⋆ , where M⋆ is the stellar mass, and the heliocentric transit central time T0. The
best fits obtained are plotted in Fig. 3.
Limb darkening effect. The contribution of limb-darkening to the transit light curve is calculated using a non-linear limb-darkening law (Mandel & Algol 2002) which has four wavelength-dependent coefficients. These coefficients were fitted using a Kurucz (2005) stellar model (Teff = 5, 000 K, log g = 4.5, solar abundance), which closely matched the
observed parameters of HD 189733, at 17 different angles from center to limb. The stellar model was convolved, at each angle, with the IRAC photometric bandpasses before fitting the non-linear law. We found the coefficients C1, C2, C3, and C4 of the law to be 0.6023,
−0.5110, 0.4655, and −0.1752 at 3.6 µm, and 0.7137, −1.0720, 1.0515, and −0.3825 at 5.8 µm. The uncertainty in the limb-darkening coefficients has no impact on the results. However, the uncertainty in the impact parameter introduces an uncertainty in the limb darkening amplitude and, therefore, an uncertainty in the measured planetary radius. The relative radius difference at 3.6 µm due to the limb-darkening effect is ∆3.6µmR (limb) ∼ 1% and ∆5.8µmR (limb) ∼ 0.3% at 3.6 and 5.8 µm, respectively. The limb-darkening effect can be appreciated in the bottom panel of Fig. 3.
Statistical error bars. The statistical error bars on the parameters are calculated with the ∆χ2 method described by H´ebrard et al. (2002). The quality of the fit is given by the
value of χ2/n, where n is the degree of freedom of the light curve. Assuming we are limited
by the photon noise, we find χ2/n of ∼ 1.5 and 1.3 at 3.6 and 5.8 µm, respectively. We thus
scaled the uncertainties larger by factors of√1.5 = 1.22 and √1.3 = 1.14 to obtain χ2/n ∼ 1
in both channels. Using various models and starting time for the baseline gives similar χ2
values, showing that the light curve does not contain enough information to constrain that source of uncertainty.
Systematics. The effects described above all introduce systematics that are clearly not negligible compared to the predicted radius differences due to atmospheric water, ∆R(H2O) ∼
0.85–1.7%. Limb-darkening effect, introducing ∆3.6µmR (limb) ∼ 1% in channel 1 and ∆5.8µmR (limb) ∼ 0.3% in channel 3 is dealt with as described in the previous section. Tests shown that we are able to fairly correct for ∆3.6µmR (phase) ∼ 2% and ∆5.8µmR (band) ∼ 1%. On the other hand, additional uncertainty have to be introduced to properly handle the systematics linked to
the drift in the flux seen in channel 3 and, to a lesser extent, in channel 1. Indeed, basing ourselves on the similar reduced χ2 obtained when fitting the baseline with different
polyno-mials, we cannot choose one of the sets of system parameters rather than another. Besides, in the absence of a ‘plateau’ in the plot of (Rp/R⋆)5.8 µm vs. ts, we cannot either favor one
solution based on the time ts chosen to start the fitting procedure. After removing the
so-lutions corresponding to the extreme values of ts, we thus set the value of each parameter,
in each channel, to the mean of each sample of solutions. The uncertainties on the obtained values should reflect the dispersion observed. Therefore, we set a systematic error bar on each parameter, equal to the standard deviation in each sample of solutions.
4. RESULTS AND DISCUSSION
The quality of the method is confirmed by the good agreement between system pa-rameters independently obtained with the best fits to the light curves at both wavelengths (see Fig. 3; the values are reported in Table 1). We measure consistent planet-to-star ra-dius ratios of 0.1560 ± 0.0008(stat) ± 0.0002(syst) and 0.1541 ± 0.0009(stat) ± 0.0009(syst), at 3.6 and 5.8 µm, respectively. Using the notation introduced above, we find ∆R(obs) =
−0.84 ± 1.00(stat) ± 0.84(syst)%.
Tinetti et al. (2007a,b) estimated that the presence of H2O in the atmosphere of the
planet would result in a radius at 5.8 µm being ∆R(H2O) ∼ 0.85–1.7%-larger than at 3.6 µm.
Our result is 0.9σ away from the lower bound of the predictions interval; it is 1.4σ away from the upper bound. The present results are also significantly different from Tinetti et al.’s (2007b), which are obtained from a preliminary analysis of the same data set. The difference is mainly due to several effects taken into account and discussed in the present work: the bandwidth effect, the determination of the light curve baseline, and the limb darkening. All these effects have the same order of magnitude as the predicted H2O absorption and could
cause a false positive detection. In particular, the limb darkening – in this system with a large b – makes the occultation depth ℜ′
6= (Rp/R⋆)2 and impacts on the error budget.
Since this effect also depends on the wavelength, it is inaccurate to base the detection of an atmospheric signature only on the raw difference of occultation depths.
Most recent radius measurements for HD 189733b are plotted in Fig. 4. A particular comparison between the system parameters we derived in the IR and those derived by Winn et al. (2007) shows that Rp, b and R⋆ values at 3.6 and 5.8 µm are consistent with the visible
values (see Table 1). Our two radius measurements are also compatible with the value derived at 8 µm by Knutson et al. (2007b), which has a rather small uncertainty compared to ours. Our statistical uncertainty is of the same order than the one derived by Winn et
al. (2007). During the last stage of the publication of this work, new measurements in the visible have been reported by Pont et al. (2007) using the Hubble Space Telescope. Their derived system parameters are within 1 to 2σ from ours; this marginal disagreement might be explained by stellar spots in such an active K-type star observed at different epochs.
More generally, the consistency between visible and IR radii for other extrasolar planets, like HD 209458b – measured in the visible by Knutson et al. (2006a) and at 24 µm by Richardson et al. (2006) – or GJ 436b – measured in the visible by Gillon et al. (2007a) and at 8 µm by Gillon et al. (2007b) and Deming et al. (2007) –, shows that we do not yet achieve radius determination with enough accuracy in the IR to allow for a spectroscopic characterization of close-in atmospheres. The accuracy required (∼ 10−4) could be obtained
by observing several transits with the longest possible out-of-transit baseline, in order to better constrain the systematics in the transit curve. New Spitzer /IRAC observations of HD 189733b at 3.6, 4.5, and 8 µm should allow the present results to be better constrained. We thank the anonymous referee who greatly contributed to improve the paper, as well as S. Carey and V. Meadows for their help. D.K.S. is supported by CNES. This work is based on observations made with the Spitzer Space Telescope, which is operated by the Jet Propulsion Laboratory, California Institute of Technology under a contract with NASA.
REFERENCES Bakos, G. ´A., et al. 2006, ApJ, 650, 1160
Ballester, G. E., Sing, D. K., & Herbert, F. 2007, Nature, 445, 511 Bouchy, F., et al. 2005, A&A, 444, L15
Brown, T. M. 2001, ApJ, 553, 1006
Charbonneau, D., Brown, T. M., Noyes, R. W., & Gilliland, R. L. 2002, ApJ, 568, 377 Deming, et al. 2007, ApJ, submitted (arXiv:0707.2778)
Fazio, G. G., et al. 2004, ApJS, 154, 10
Fortney, J. J., & Marley, M. S. 2007, ApJ, 666, L45 Gillon, M., et al. 2007a, A&A, in press (arXiv:0705.2219) Gillon, M., et al. 2007b, A&A, submitted (arXiv:0707.2261) H´ebrard, G., & Lecavelier des Etangs, A. 2006, A&A, 445, 341 H´ebrard, G., et al. 2002, ApJS, 140, 103
Horne, K. 1986, PASP, 98, 609
Knutson, H. A., Charbonneau, D., Noyes, R. W., Brown, T. M., & Gilliland, R. L. 2007a, ApJ, 655, 564
Knutson, H. A., et al. 2007b, Nature, 447, 183
Kurucz R. 2006, Stellar Model and Associated Spectra (http://kurucz.harvard.edu/grids.html) Mandel, K., & Agol, E. 2002, ApJ, 580, L171
Morales-Calder´on, et al. 2006, ApJ, 653, 1454 Naylor, T. 1998, MNRAS, 296, 339
Pont, F., et al. 2007, A&A, submitted (arXiv:0707.1940) Reach, W. T., et al. 2006, IRAC Data Handbook v3.0
(http://ssc.spitzer.caltech.edu/irac/dh/iracdatahandbook3.0.pdf)
Richardson, L. J., Harrington, J., Seager, S., & Deming, D. 2006, ApJ, 649, 1043
Tinetti, G., Liang, M.-C., Vidal-Madjar, A., Ehrenreich, D., Lecavelier des Etangs, A., Yung, Y. L. 2007a, ApJ, 654, L99
Tinetti, G., et al. 2007b, Nature, 448, 169
Vidal-Madjar, A., Lecavelier des Etangs, A., D´esert, J.-M., Ballester, G. E., Ferlet, R., H´ebrard, G., & Mayor, M. 2003, Nature, 422, 143
Vidal-Madjar, A., et al. 2004, ApJ, 604, L69 Winn, J. N., et al. 2007, AJ, 133, 1828
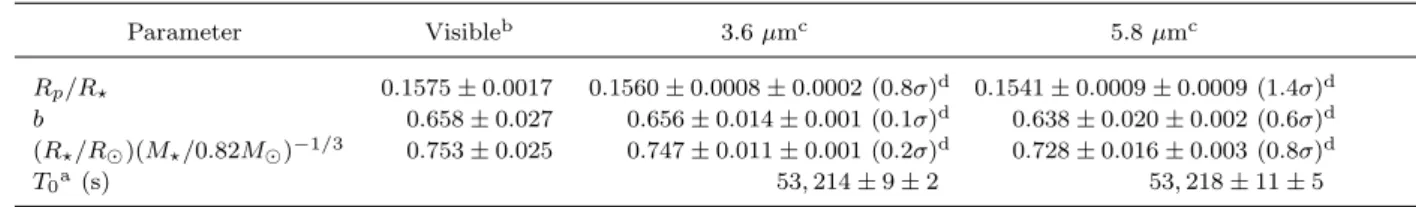
Table 1. System Parameters Parameter Visibleb 3.6 µmc 5.8 µmc Rp/R⋆ 0.1575 ± 0.0017 0.1560 ± 0.0008 ± 0.0002 (0.8σ)d 0.1541 ± 0.0009 ± 0.0009 (1.4σ)d b 0.658 ± 0.027 0.656 ± 0.014 ± 0.001 (0.1σ)d 0.638 ± 0.020 ± 0.002 (0.6σ)d (R⋆/R⊙)(M⋆/0.82M⊙)−1/3 0.753 ± 0.025 0.747 ± 0.011 ± 0.001 (0.2σ)d 0.728 ± 0.016 ± 0.003 (0.8σ)d T0a (s) 53, 214 ± 9 ± 2 53, 218 ± 11 ± 5 aGiven as T UTCS−215, 500, 000 s. b
From Winn et al. 2007.
c
This work; both statistical and systematic uncertainties are given.
Fig. 1.— Weighted light curves in channel 1 at 3.6 µm (left) and channel 3 at 5.8 µm (right). Data are rebinned by 10. The raw light curve at 3.6 µm (grey diamonds) has to be corrected for large fluctuations correlated to the ‘pixel phase’, plotted in the left lower panel. Those exposures with extreme pixel phases (beyond the dashed lines) are rejected. The corrected light curve is overplotted as black circles in the upper panel.
Fig. 2.— System parameters obtained in channels 1 (left) and 3 (right), as a function of the time from which the transit light curve is fitted. The light curves in both channels are plotted in the upper panels until the ingress. The parameters shown are, from top to bottom, Rp/R⋆, b, T0, and vorb. To correct for the decreasing drift in channel 3, the transit light curve
model can include a linear (black), quadratic (grey), or exponential (empty symbols) out-of-transit baseline. For consistency, we also applied these fitting tests to channel 1. The dispersion observed in the results is accounted for by choosing the mean of each sample (empty diamonds) and adding a systematic uncertainty equal to the standard deviation in each sample. The error bar represented in each panel accounts for the statistical and systematic errors. The contribution of the systematics is indicated by the horizontal bars.
Fig. 3.— Final light curves of HD 189733 during the Oct. 31st 2006 transit at 3.6 (top) and 5.8 µm (middle). Fits to the light curves (thick lines) are calculated from the system parameters given in Table 1. The residuals are shown below each fitted light curve. The lower panel shows a comparison between the two fits. The inlet contains a zoom on the tran-sit bottom, where our best-fits obtained without limb-darkening are superimposed (dashed lines).
Fig. 4.— Radius of the planet as a function of wavelength (upper panel), expressed in stellar radii. The two measurements at 3.6 and 5.8 µm are represented (filled diamonds) in the near IR. Both IRAC bandpasses are also indicated (grey areas). Previous measurements in the visible (Bakos et al. 2006 [square]; Winn et al. 2007 [triangle]) and in the IR (Knutson et al. (2007b [empty diamond]) are shown for comparison.