HAL Id: hal-02951459
https://hal.archives-ouvertes.fr/hal-02951459
Submitted on 30 Sep 2020HAL is a multi-disciplinary open access
archive for the deposit and dissemination of sci-entific research documents, whether they are pub-lished or not. The documents may come from teaching and research institutions in France or abroad, or from public or private research centers.
L’archive ouverte pluridisciplinaire HAL, est destinée au dépôt et à la diffusion de documents scientifiques de niveau recherche, publiés ou non, émanant des établissements d’enseignement et de recherche français ou étrangers, des laboratoires publics ou privés.
Effect of deformation on helium storage and diffusion in
polycrystalline forsterite
Rémi Delon, Sylvie Demouchy, Yves Marrocchi, Mohamed Ali Bouhifd, Julien
Gasc, Patrick Cordier, Sanae Koizumi, Pete Burnard
To cite this version:
Rémi Delon, Sylvie Demouchy, Yves Marrocchi, Mohamed Ali Bouhifd, Julien Gasc, et al.. Effect of deformation on helium storage and diffusion in polycrystalline forsterite. Geochimica et Cosmochimica Acta, Elsevier, 2020, 273, pp.226-243. �10.1016/j.gca.2020.01.018�. �hal-02951459�
Effect of deformation on helium storage and diffusion in
polycrystalline forsterite
Rémi Delon1,*, Sylvie Demouchy2, Yves Marrocchi1, Mohamed Ali Bouhifd3, Julien Gasc1,2, Patrick Cordier4, Sanae Koizumi5 and Pete G. Burnard1
1
Centre de recherches - -Nancy, France.
2 & CNRS, Montpellier, France.
3Laboratoire Magmas et Volcans, UMR 6524, Université Clermont Auvergne & CNRS, Aubière, France. 4
Univ. Lille, CNRS, INRA, ENSCL, UMR 8207 - UMET - Unité Matériaux et Transformations, F-59000 Lille, France
5
Earthquake Research Institute, University of Tokyo, Tokyo, Japan
* Corresponding author: [email protected]. Now at « Laboratoire Magmas et Volcans, UMR 6524, Université Clermont Auvergne & CNRS, 6 avenue Blaise Pascal, Aubière, France ».
Submitted to Geochimica et Cosmochimica Acta in May 2019 Revised for Geochimica et Cosmochimica Acta in January 2020 *Manuscript
Abstract 1
Although recent studies have investigated He behavior in undeformed mantle minerals, the 2
effect of defects generated by plastic deformation on He storage and transport remains 3
unconstrained. For this purpose, synthetic dense aggregates of fine-grained iron-free forsterite 4
were deformed under 300 MPa confining pressure at 950, 1050, and 1200 °C using a Paterson 5
press. Three deformed samples and one undeformed sample were then doped with He under 6
static high-pressure (1.00 ± 0.02 GPa) and high-temperature (1120 ± 20 °C) conditions for 24 7
h in a piston cylinder. Uraninite was used as a source of noble gases. The samples were 8
subsequently analyzed using a cycled step heating protocol coupled with noble gas mass 9
spectrometry to investigate He storage and diffusion in the deformed polycrystalline forsterite 10
aggregates. Results show complex diffusive behaviors that cannot be fitted by a single linear 11
regression. Nevertheless, individual step heating cycles can be fitted by several linear 12
regressions determined by a F-test, suggesting that diffusivities follow Arrhenius law within 13
the given temperature ranges. Our results highlight the complex diffusive behavior of He in 14
deformed forsterite aggregates, which is due to the competition between several diffusion 15
mechanisms related to different He storage sites (Mg vacancies, interstitial sites, dislocations, 16
and grain boundaries). Diffusion parameters (activation energy Ea and pre-exponential factor 17
D0) for He diffusion in grain boundaries were refined from literature data (Ea = 36 ± 9 kJ·mol– 18
1
and D0 = 10–10.57 ± 0.58 m2·s–1), and those of He diffusion in interstitials (Ea = 89 ± 7 kJ·mol–1 19
and D0 = 10–8.95 ± 1.16 m2·s–1) and Mg vacancies (Ea = 173 ± 14 kJ·mol–1 and D0 = 10–5.07 ± 1.25 20
m2·s–1) were defined from our results and literature data. Furthermore, we determined Ea = 56 21
± 1 kJ·mol–1 and D0 = 10–9.97 ± 0.37 m2·s–1 for He diffusion along dislocations. These results 22
suggest that a maximum He fraction of only 1.2% can be stored along dislocations in mantle 23
minerals, which is negligible compared to 22% in grain boundaries as reported by previous 24
studies. This implies that bulk lattice diffusivities are barely affected by the presence of 25
dislocations, whereas the proportion of He stored in grain boundaries can significantly 26
enhance the bulk diffusivities of mantle rocks. Thus, deformation processes can significantly 27
increase He storage capacity by decreasing grain size (i.e., via dynamic recrystallization), but 28
will not sufficiently increase the dislocation density to induce a change in He storage and 29
mobility within the crystallographic lattice. Furthermore, rapid redistribution of He between 30
the mineral lattice and grain boundaries could enhance the bulk He concentrations of 31
deformed peridotites upon equilibration with nearby undeformed (or less-deformed) 32
peridotites. 33
34
Keywords: helium, diffusion, storage, deformation, dislocation, forsterite 35
36
1. Introduction 37
The behavior of noble gases E ’ s important information and 38
essential time constraints on chemical and isotopic mantle heterogeneities. Indeed, noble 39
gases have both primordial and radiogenic isotopes and behave as both incompatible and 40
volatile elements. Although they are not expected to be easily recycled during subduction 41
processes (Moreira and Raquin, 2007; Staudacher and Allègre, 1988), several studies have 42
reported evidences for noble gas recycling in the mantle (e.g., Holland and Ballentine, 2006; 43
Parai and Mukhodopahdyay, 2015; Kendrick et al., 2018; Smye et al., 2017). Nevertheless, 44
differences in noble gas concentrations and isotopic ratios are still observed between mid-45
oceanic ridge basalts (MORBs) and ocean island basalts (OIBs), reflecting their different 46
mantle sources (see Moreira, 2013, for a review). Helium (He) is a reliable tracer of mantle 47
heterogeneities since its concentration is higher in MORBs than in OIBs (e.g., Moreira and 48
Kurz, 2013), and the 3He/4He ratio (R) normalized to the atmospheric 3He/4He ratio (Ra) is 49
homogeneous in MORBs (i.e., R/Ra = 7–9; e.g., Barfod et al., 1999), but varies from 4 (e.g., 50
Farley et al., 1991; Moreira et al., 1999) up to almost 50 in OIBs (e.g., Hilton et al., 1997; 51
Hiyagon et al., 1992; Honda et al., 1993; Kaneoka et al., 1983; Kurz et al., 1982, 1983; Rison 52
and Craig, 1983; Starkey et al., 2009; Stuart et al., 2003; Valbracht et al., 1997). This 53
dichotomy between MORBs and OIBs highlights the presence of at least two different 54
E ’ : ( ) primitive, less degassed source with low U/3
He and high 55
R/Ra ratios as the source of OIBs, and (ii) a more degassed source with higher U/3He as the 56
source of MORBs (e.g., Moreira and Kurz, 2013). 57
Although macroscopic models have been developed to explain the existence of these 58
reservoirs by isolating the OIB source from mantle convection (Allègre, 1987; Bouhifd et al., 59
2013; Coltice et al., 2011; Labrosse et al., 2007; Porcelli and Halliday, 2001), the fundamental 60
physical behavior of He in mantle minerals (e.g., storage sites, diffusion mechanisms) 61
remained poorly understood despite recent improvements. Helium can be stored in various 62
atomic defects within the crystal structure, such as 0-dimension defects (i.e., Mg vacancies 63
and interstitial sites in olivine; Delon et al., 2018), 1-dimension defects (dislocations), 2-64
dimensions defects (i.e., interfaces and grain boundaries; Baxter et al., 2007; Burnard et al., 65
2015; Delon et al., 2018), and 3-dimensions defects (i.e., inclusions; Trull and Kurz, 1993). 66
The storage of He in multiple sites induces a complex diffusive behavior due to the 67
competition between different diffusion mechanisms related to each storage site. This 68
complex diffusive behavior is shown schematically in Figure 1 by considering site-specific 69
diffusion rates depending on the relative degree of disorder of the crystalline structure in each 70
site (i.e., faster diffusion in more disordered sites). Regarding 1-dimension defects, Piazolo et 71
al. (2016) showed using atom probe tomography that incompatible elements are preferentially 72
stored along dislocations in zircon. Nevertheless, their transport along dislocations remains 73
poorly constrained. 74
Ar storage and transport in deformed minerals has been investigated in 75
thermochronological studies, which showed that bulk diffusivities increase with deformation, 76
thus decreasing Ar retention and producing younger Ar-Ar ages (Dunlap and Kronenberg, 77
2001; Heizler et al., 1997; Kramar et al., 2001; Mulch et al., 2002; Reddy et al., 1996, 1999, 78
2001). Recent studies have reported abnormally high concentrations of Ar near crystal 79
surfaces for several minerals including quartz and feldspar (Baxter et al., 2006; Clay et al., 80
2010; Kelley et al., 2008; Watson and Cherniak, 2003), olivine and pyroxene (Thomas et al., 81
2008; Watson et al., 2007), and plagioclase (Wartho et al., 2014). These high Ar 82
concentrations imply very low diffusivities that have been interpreted as representative of Ar 83
lattice diffusivities, although recent bulk degassing experiments suggest a surface effect (e.g., 84
Burnard et al., 2015; Cassata et al., 2011; Delon et al., 2019). Such surface effects in 85
mechanically prepared samples are in agreement with the study of Pinilla et al. (2012), who 86
showed that diffusivities observed in the near-surface are not representative of bulk 87
diffusivities due to the effect of interface adsorption, trapping Ar in dislocations, voids, and 88
channels. 89
Although these results confirm the storage of noble gases in 1-dimension defects, 90
abnormally high surface concentrations of He have only been observed in apatite (Van Soest 91
et al., 2011), and the behavior of He in deformed minerals remains unconstrained. In this 92
study, synthetic fine-grained polycrystalline iron-free forsterite was deformed at different 93
temperatures, then experimentally doped with He at high pressure and high temperature. We 94
analyzed the samples by step heating experiments to investigate He storage sites and diffusion 95
in mantle olivine. 96
97
2. Materials and methods 98
2.1. Starting materials and deformation experiments 99
Forsterite samples used in this study were synthetized at the Earthquake Research Institute 100
(Tokyo, Japan) from synthetic nano-powder made from colloidal SiO2 (30 nm grain size) and 101
Mg(OH)2 (50 nm grain size). The sintering procedure was previously described by Koizumi et 102
al. (2010) and is briefly summarized here. The powders were dispersed and mixed by ball 103
milling for one day at a rate of ~250 rpm using 10-mm nylon-covered balls with iron cores 104
and high-purity ethanol as a solvent. The samples were then dried at ~60 °C while stirring. 105
The resulting powder was calcinated using an alumina tube furnace at 960 °C for 3 hours 106
under an oxygen flow to remove decomposed products (H2O and CO2). The samples were 107
pulverized with an agate mortar and pelletized using tungsten carbide dies to obtain disc-108
shaped samples, which were wrapped in a rubber sleeve and evacuated with a rotary pump. 109
The compacted samples were then dropped into a water-medium pressure vessel and cold-110
pressed at 200 MPa for 10 min to produce pellets. The pellets were placed on a platinum 111
crucible or plate in an alumina tube furnace with a vacuum diffusion pump and sintered at 112
1260 °C for 2–3 h. The sintering conditions were carefully selected to maximize densification 113
and minimize grain growth. The final porosity of the pellets was well below 1 vol.% (for 114
further details, see Koizumi et al., 2010). The final products contained a low proportion 115
(<2%) of iron-free enstatite to buffer the silica activity, but this abundance is too low to 116
significantly modify the bulk diffusivities obtained during the subsequent step heating 117
experiments (see section 4.1). 118
After sintering, the four cylindrical samples (NF_SM, NF_1200-1, NF_1050-1, and 119
NF_950-1) had diameters of 4.5–4.8 mm and lengths of 7.25–10.55 mm. Three of them 120
(NF_1200-1, NF_1050-1, and NF_950-1) were used in deformation experiments performed at 121
Geosciences Montpellier (University of Montpellier, France) in a gas-medium high pressure-122
high temperature apparatus (Paterson press; Paterson, 1990; Thieme et al., 2018). These 123
samples were fit into metal sleeves (NF_1200-1, NF_1050-1, and NF_950-1 into nickel, 124
copper, and silver sleeves, respectively), placed between alumina and zirconia pistons 125
(Demouchy et al., 2014; Mei and Kohlstedt, 2000), and the assembly was encapsulated in an 126
iron jacket. Deformation experiments were performed under uniaxial compression in an 127
isostatic Ar pressure of 300 MPa at temperatures of 1200, 1050, and 950 °C for NF_1200-1, 128
NF_1050-1, and NF_950-1, respectively. Mechanical data and texture characterizations are 129
fully reported in Gasc et al. (2019). After the deformation experiments, the samples were 130
hand-polished to remove the metal sleeve and cut with a slow speed saw into millimeter-sized 131
cubes. A first part of the recovered deformed fine-grained forsterite was used as starting 132
material for doping experiments at high pressure and high temperature, and a second part was 133
prepared for scanning electron microscopy (SEM), electron backscattered diffraction (EBSD) 134
and transmission electron microscope (TEM) analyses for post-deformational grain size 135
quantification and textural and microstructural characterization. 136
SEM and EBSD analyses were performed at Geosciences Montpellier with a CamScan 137
X500FE Crystal Probe (see Demouchy et al., 2012) equipped with an EBSD system. Sample 138
sections were prepared using a standardized polishing protocol (e.g., Thieme et al., 2018) and 139
a final polishing step was performed using colloidal silica on a vibrating plate to obtain a 140
high-quality polish for EBSD observation. Operating conditions were 15–18 kV and 6 or 10 141
nA (for exposure times of 48 and 24 ms, respectively) at a working distance of 24–25 mm 142
under low vacuum conditions (5 Pa of gaseous nitrogen) to avoid charging on the sample. 143
Samples were carbon-coated and surrounded by copper-carbon conductive tape for EBSD 144
analyses. EBSD maps were acquired with a step size of 0.2 or 0.4 µm, allowing the grain size 145
distributions to be determined after data treatment (Demouchy et al., 2014; Gasc et al., 2019). 146
For TEM analyses, post-deformation pre-doped samples were doubly polished to obtain 147
30-µm-thick thin sections, and glued on a Cu grid before ion milling at 5 kV under a low 148
beam angle of 15° to reach electron transparency. The resulting foils were carbon-coated and 149
observed in a FEI® Tecnai G2-20 twin microscope operating at 200 kV at Unité Matériaux et 150
Transformations (University of Lille, France). 151
152
2.2. Doping experiments 153
The deformed (NF_1200-1, NF_1050-1, and NF_950-1) and undeformed (NF_SM) 154
samples were doped at high pressure and high temperature in the presence of a 4He source 155
following a similar protocol described in Burnard et al. (2015), which was developed to 156
mimic sub-solidus mantle conditions at low to medium noble gas partial pressure. In this 157
study, the 4He source was uraninite powder from Mistamisk, Canada (for details, see Kish and 158
Cuney, 1981). Doping experiments were performed at the Laboratoire Magmas et Volcans 159
(Université Clermont Auvergne, Aubière, France) in / ″ y . The samples were 160
hand-polished to fit in 9-mm-long Pt capsules with an outer diameter of 5 mm and an inner 161
diameter of 4.5 mm. Each sample was placed in a Pt capsule and separated from the uraninite 162
powder by two Pt discs to avoid contamination of the samples by the He source, and any 163
empty space was filled with San Carlos olivine powder, as shown in Fig. 2. The capsule was 164
then closed by welding two Pt lids at each end, loaded in a Pyrex cylinder with two MgO 165
cylinders at each end, and surrounded by MgO powder. The assembly was slid into a graphite 166
furnace and placed in a Pyrex cylinder and a NaCl sleeve to ensure efficient pressure 167
transmission and inhibit the occurrence of water (Fig. 2). Temperature was controlled and 168
monitored using a W5Re/W26Re thermocouple (C-type) at the base of the Pt capsule (Fig. 2). 169
External calibrations show a temperature gradient of less than 20 °C along the Pt capsule. The 170
samples were annealed at 1120 ± 20 °C and 1.00 ± 0.02 GPa for ~24 h, and were quenched at 171
high pressure. This long annealing stage at T>1100 °C and 1 GPa ensures complete collapse 172
of residual porosity (from hot press at 300 MPa), closing up potential open grain boundaries 173
(from grain sliding, see Gasc et al., 2019) and providing further dense sintering. At 1100 °C 174
and after 24 h only, intracrystalline ductility features are expected to be preserved (Farla et, 175
2011). After the doping experiments, the samples were extracted from the capsules and cut 176
into millimeter-sized cubes. For each sample, a single cube from the core was carefully 177
selected to ensure that residual uraninite was not present during the subsequent noble gas 178
analyses. Experimental conditions are summarized in Table 1. 179
180
2.3. Helium analyses 181
Helium analyses were performed using a cycled step heating protocol coupled with noble 182
gas mass spectrometry, as detailed in Delon et al. (2018). Samples were annealed at different 183
temperature steps and the gas extracted during each heating step was analyzed to obtain the 184
molar quantity of He released, which permits calculation of the fractional gas loss and thus of 185
the diffusion coefficient (D) as a function of the square of the radius of the diffusion domain 186
(a). The corresponding equations were modified from Crank (1975), Fechtig and Kalbitzer 187
(1966), and McDougall and Harrison (1999), and are presented in detail in Delon et al. 188
(2018). Since D is related to temperature (T) by an Arrhenius equation, D = f(1/T) (or D/a2 if 189
a is unknown) permits to obtain (i) the activation energy (Ea), and (ii) the pre-exponential 190
factor (D0 or D0/a2 if a is unknown). Although the equations used to determine D were 191
developed considering a homogeneous initial concentration in the sample, Delon et al. (2018) 192
have already redeveloped them for heterogeneous initial concentration profiles. They reported 193
no major change in the resulting diffusion parameters (within the error bars). Thus, even if 194
samples were only partially doped, it does not impact the diffusion parameters calculated in 195
this study. 196
Step heating analyses were performed at the Centre de Recherches Pétrographiques et 197
Géochimiques (CNRS, Université de Lorraine, Nancy, France) using a Helix MC mass 198
spectrometer, which was calibrated using aliquots (~0.3 cc, ~1.57 × 10⁻⁸ mol) of an in-house 199
He standard (for further details, see Matsuda et al., 2002). The 4He signal was collected on a 200
Faraday cup coupled with a 1011 Ω amplifier. A standard analysis was performed between 201
each sample analysis, and the analytical sensitivity was calculated and used to obtain the 202
molar quantity of He extracted during each heating step. The external error determined from 203
these sensitivities was less than 8%, which represents a maximum external error of ±0.04 on 204
the resulting log(D/a2) values. Samples were loaded into a filament furnace, which consists of 205
four alumina-coated tungsten evaporation baskets welded to two nickel rods as described in 206
Bekaert et al. (2018). The furnace was calibrated by the melting points of tin, aluminum, 207
copper and nickel, and the calibration curve (temperature as a function of the current) was 208
obtained by second-order polynomial regression on the melting points. Before sample 209
loading, the filament was degassed at ~1600 °C under high vacuum for 1 h to remove any 210
adsorbed atmospheric gases. A blank analysis was performed at ~1400 °C before sample 211
introduction (releasing 8.69 × 10⁻¹⁵ mol of He), and a cold blank analysis was performed for 212
each sample: the molar quantities extracted during cold blank analyses represented less than 213
10% (~2.90 × 10⁻¹⁵ mol) of those extracted during each heating step. Because of high blank 214
signals, sample NF_1200-1 was degassed under vacuum for 1 h at 800 °C before the step 215
heating experiments to remove any gas adsorbed onto the sample surface, which greatly 216
improved the blank signals. During this degassing step, He was lost and not analyzed, which 217
can modify the initial He concentration profile of the sample. Nevertheless, a change in the 218
initial concentration profile does not modify the resulting diffusion parameters (Delon et al., 219
2018). At each heating step, the temperature was held for 30 min, and the extracted gas was 220
purified and analyzed, background and blank corrections were performed. Step heating 221
experiments were cycled, meaning that each sample underwent several step heating sequences 222
(cycles). A cycle consists in increasing the temperature between two heating steps, whereas 223
the temperature is decreased at the end of a cycle to perform a second cycle on the same 224
sample, and so on. This protocol is used in thermochronology to identify diffusion domains 225
that are not replenished (e.g., Reiners and Farley, 1999; Reiners et al., 2004) and has proved 226
efficient for characterizing He storage sites in polycrystalline olivine (Delon et al., 2018). 227
Individual step sequences are presented in Table 1. At the end of the cycled step heating 228
experiments, the samples were fused at above 2000 °C and the extracted gas was analyzed to 229
determine the total amount of He stored in the corresponding sample, and to back-calculate 230
the fractional gas loss during each temperature step. 231
232
3. Results 233
3.1. Textures and microstructures 234
Representative SEM and TEM images of pre-doped samples are displayed in Fig. 3, and 235
additional images are available in Gasc et al. (2019). The average grain sizes determined from 236
EBSD maps are reported in Table 1 and only slightly decreased during the deformation 237
experiments. Grain size variations are expected to be negligible during the doping 238
experiments since the diffusion length of silicon is only 0.56 nm in dry olivine (Dohmen et 239
al., 2002) and 47 nm in wet olivine (Costa and Chakraborty, 2008) at the conditions of the 240
doping experiments (i.e., 1120 °C and 24 h). SEM images of the four pre-doped samples 241
show granoblastic textures with equilibrated triple junctions (Fig. 3a–d). Grain boundaries are 242
mostly straight in samples NF_SM, NF_950-1, and NF_1050-1, whereas they are 243
occasionally slightly curved in NF_1200-1. All samples have low porosities. Porosity appears 244
to be more important in samples deformed at low temperature because they show grain 245
boundaries opened by sliding, which creates voids during the deformation experiments (Gasc 246
et al., 2019). If preserved during annealing at 1GPa, these 3-dimensions defects can trap noble 247
gases during doping experiments, and their release can significantly impact the calculated 248
diffusivities obtained during the step heating experiments. However, no gaps and voids are 249
expected to subsist under 1 GPa (e.g., German, 2014). Furthermore, several grains in the 250
deformed samples showed internal contrast variations, highlighting the formation of subgrain 251
boundaries (i.e., walls of dislocations), demonstrating that intracrystalline ductile deformation 252
occurred (Fig. 3b–d). 253
TEM images show microstructures typical of deformed samples (i.e., straight dislocations, 254
few dislocation loops, sub grain boundaries, Fig. 3e–h). These microstructures are mainly 255
heterogeneous and due to microplasticity. Rare nanobubbles were also observed, which could 256
act as a trap for He during doping experiments. In summary, the deformation experiments 257
successfully involve 1-, 2-, and 3-dimensions defects (i.e., dislocations, subgrains, grain 258
boundaries, and nanobubbles, respectively). We calculated the dislocation density ( in m-2, 259
i.e., total length of dislocations in a unit volume of a crystal) for each deformed sample using 260
Ham’ (1961) method, which consists in drawing straight lines of cumulative length L in 261
random directions on a TEM image and counting the number of dislocations (N) intersecting 262
these lines. Using the sample thickness e (i.e., ~200 nm), dislocation density is estimated as: 263
(1)
We applied this method for four TEM images for sample NF_950-1, one for NF_1050-1, and 264
three for NF_1200-1, which were selected as being characteristic of the samples. The results 265
confirm high dislocation densities for each deformed sample with mean values of 2.3 ± 1.2 × 266
1013 m–2 for NF_950-1, 8.1 × 10¹³ m–2 for NF_1050-1, and 5.8 ± 1.5 × 10¹³ m–2 for NF_1200-267 1. 268 269 3.2. Helium diffusivity 270
Helium diffusivities are reported in Fig. 4 and the detailed data treatment is provided in 271
supplementary file. The results show diffusive behavior that does not follow a single 272
Arrhenius law since abrupt changes in slope occur in each Arrhenius diagram. Thus, our data 273
cannot be fitted with only one linear regression, suggesting different diffusion mechanisms at 274
different temperature ranges. The best fit of our data by one, two, or three linear regressions 275
and the associated transition temperatures were determined using F-tests on each cycle. 276
Further details and results of the F-tests are available in supplementary material. The F-test is 277
used to compare two models, and if the resulting F value is greater than the critical F value 278
(available in F tables), the model with the fewest parameters is rejected. Otherwise, we chose 279
the simpler model with the fewest parameters to fit our data (e.g., Box, 1953; Chow, 1960; 280
Hahs-Vaughn and Lomax, 2013). For each cycle, we performed a F-test between a single 281
linear regression (model 1) and all possible fits with two linear regressions (model 2, 282
excluding all linear regressions fitted with less than three data points as irrelevant). If model 1 283
was rejected, we compared the best-fit model with two linear regressions to models with three 284
linear regressions, and so on. In the case where several models resulted in rejecting the 285
comparative model, we chose the model with the greatest F value as the comparative model in 286
subsequent tests or as the best fit to our data. 287
The linear regressions resulting from the F-tests are plotted in Fig. 4. The resulting 288
diffusion parameters (Ea and D0 as a function of a2) are reported in Table 2 and vary widely: 289
Ea varied from 3 ± 6 to 330 ± 29 kJ·mol–1 and log(D0/a2) (D0 in m2·s–1 and a in m) from –9.44 290
± 0.82 to 7.98 ± 1.29. This variation suggests a complex behavior of He diffusion in 291
polycrystalline forsterite, with competition between different diffusive processes. However, 292
since models with several linear regressions can fit our data, we can reasonably assume that 293
diffusivities follow Arrhenius equations over the temperature ranges determined from the F-294
tests. These results were obtained by excluding some data points (open symbols in Fig. 4) at 295
very low temperature (one each for NF_SM and NF_950-1) and at very high temperature (one 296
for NF_950-1 and two for NF_1050-1) because they were considered as being distinctly 297
different from the trend described by the nearby points. 298
299
4. Discussion 300
4.1. Mechanisms of He diffusion 301
The results of the F-tests show that models with several linear regressions for each cycle 302
are the most relevant to fit our data. Thus, He diffusivity in our samples is complex, arising 303
via competition between different diffusion mechanisms. Several hypotheses may explain 304
why the diffusivities do not follow a single Arrhenius law: (i) the presence of a multi-305
diffusion domain (e.g., Harrison and Lovera, 2014; Lovera, 1992; Lovera et al., 1989), (ii) a 306
competition between intrinsic and extrinsic diffusion at the atomic scale (e.g., Chakraborty, 307
1997, 2008; Dohmen, 2008; Dohmen and Chakraborty, 2007), or (iii) a contribution of 308
different diffusion mechanisms related to different storage sites, as has been observed for 309
hydrogen (Demouchy, 2010; Mackwell and Kohlstedt, 1990; Padrón-Navarta et al., 2014; 310
Thoraval and Demouchy, 2014), He, and Ar diffusion in undeformed polycrystalline olivine 311
(Burnard et al., 2015; Delon et al., 2018, 2019). Because Ea values vary among linear 312
regressions and transition temperatures differ between samples and even cycles, we favor the 313
third hypothesis (see also Delon et al., 2018). 314
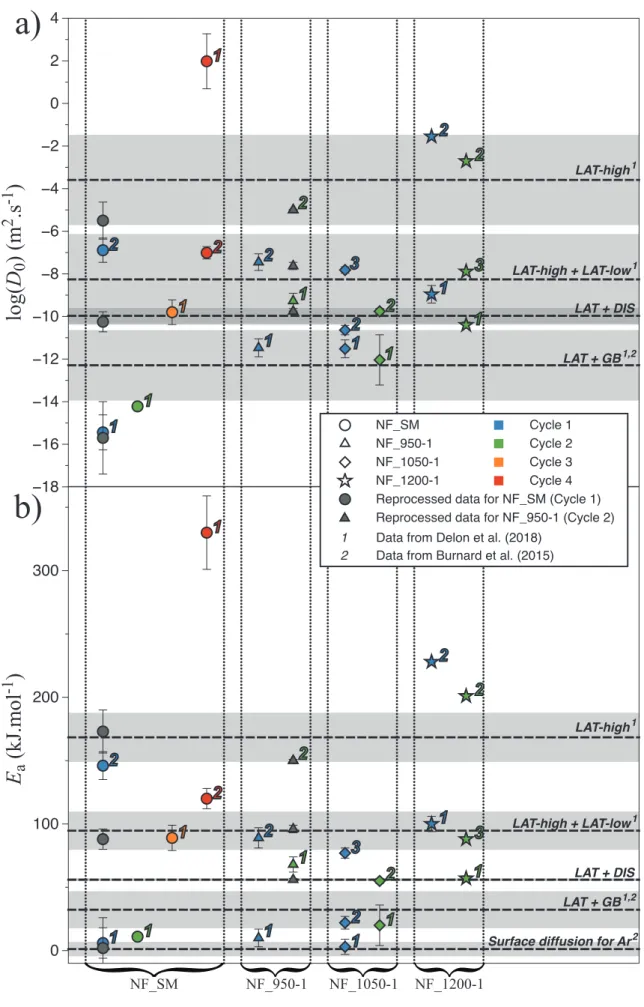
To confirm this hypothesis, we compare the diffusion parameters calculated from this 315
study (Ea and logD0) to those obtained for the different diffusive mechanisms observed in 316
Burnard et al. (2015) and Delon et al. (2018) in Fig. 5. To calculate logD0, a was chosen as 317
half the sample size during the step heating experiments (i.e., 1 mm in this study), as was 318
previously demonstrated in Delon et al. (2018). We follow the same usage as Delon et al. 319
(2018) with LAT-high referring to diffusion in Mg vacancies, LAT-low to diffusion in 320
interstitial sites, LAT to diffusion in the crystal lattice (i.e., LAT = LAT-high + LAT-low), 321
and GB to grain boundary diffusion; when bulk diffusion is controlled by diffusion in several 322
storage sites (co-governance), the implicated diffusions are separated by the + sign. The 323
formalisms of these different diffusive mechanisms are displayed in Table 3. The above 324
studies showed that He diffusion in polycrystalline olivine occurs via LAT-high, LAT-high + 325
LAT-low, and LAT + GB mechanisms, and we show the mean values (and the standard 326
deviations) over which those mechanisms were reported to occur in Fig. 5. Most of the Ea and 327
logD0 values from this study plot within those ranges, suggesting that LAT-high, LAT-high + 328
LAT-low, and LAT + GB mechanisms were also observed in our diffusion experiments. 329
Thus, the apparent non-Arrhenian behavior is due to diffusion mechanisms related to different 330
storage sites, and transitions occurred upon the depletion of He in a storage site. 331
However, some diffusion parameters obtained herein clearly differ from those of the 332
LAT-high, LAT-high + LAT-low, and LAT + GB mechanisms. Some Ea values are below the 333
LAT + GB range (i.e., <11 kJ·mol–1); these values seem to agree with those reported by 334
Burnard et al. (2015) for Ar surface diffusion in olivine. Although the species are different, 335
comparison between He and Ar surface diffusion is relevant in terms of Ea, but not in terms of 336
D0. Indeed, the Ea for He surface diffusion is expected to be lower than that for LAT + GB 337
mechanisms since He is only retained by Van der Waals bonds (i.e., low-energy interactions) 338
at the sample surface. Furthermore, a low Ea value and one consistent with LAT + GB 339
diffusion were obtained at lower and higher temperatures, respectively, during the same cycle 340
(NF_1050-1, cycle 1, Figs. 4 and 5), demonstrating that this low Ea mechanism (surface 341
diffusion) is distinct from the LAT + GB mechanisms, and not simply LAT + GB diffusion 342
with an abnormally low Ea. 343
Two Ea values (NF_SM, cycle 1, and NF_950-1, cycle 2) are near the lower limit of the 344
LAT-high range. Instead of interpreting these as the LAT-high mechanism, we rather propose 345
that the corresponding linear regressions were influenced by both the high and the LAT-346
high + LAT-low mechanisms. Indeed, Delon et al. (2018) demonstrated that a single 347
regression encompassing these two mechanisms induced Ea and logD0 values between those 348
for the LAT-high and LAT-high + LAT-low mechanisms (as in Blard et al., 2008; Cherniak 349
and Watson, 2012), whereas performing two linear regressions on the same data points (one at 350
lower temperature and another at higher temperature) returns values in agreement with those 351
of the separate LAT-high and LAT-high + LAT-low mechanisms. We tested this by 352
reprocessing these data points using three linear regressions instead of two (detailed results 353
are reported in Table 2). Although the two-linear regression models presented for these 354
samples in Fig. 4 were not rejected by the F-tests, the models with three linear regressions 355
seem more suitable since the reprocessed data show diffusion parameters consistent with the 356
distinct ranges of LAT-high and LAT-high + LAT-low mechanisms. 357
Diffusion parameters calculated from cycle 4 of sample NF_SM do not seem to correlate 358
with data from previous studies. This cycle was characterized by an abrupt increase of He 359
release, inducing first a high Ea (~330 kJ·mol–1) then a moderate Ea (~120 kJ·mol–1). A 360
similar burst in noble gas release was observed for Ar in pyroxenes and occurs upon early 361
partial melting of the sample (Cassata et al., 2011). However, early partial melting of olivine 362
has never been reported below 1100 °C (under a pressure of 1-atm, Jaoul et al., 1987). 363
Alternatively, He trapped in 3-dimensions defects (i.e., pores, voids) could significantly 364
increase the release of He (and thus the resulting diffusivities), especially at high temperature. 365
Indeed, the high Ea reported by Trull and Kurz (1993) for He diffusion in olivine has been 366
interpreted as an energy of remobilization of He trapped in melt inclusions (e.g., Blard et al., 367
2008; Cherniak and Watson, 2012; Tolstikhin et al., 2010), highlighting the high-temperature 368
dependency of this release. Thus, a minor contribution of He trapped in pores can 369
significantly increase the apparent He release at high temperature and thus the resulting 370
diffusivities, as observed in the diffusivities obtained for cycle 4 of sample NF_SM (Fig. 4). 371
A similar event could also explain the abnormal Ea values obtained for sample NF_1200-1; 372
two values are well above the LAT-high range, and another obtained at the highest 373
temperature range is abnormally low and thus does not actually correspond to LAT-high + 374
LAT-low mechanisms. Another possibility to explain these abnormal diffusion parameters is 375
the presence of enstatite in our samples. Indeed, orthopyroxene is more Ar-retentive than 376
olivine since Ar diffusivities in orthopyroxene are significantly smaller than those in olivine 377
(e.g., for orthopyroxene, see Cassata et al., 2011; for olivine, see Futagami et al., 1993; Delon 378
et al., 2019), and this difference decreases with increasing temperature: for Ar, at 400 °C, 379
logD ~ –19.92 in olivine and –30.03 in orthopyroxene, whereas at 1200 °C, logD ~ –12.93 380
and –14.40 in olivine and orthopyroxene, respectively, with D in m2·s–1). We note that similar 381
diffusive behavior is expected for He in olivine and orthopyroxene, and thus a relatively small 382
He release from enstatite is predicted at low temperature whereas enstatite can significantly 383
contribute to the He release at high temperature, resulting in enhanced calculated diffusivities, 384
as shown in Fig. 4. A final explanation to interpret these high activation energies could be the 385
absence of iron in our samples compared to those in Delon et al. (2018). Indeed, the 386
incorporation of iron was proposed to impact the strength of olivine and the incorporation of 387
hydrogen in olivine at pressure below 1 GPa (Zhao et al., 2001, 2009). The substitution of Mg 388
by Fe3+ should create additional vacancies and enhance transport properties such as ionic 389
diffusion (Nakamura & Schmalzried, 1984). Thus, it should decrease the activation energy. 390
Although some activation energies are higher in this study than in Delon et al. (2018) for 391
diffusion in Mg-vacancies, this is not systematically true, suggesting that an increase in 392
activation energy is not due to the absence of iron the crystal lattice. An explanation for the 393
consistent absence of iron effect could be that the number of defects created by the 394
substitution of magnesium by iron is too low to significantly modify the mean distance 395
between two Mg-vacancies and thus, the activation energy. 396
A last set of diffusion parameters observed only in deformed samples (NF_950-1, 397
NF_1050-1, and NF_1200-1) remains unexplained. The values of these diffusion parameters 398
are similar among the three samples, with mean values of Ea = 56 ± 1 kJ·mol –1
and logD0 = – 399
9.97 ± 0.37 (D0 in m2·s–1). Although the pre-exponential factors are in the high + LAT-400
low range, the Ea values plot between the LAT-high + LAT-low and LAT + GB ranges. As 401
these diffusion parameters occurred only in deformed samples, they are interpreted as 402
corresponding to the combined contribution of lattice diffusion and diffusion along 403
dislocations (LAT + DIS). Indeed, the Ea values suggest that the corresponding storage site is 404
less retentive than the crystal lattice but more than grain boundaries, and are thus associated 405
with dislocations that occur in deformed samples. To investigate the He amount stored along 406
dislocations in our samples, the approximation that He extracted during heating steps, which 407
expressed the LAT + DIS mechanisms, can be done. It yields that 5.79 × 10⁻¹³, 1.86 × 10⁻¹¹, 408
and 1.99 × 10⁻¹² mol of He are stored along dislocations for NF_950-1, NF_1050-1, and 409
NF_1200-1, respectively. Nevertheless, since each sample was doped separately with 410
different starting amount of He, it is difficult to determine if these amounts represent solely a 411
difference in dislocation density or results also from the experimental run conditions. For 412
these reasons, He storage as a function of the absolute density in dislocations in our samples 413
will not be discussed any further. 414
415
4.2. Diffusion along dislocations 416
Here, we extract the diffusivities along dislocations from the bulk diffusivities expressed 417
in the LAT + DIS temperature range for deformed samples. Similar to grain boundary 418
diffusion, bulk diffusivities resulting from the combined contribution of lattice diffusion and 419
diffusion along dislocations can express three kinetic regimes (e.g., Harrison, 1961; Lee, 420
1995): the A-regime is mainly controlled by diffusion in the crystal lattice, the C-regime is 421
controlled only by diffusion along dislocations, and the B-regime is the intermediate case (for 422
further details on these kinetic regimes applied to grain boundary diffusion, see Dohmen and 423
Milke, 2010; Joesten, 1991; Mishin and Herzig, 1995, 1999). These kinetic regimes evolve 424
with diffusion time from the type C to the type B and ultimately to the type A regime. Thus, it 425
is important to constrain which kinetic regime occurred in our diffusion experiments to 426
identify the diffusion mechanism controlling the bulk diffusivities. The A-regime occurs for 427
diffusion times (t) significantly higher than the boundary time (td), defined as: 428
(2)
where ld is the mean spacing between dislocations (ld = ) and DLAT the lattice diffusion 429
coefficient. In our samples, ld = 209, 111, and 131 nm in NF_950-1, NF_1050-1, and 430
NF_1200-1, respectively. At 400 °C (the lowest temperature step), these dislocation spacings 431
yield td = 78, 22, and 31 s for NF_950-1, NF_1050-1, and NF_1200-1, respectively, by 432
considering the mean values of the lattice diffusion parameters obtained by Delon et al. 433
(2018) and herein for the LAT-high + LAT-low mechanisms. Thus, td is significantly shorter 434
than the extraction duration during a heating step (1800 s), which means that the A-regime 435
always occurred in the step heating experiments when the LAT + DIS mechanisms was 436
expressed. In the A-regime, the bulk diffusion coefficient Dbulk can be calculated as a function 437
of the diffusion coefficient along dislocations (DDIS) and the lattice diffusion coefficient as: 438
(3)
where is the fraction of the diffusing atoms that are located along dislocations. However, 439
this equation was first derived by Hart (1957), but was developed assuming an equilibrium 440
model in which the transfer of the diffusing species is in equilibrium at a local scale (Lee, 441
1995). Since our samples were partially doped, this assumption may not hold, and we will not 442
extract DDIS using Eq. (3). 443
Although theory predicts that the A-regime is expressed during the step heating 444
experiments, the consistency of the Ea and log(D0) values expressed by the deformed samples 445
mechanism here, diffusion along dislocations. To verify this hypothesis, we compared the 447
mean values of Ea and logD0 expressed in the LAT + DIS temperature range with those of 448
diffusion along grain boundaries, in interstitial sites and in Mg vacancies (Fig. 6). Grain 449
boundary diffusion parameters are from Delon et al. (2018), obtained using the same method, 450
except that we performed a linear regression on four data points (instead of five) because the 451
lowest temperature diffusivity of their sample RDPC150 does not describe the same trend as 452
the other diffusivities expressing grain boundary diffusion: this reprocessing of the two data 453
sets (Delon et al., 2018 and this study) yields Ea = 36 ± 9 kJ·mol–1 and logD0 = –10.57 ± 0.58. 454
For diffusion in interstitial sites and in Mg vacancies, we use the mean values of the diffusion 455
parameters expressed in the LAT-high + LAT-low and LAT-high temperature ranges, 456
respectively, from Delon et al. (2018) and herein, leading to Ea = 89 ± 7 kJ·mol –1
and logD0 = 457
–8.95 ± 1.16 for diffusion in interstitials and Ea = 173 ± 14 kJ·mol–1 and logD0 = –5.07 ± 1.25 458
for diffusion in Mg vacancies. The diffusion equations corresponding to each diffusion 459
mechanism are displayed in Table 3. According to Fig. 6, the diffusivities expressed in the 460
LAT + DIS temperature range are bracketed between grain boundary and lattice diffusivities 461
for temperatures between 400 °C (i.e., below mantle temperatures) and 1400 °C (the highest-462
temperature boundary of the olivine stability field; e.g., Akaogi et al., 1989). Only at high 463
temperature do Mg vacancy diffusivities exceed those of the other mechanisms. Thus, the 464
diffusivities obtained in the LAT + DIS temperature range are characteristic of a diffusion 465
mechanism in a storage site with a level of structure/disorder comprised between those of 466
point defects (i.e., interstitials, Mg vacancies) and 2-dimensions defects (i.e., grain 467
boundaries). Then, the logical possibility for this storage site is dislocations (1-dimension 468
defects) in the deformed samples. We thus interpret the diffusion coefficients obtained in the 469
LAT + DIS temperature ranges as representative of diffusion along dislocations with the 470
mean diffusion parameters Ea = 56 ± 1 kJ·mol–1 and logD0 = –9.97 ± 0.37. The enhancement 471
of He diffusion along dislocations is very modest as shown by Figure 6, except at very low 472
temperature (below ca. 600 °C). Dislocations are often considered to be short circuit diffusion 473
paths. Indeed, a recent measurement of impurity diffusivity along a single dislocation in 474
aluminum has demonstrated a diffusivity enhancement of almost three orders of magnitude as 475
compared with bulk diffusion (Legros et al. 2008). However, the situation varies strongly 476
from a system to another since in SrTiO3, Marrocchelli et al. (2015) report no significant pipe 477
diffusion of oxide ions at dislocation cores. In olivine, little data are available. Wolfenstine 478
(1990) has interpreted low temperature creep data in single crystal of dry olivine based on the 479
role of pipe diffusion. Gérard and Jaoul (1989) found no enhancement of oxygen diffusion by 480
dislocations in San Carlos olivine, however, Yurimoto et al. (1992) reported diffusivities 481
along dislocations for oxygen 104 times faster than lattice diffusivities in forsterite. To date, 482
no diffusivity data are available for the role of dislocations on silicon diffusion, which is 483
expected to be the creep rate limiting species. Our measurements represent the first indication 484
of the role of dislocations on impurity diffusion in forsterite with a small effect on He 485
diffusion, except at very low temperatures. 486
Nevertheless, at high temperature, diffusion in Mg vacancies shows higher diffusivities 487
than the other diffusion mechanisms, contrary to what is expected. Diffusion in Mg vacancies 488
might be more affected by increased pressure than the other diffusion mechanisms. Although 489
no pressure effect has been observed up to 2.7 GPa for He lattice diffusion in olivine 490
(Cherniak and Watson, 2012), first-principles calculations predict an influence up to 14 GPa 491
(Wang et al., 2015), resulting in decreased diffusivity with increasing pressure. These results 492
are in agreement with changes in Ni and Mn diffusivities in olivine with increasing pressure 493
reported by Holzapfel et al. (2007). Since the compressibility of polyhedra increases with 494
their size in the olivine lattice (e.g., Andrault et al., 1995), a similar assumption can be made 495
for He storage sites in the olivine lattice. Thus, Mg sites should be more affected by 496
compression than interstitial sites, implying a greater decrease of He diffusivities via Mg 497
vacancies with increasing pressure than via interstitials. 498
499
4.3. Implications for the Earth’s upper mantle 500
To assess the implications of He storage along dislocations within the olivine stability 501
field (i.e., until 410 km depth; Akaogi et al., 1989; Katsura et al., 2004) and assuming that 502
dislocation creep controls olivine plastic deformation in the entire upper mantle, we have 503
calculated the amount of He stored in dislocations compared to that stored in the crystal 504
lattice. This proportion ( ) can be defined as a function of the partition coefficient between 505
dislocations and the lattice (Kdis/lat) and the volume fraction of dislocations ( DIS ) as 506 demonstrated by Lee (1995): 507 (4)
Although Kdis/lat is not known, it must be greater than 1 since He is an incompatible element 508
(e.g., Heber et al., 2007; Jackson et al., 2013) and less than 105 (the highest value of the He 509
partition coefficient between a silicate melt and the olivine lattice, see Delon et al., 2018). 510
Thus, to obtain the maximum fraction of He stored along dislocations, we chose the 511
maximum value of 105 for Kdis/lat. The value of DIS can be determined from the dislocation 512
density ( ), which is between 1010
and 1012 m–2 in the deformed lithospheric mantle (e.g., 513
Gueguen and Darot, 1980; Wallis et al., 2019), and the radius of the dislocation core (r) as 514
(Lee, 1995). For lithospheric mantle conditions, the maximum fraction of He 515
stored along dislocations can be calculated for = 1012
m–2. This yields a maximum value of 516
of 1.2% for r = 2 Å (e.g., Durinck et al., 2007; Mahendran et al., 2017), meaning that only a 517
negligible fraction of He (< . %) b E ’ 518
mantle. 519
Concerning diffusion, the maximum value of td is obtained from Eq. (2) by considering a 520
temperature of 900 °C (a realistic minimum lithospheric mantle temperature) and a low 521
value. However, is only available in the literature for deformed peridotites with a minimum 522
value of 1010 m–2 (e.g., Gueguen and Darot, 1980). Nevertheless, at 900 °C, td is greater than 523
1 yr for < 106
m–2 and td > 1 kyr for < 103 m–2. Thus, we can conclude that at geological 524
time scales, the A-regime (which is expressed for durations greater than td) always prevails in 525
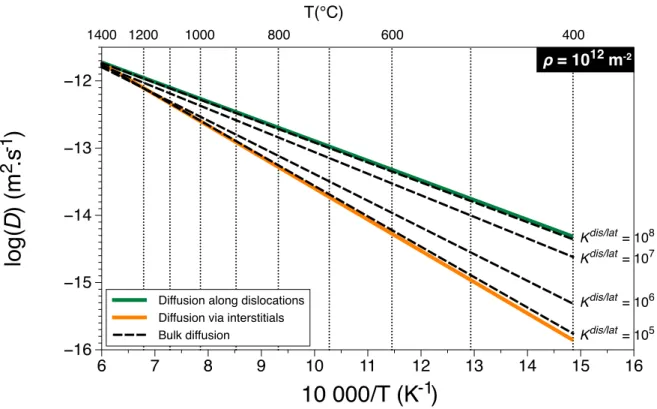
E ’ . Equation (3) can then be used to estimate bulk diffusivities in mantle 526
minerals as a function of and Kdis/lat
. The influence of Kdis/lat is reported in Fig. 7 for a 527
maximum value of of 1012
m–2,and the influence of on bulk diffusivities is shown in the 528
supplementary material for a reasonable Kdis/lat value of 104. Bulk diffusivities increase with 529
both Kdis/lat and , but even at the maximum value of observed in natural deformed 530
peridotite (i.e., 1012 m–2), Kdis/lat must be greater than 105 to significantly increase bulk 531
diffusivities relative to lattice diffusivities. Moreover, the difference between bulk and lattice 532
diffusivities decreases with increasing temperature, suggesting that bulk diffusivities are 533
similar to lattice diffusivities in deformed mantle minerals. 534
Furthermore, Delon et al. (2018) demonstrated that a significant amount of He can be 535
stored in grain boundaries (~22% at a grain size of 1 mm), enhancing the bulk diffusivities of 536
mantle rocks. These results are highly dependent on grain size, implying that mantle 537
deformation could significantly modify both the He storage capacity and bulk He diffusivities 538
by grain size sensitive processes such as dynamic recrystallization (e.g., Kurz et al., 2009; 539
Recanati et al., 2012). Indeed Kurz et al., (2009) reports a striking increase of He 540
concentration as a function of the textures (from protogranular to mylonite) in rocks from St 541
Paul Archipelago. However, the resulting dislocation density is not high enough to influence 542
the storage and diffusive behavior of He in the mineral lattice of mantle rocks. Thus, the 543
potential grain size reductions induced by dynamic recrystallization could result in a 544
redistribution of He between the mineral lattice and the grain boundary network to preserve a 545
segregation factor of around 105 between grain boundaries and crystal lattice (Baxter et al., 546
2007; Delon et al., 2018). Two processes could play a role in such a He redistribution: (i) the 547
diffusion of He through the crystal lattice and (ii) the motion of He-rich dislocations toward 548
grain boundaries. At 800 °C, the velocity of He in olivine by diffusion process is around 50 549
nm·s–1, significantly higher than the mobility of dislocations under stresses characteristic of 550
deformed peridotites (i.e., stresses between 10 and 200 MPa; e.g., Gueguen and Darot, 1980), 551
which is less than 10 nm·s–1 (Idrissi et al., 2016). Therefore, diffusion is the dominant process 552
redistributing He between the olivine lattice and grain boundaries during plastic deformation. 553
This process is very efficient since grain boundaries are equilibrated with olivine lattice in 554
less than 3 hours at 800 °C at a grain size of 1 mm. 555
Nevertheless, the potential increased storage capacity of grain boundary network induced 556
by dynamic recrystallization and grain size reduction does not imply an increase of bulk 557
concentration, but only a redistribution of He between grain boundaries and the crystal lattice 558
with respect to the segregation factor. To increase bulk concentrations, a homogenization 559
must occur between the concentrations in grain boundaries (and thus in the crystal lattice to 560
preserve the segregation factor) of rocks affected by dynamic recrystallization and those of 561
nearby undeformed peridotites. To test this hypothesis in upper mantle rocks, we refer to 562
Recanati et al. (2012), who studied the He abundance in protomylonites from a mantle shear 563
zone (Josephine Peridotite, Oregon, USA) considered to be the remnant of a back-arc basin 564
(e.g., Harper, 1984) or a fore-arc setting (e.g., Kelemen and Dick, 1995). The authors 565
observed an abnormally high He concentration in a sample with a reduced grain size (~285 566
µm) compared to adjacent rocks (average grain size of 710 µm). They interpreted this high He 567
concentration as resulting from a higher volume fraction of grain boundaries, suggesting that 568
the sample was in equilibrium with coarser-grained peridotites (i.e., with similar He 569
concentrations in grain boundaries and the crystal lattice). To calculate the lattice (CLAT) and 570
grain boundary (CGB) concentrations in these two rocks of different grain size, we perform a 571
mass balance calculation by considering that the total He amount is equal to the combined 572
amount of He stored in the crystal lattice and in grain boundaries. Based on the segregation 573
factor between grain boundaries and the crystal lattice (s), and the volume fraction of grain 574 boundaries ( GB ), we obtain: 575 (5)
The value of s is taken as 105, as observed by Baxter et al. (2007) in diopside and suggested 576
by Delon et al. (2018) in olivine, and GB = 2.84 /d with = 0.75 nm being the grain 577
boundary width and d the grain size of the sample (Hiraga and Kohlstedt, 2009). We obtain 578
CLAT = 1.69 ± 0.40 × 10⁻¹² mol·g–1 for protomylonites with a grain size of 710 µm and CLAT = 579
2.98 ± 0.20 × 10⁻¹² mol·g–1 for the sample with a grain size of 285 µm (for respective Cbulk 580
values of 2.20 ± 0.52 × 10⁻¹² and 5.20 ± 0.35 × 10⁻¹² mol·g–1). Thus, the crystal lattice of the 581
sample with a reduced grain size is enriched in He by almost a factor of two compared to the 582
other samples, suggesting that dynamic recrystallization followed by homogenization with 583
nearby rocks is not the sole mechanism responsible for the observed He enrichment. Even if 584
this process can enhance bulk concentrations, a value of s around 106 is required to observe 585
the increased concentration reported by Recanati et al. (2012). Instead, fluid percolation 586
coupled with deformation could better explain the observed He enrichment. Indeed, fluid 587
circulation is expected in back-arc basins and fore-arc settings, and it is reasonable to assume 588
that this circulation occurs preferentially in deformed zones where percolation is easier due to 589
the higher volume fraction of grain boundaries. 590
591
5. Conclusions 592
The diffusivities we obtained on three deformed samples and one undeformed sample 593
allow new constraints on He storage and mobility in polycrystalline rocks. 594
Diffusivities cannot be explained by a single linear regression, suggesting that they do not 595
follow a single Arrhenius law in deformed polycrystalline forsterite. However, each step 596
heating cycle can be fitted by several linear regressions depending on the temperature 597
range (and constrained by a F-test), highlighting that diffusivities follow Arrhenius law 598
over limited temperature ranges. Thus, the diffusive behavior of He in deformed 599
polycrystalline forsterite is complex due to the competition of several diffusion 600
mechanisms that are preferentially expressed in different temperature ranges. These 601
different diffusion mechanisms are related to various storage sites since (i) the transitions 602
between the temperature ranges where different diffusion mechanisms are expressed were 603
different between cycles and samples, and (ii) the calculated Ea show large variations 604
within individual cycles. 605
By comparison with literature data, we identified different diffusion mechanisms that 606
were expressed for each linear regression: (i) the LAT-high mechanism (i.e., diffusion in 607
Mg vacancies), (ii) the LAT-high + LAT-low mechanisms (i.e., the co-governance of 608
diffusion in Mg vacancies and interstitial sites), (iii) the LAT + GB (i.e., the co-609
governance of diffusion in the crystal lattice and along grain boundaries), and (iv) surface 610
diffusion. Moreover, we observed a new diffusion mechanism in deformed forsterite, 611
interpreted as the LAT + DIS mechanisms (i.e., the co-governance of diffusion in the 612
crystal lattice and along dislocations). 613
We have refined grain boundary diffusion parameters for He in polycrystalline olivine: Ea 614
= 36 ± 9 kJ·mol–1 and D0 = 10–10.57 ± 0.58 m2.s–1. Based on our results and literature data, we 615
have refined those of He diffusion in Mg vacancies (Ea = 173 ± 14 kJ·mol–1 and D0 = 10– 616
5.07 ± 1.25
m2·s–1) and in interstitial sites (Ea = 89 ± 7 kJ·mol–1 and D0 = 10–8.95 ± 1.16 m2·s–1). 617
Furthermore, we report Ea = 56 ± 1 kJ·mol –1 and D0 = 10 –9.97 ± 0.37 m2·s–1 for He diffusion 618 along dislocations. 619
By y E ’ we showed that only a small fraction of 620
He is stored along dislocations in the crystal lattice (<1.2%), which is negligible compared 621
to the He fraction stored in grain boundaries (~22% for a grain size of 1 mm; Delon et al., 622
2018). Thus, the presence of He along dislocations does not strongly influence bulk 623
diffusivities, which are very close to lattice diffusivities, and only the existence of a 624
significant amount of He in grain boundaries could enhance the bulk diffusivities of 625
mantle rocks. Nevertheless, potential grain size reduction induced by dynamic 626
recrystallization would involve a redistribution of He between the crystal lattice and grain 627
boundaries, which can increase bulk concentrations upon re-equilibration of grain 628
boundaries in deformed rocks with those in nearby undeformed peridotites, thus 629
enhancing bulk He diffusivities. 630
631
Acknowledgements 632
This paper is dedicated to the memory of Pete Burnard (1965-2015), as the initiator of this 633
project, our priceless colleague, and friend. The authors thank L. Zimmermann for his help on 634
He analyses and D.V. Bekaert and M.W. Broadley for advice and assistance on the furnace. 635
We are also grateful to M. Laumonier for his contribution to the piston cylinder experiments, 636
J. Charreau for help with the F-tests, F. Barou for his help with SEM-EBSD analyses, and C. 637
Nevado and D. Delmas for providing high-quality thin sections for SEM and TEM analyses. 638
The TEM and EBSD-SEM national facilities in Lille and Montpellier are both supported by 639
I ’ (I ) du Centre National de la Recherche 640
Scientifique (CNRS, France). The EBSD-SEM facility in Montpellier and TEM facility in 641
Lille are also supported by the Conseil Régional Occitanie and by the Conseil Régional 642
Hauts-de-France (France), respectively. This study was supported by the JSPS KAKENHI 643
Grant b J K 99 . K. E k I ’ 644
program, 2016-B-05. M.A. Bouhifd acknowledges the support of the Labex ClerVolc (this is 645
laboratory of Excellence ClerVolc contribution number 385). This study was mainly financed 646 by ’A A I I O (A -14-CE33-0011). 647 This is CRPG contribution n° 2703. 648 649 Research data 650
Original data of this study are available in the supplementary file. 651
652
References 653
Akaogi, M., Ito, E., and Navrotsky, A. (1989). Olivine-modified spinel-spinel transitions in 654
the system Mg2SiO4-Fe2SiO4: Calorimetric measurements, thermochemical calculation, 655
and geophysical application. Journal of Geophysical Research: Solid Earth, 94(B11), 656
15671–15685. 657
Allègre, C. J. (1987). Isotope geodynamics. Earth and Planetary Science Letters, 86(2–4), 658
175–203. 659
Andrault, D., Bouhifd, M. A., Itie, J. P., and Richet, P. (1995). Compression and 660
amorphization of (Mg, Fe)2SiO4 olivines: an X-ray diffraction study up to 70 GPa. 661
Physics and Chemistry of Minerals, 22(2), 99–107. 662
Barfod, D. N., Ballentine, C. J., Halliday, A. N., and Fitton, J. G. (1999). Noble gases in the 663
Cameroon line and the He, Ne, and Ar isotopic compositions of high μ (HIMU) mantle. 664
Journal of Geophysical Research: Solid Earth, 104(B12), 29509–29527. 665
Baxter, E. F., Clay, P. L., Kelley, S. P., Watson, E. B., Cherniak, D. J., and Thomas, J. B. 666
(2006). Two diffusive pathways for argon in quartz and feldspar. Geochimica et 667
Cosmochimica Acta Supplement, 70, A41–A41. 668
Baxter, E. F., Asimow, P. D., and Farley, K. A. (2007). Grain boundary partitioning of Ar and 669
He. Geochimica et Cosmochimica Acta, 71(2), 434–451.
670
https://doi.org/10.1016/j.gca.2006.09.011Bekaert, D. V, Broadley, M. W., Delarue, F., 671
Avice, G., Robert, F., and Marty, B. (2018). Archean kerogen as a new tracer of 672
atmospheric evolution: Implications for dating the widespread nature of early life. 673
Science Advances, 4(2), eaar2091. https://doi.org/10.1126/sciadv.aar2091 674
Blard, P.-H., Puchol, N., and Farley, K. A. (2008). Constraints on the loss of matrix-sited 675
helium during vacuum crushing of mafic phenocrysts. Geochimica et Cosmochimica 676
Acta, 72, 3788–3803. https://doi.org/10.1016/j.gca.2008.05.044 677
Bouhifd, M. A., Jephcoat, A. P., Heber, V. S., and K y . . ( ). H E ’ 678
early core. Nature Geoscience, 6(11), 982. 679
Box, G. E. P. (1953). Non-normality and tests on variances. Biometrika, 40(3/4), 318–335. 680
Burnard, P., Demouchy, S., Delon, R., Arnaud, N. O., Marrocchi, Y., Cordier, P., and Addad, 681
A. (2015). The role of grain boundaries in the storage and transport of noble gases in the 682
mantle. Earth and Planetary Science Letters, 430, 260–270. 683
https://doi.org/10.1016/j.epsl.2015.08.024 684
Cassata, W. S., Renne, P. R., and Shuster, D. L. (2011). Argon diffusion in pyroxenes: 685
Implications for thermochronometry and mantle degassing. Earth and Planetary Science 686
Letters, 304(3–4), 407–416. https://doi.org/10.1016/j.epsl.2011.02.019 687
Chakraborty, S. (1997). Rates and mechanisms of Fe‐Mg interdiffusion in olivine at 980– 688
1300 C. Journal of Geophysical Research: Solid Earth, 102(B6), 12317–12331. 689
Chakraborty, S. (2008). Diffusion in Solid Silicates: A Tool to Track Timescales of Processes 690
Comes of Age. Annual Review of Earth and Planetary Sciences, 36(1), 153–190. 691
https://doi.org/10.1146/annurev.earth.36.031207.124125 692