HAL Id: hal-02341149
https://hal.archives-ouvertes.fr/hal-02341149
Submitted on 26 Nov 2020
HAL is a multi-disciplinary open access
archive for the deposit and dissemination of
sci-entific research documents, whether they are
pub-lished or not. The documents may come from
teaching and research institutions in France or
abroad, or from public or private research centers.
L’archive ouverte pluridisciplinaire HAL, est
destinée au dépôt et à la diffusion de documents
scientifiques de niveau recherche, publiés ou non,
émanant des établissements d’enseignement et de
recherche français ou étrangers, des laboratoires
publics ou privés.
Distributed under a Creative Commons Attribution| 4.0 International License
Potential impact of climate change on solar resource in
Africa for photovoltaic energy: analyses from
CORDEX-AFRICA climate experiments
Adeline Bichet, Benoit Hingray, Guillaume Evin, Arona Diedhiou, Cheikh
Mouhamed Fadel Kébé, Sandrine Anquetin
To cite this version:
Adeline Bichet, Benoit Hingray, Guillaume Evin, Arona Diedhiou, Cheikh Mouhamed Fadel Kébé, et
al.. Potential impact of climate change on solar resource in Africa for photovoltaic energy: analyses
from CORDEX-AFRICA climate experiments. Environmental Research Letters, IOP Publishing, In
press, 14 (12), pp.124039. �10.1088/1748-9326/ab500a�. �hal-02341149�
LETTER • OPEN ACCESS
Potential impact of climate change on solar resource in Africa for
photovoltaic energy: analyses from CORDEX-AFRICA climate
experiments
To cite this article: Adeline Bichet et al 2019 Environ. Res. Lett. 14 124039
View the article online for updates and enhancements.
Environ. Res. Lett. 14(2019) 124039 https://doi.org/10.1088/1748-9326/ab500a
LETTER
Potential impact of climate change on solar resource in Africa for
photovoltaic energy: analyses from CORDEX-AFRICA climate
experiments
Adeline Bichet1 , Benoit Hingray1 , Guillaume Evin2 , Arona Diedhiou1,3 ,
Cheikh Mouhamed Fadel Kebe4
and Sandrine Anquetin1
1 University Grenoble Alpes, IGE UMR 5001, Grenoble, F-38000, France 2 University Grenoble Alpes, Irstea, UR ETNA, Grenoble, France
3 African Centre of Excellence on Climate Change, Biodiversity and Sustainable Agriculture(ACE CCBAD), University Félix Houphouët
Boigny, Abidjan, Côte d’Ivoire
4 Centre for Incubation and Development of Innovative Companies(Innodev), University Cheikh Anta Diop, Dakar, Sénégal
E-mail:adeline.bichet@univ-grenoble-alpes.fr
Keywords: solar potential, solar radiation change, climate change, model projections, solar resource assessment, Bayesian ANOVA method Supplementary material for this article is availableonline
Abstract
The development of renewable electricity in Africa could be massive in coming decades, as a response
to the rapid rising electricity demand while complying with the Paris Agreements. This study shows
that in the high-resolution climate experiments of CORDEX-AFRICA, the annual mean solar
potential is expected to decrease on average by 4% over most of the continent by the end of the
century, reaching up to 6% over the Horn of Africa, as a direct result of decrease in solar radiation and
increase in air surface temperature. These projections are associated with large uncertainties, in
particular over the Sahel and the elevated terrains of eastern Africa. While the expected decrease may
affect the sizing of the numerous solar projects planned in Africa for the next decades, this study
suggests that it does not endanger their viability. At last, this study indicates that the design of such
projects also needs to account for the non-negligible uncertainties associated with the resource.
1. Introduction
Most of Africa’s economy is growing at
unprece-dented speed, and the demand for electricity is expected to triple by 2030 [1]. To meet this rising
demand while contributing to the objectives of the Paris Agreement, most African countries are expected to develop renewable electricity, typically solar, wind, and hydropower. Africa has an exceptional solar resource that can be harnessed for electricity genera-tion[1]. Despite a strong influence of the nebulosity,
solar resource remains generally high throughout the year over the entire continent[2]. Higher resource
and higher temporal stability are found near the mid-latitudes despite a strong monsoon-related seasonal-ity [3, 4, 5]. Lower resource and lower temporal
stability are found near the equator where a strong nebulosity is found during most part of the year (e.g. [2,6]).
Whereas previous studies indicate a strong poten-tial for solar energy over Africa under current condi-tions(e.g. [2]), very little is known about the future
evolution of this potential. Yet, because solar power depends on incoming surface solar radiation(amount of sunlight reaching the Earth’s surface) as well as on other atmospheric variables(e.g. temperature) affect-ing the photovoltaic(PV) panel efficiency [7,8], it is
expected to be sensitive to the long-term changes in climate and pollution levels. Note that the
develop-ment of concentrated solar power(CSP) systems is
also expected to increase in the coming decades. How-ever, because PV projects are less limited and more numerous than CSP projects[9], we focus our study
on PV systems, thus investigating the changes in global
solar irradiance (GHI). A similar study could
obviously be carried out for CSP systems, but this would involve investigating the changes in direct nor-mal irradiance instead of GHI.
OPEN ACCESS RECEIVED 17 July 2019 REVISED 16 October 2019 ACCEPTED FOR PUBLICATION 22 October 2019 PUBLISHED 6 December 2019
Original content from this work may be used under the terms of theCreative Commons Attribution 3.0 licence.
Any further distribution of this work must maintain attribution to the author(s) and the title of the work, journal citation and DOI.
According to the projections of 39 global coupled
atmosphere-ocean models(GCMs) under the RCP8.5
scenario taken from the CMIP5 project, the potential for solar energy is expected to decrease by mid-21st century, over a large part of the world including Africa [10]. The low resolution (temporal and spatial) of
GCMs, however, limits a precise assessment at a regio-nal scale. A better assessment requires using regioregio-nal
climate models(RCMs), which provide a higher
spa-tial and temporal resolution, and thus a better repre-sentation of the topography, coastline, and small scale processes through the use of parametrization schemes [11–14]. Unfortunately, to date, with the noticeable
exception of the study of[15] for the European region,
no such study has been conducted at continental scales. This gap has obviously to befilled rapidly in regions where solar energy has been identified as a key contributor to a climate-friendly energy transition, such as Africa, where projections of solar resource are only available as part of global studies[10,16,17] or at
the country(e.g. [18,19]) or regional level [20].
In this study, we use the outputs of CORDEX-AFRICA[21–23], the most up-to-date ensemble of
high-resolution regional climate projections for Africa, to investigate how the solar potential and its temporal variability are expected to change for this continent in the next decades. Solar radiation, air temperature and surface wind speed time series from each climate experiment are used to estimate the potential for solar power production and its expected time evolution for each grid cell of the domain and for nine regions with contrasted climates. The expected changes in this potential (mean and variability) are then assessed along with that of its weather drivers. We further characterize the uncertainty associated with expected changes and the proportion of this uncer-tainty due to different unceruncer-tainty sources, namely internal variability(IV) and model uncertainty due to GCMs and RCMs, respectively. Hence, as compared to previous regional studies(e.g. [20]), our study aims to
evaluate the PV potential and its sensitivity to climate change over the whole African continent, in addition to characterize the total uncertainty associated with
these projections and the different sources of this uncertainty.
Section2describes the data and the methodology. Section3.1 investigates the future changes that are expected in the mean solar potential and its drivers, section3.2examines the future changes that are expec-ted in the mean solar potential at a regional scale, and section3.3examines the future changes in the daily and annual temporal variability of solar energy poten-tial. Section4discusses and concludes the study.
2. Methodology and data
2.1. Datasets
We use an ensemble of 17 regional climate simulations taken from the most up-to-date ensemble of high-resolution RCM projections produced in the recent years for Africa: CORDEX-AFRICA[21–23]. In this
ensemble,five RCMs are used to downscale 10 GCMs
under the climate scenario RCP8.5 (table 1). The
simulations span the period 1976–2099 at a daily time
step, and cover Africa (24.64°W–60.28°E; 45.76°S–
42.24°N) with a spatial resolution of 0.5° (∼50 km) in latitude and longitude. For each simulation and each grid cell, daily time series of surface downwelling shortwave radiation(RSDS), surface air temperature (TAS), and 10 meters Wind speed (W10) are retrieved. As explained in the Methodology section, TAS and W10 are used to compute the solar potential, as they affect the temperature of the PV cells.
As an important prerequisite for this work, we evaluated the simulated RSDS for the period
1995–2005, by comparison with observed GHI taken
from the high resolution satellite SARAH2[24]. The
data from SARAH2 is available since 1983, but because[25] found some horizontal stripes artifacts
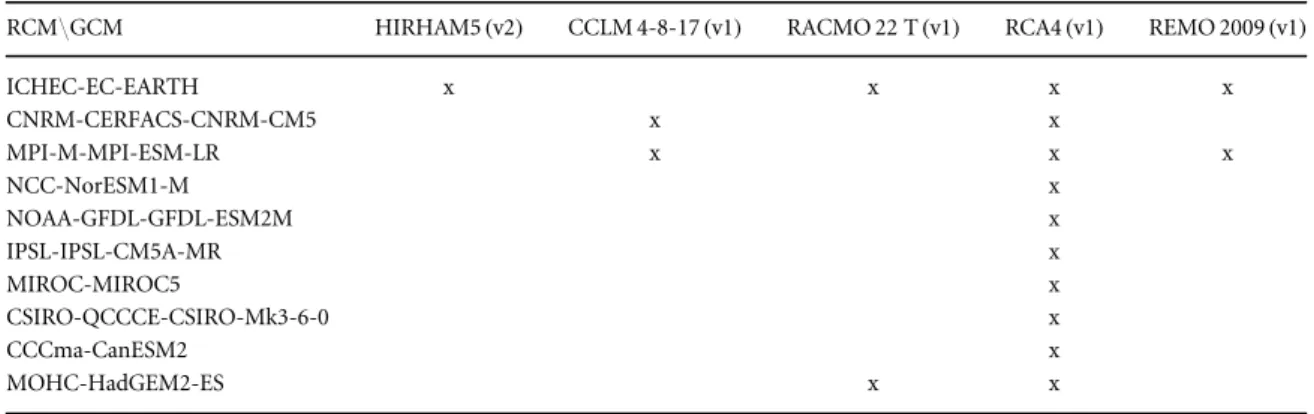
in the Meteosat SIS data over the period 1983–1994, we only use the data from 1995 onwards. In all four seasons, wefind that the 17 climate experiments are able to capture the observed spatial distribution of the mean resource and its temporal variability, both being dominated by a significant latitudinal gra-dient(supplementary figure 1 is available online at Table 1. Summary of 17 simulations(GCM/RCM chains) taken from the CORDEX-AFRICA data. In this ensemble, five RCMs are used to downscale 10 GCMs. Each experiment comprises one historical and one scenario(RCP8.5) run, spanning the periods 1976–2005 and 2006–2099 respectively. The horizontal resolution of all simulations is 0.5° in both latitude and longitude.
RCM\GCM HIRHAM5(v2) CCLM 4-8-17(v1) RACMO 22 T(v1) RCA4(v1) REMO 2009(v1)
ICHEC-EC-EARTH x x x x CNRM-CERFACS-CNRM-CM5 x x MPI-M-MPI-ESM-LR x x x NCC-NorESM1-M x NOAA-GFDL-GFDL-ESM2M x IPSL-IPSL-CM5A-MR x MIROC-MIROC5 x CSIRO-QCCCE-CSIRO-Mk3-6-0 x CCCma-CanESM2 x MOHC-HadGEM2-ES x x
stacks.iop.org/ERL/14/124039/mmedia). Higher
(lower) values of mean resource are found near the mid-latitudes (along the equator) in both datasets. Larger biases(>10%) are found over the southern
subtropics in December–January–February (DJF),
the tropics in DJF(including West Sahel and Guinea Coast), and the Horn of Africa in March–April–May (MAM; supplementary figure 1). In all four seasons, both datasets show a daily variability(20%) that is a fac-tor 10 higher than the interannual variability(2%), with the models slightly overestimating the observed inter-annual variability. Overall, the general agreement between the two datasets encourages the use of the CORDEX-AFRICA ensemble for investigating the pro-jections of future solar potential in Africa.
2.2. Methodology
In this study, we focus on how the mean potential production of solar power(PVpot) for any given site is expected to evolve as a result of climate change. It must be noticed that this potential production is not directly related to the real production as the latter depends on the installed capacity. The installed capacity will likely grow rapidly in Africa owing to a lot of utility scale and offgrid projects of solar farms[1], and its evolution is
a priori not linked to the climate evolution. The potential production PVpot characterizes the amount of solar energy that can be retrieved for a given site using PV cells. It depends on the local meteorological conditions and is thus linked to climate characteristics. For any given time t, the potential production(PVpot
(t)) is defined as the ratio between (1) the production that would be obtained for that time as a result of the
current weather conditions (wind, temperature and
solar radiation) and (2) the production that would have been obtained under standard test weather conditions. PVpot(t) is sometimes referred to as the ‘capacity factor’ of the PV cells for time t [26]. It is
dimensionless. In the present work, we compute PVpot(t) on a daily basis following [15, 27], as
described in the ‘Annex Methodology’. Changes in
annual and seasonal mean PVpot values are then processed using the methodology described in the following.
The CORDEX-AFRICA multimodel ensemble used for this analysis(table1) is associated with
differ-ent sources of uncertainty, namely model uncertainty (uncertainty due to imperfections of climate models, i.e. GCMs or RCMs) and climate IV (variability in pro-jections due to the chaotic and nonlinear nature of the climate system, which includes interannual variability here). To better understand the importance of these different uncertainty sources, they are partitioned and quantified using QUALYPSO [28], an advanced
Baye-sian ANOVA method based on data augmentation techniques and on the quasi-ergodicity assumption of climate outputs[29]. We quantify uncertainty sources
for each grid cell of the African continent, for the
pro-jections of annual mean(aggregated from the daily
time series) RSDS, W10, TAS, and PVpot. In addition, we split Africa into nine climatic regions, as described
infigure1, and apply the QUALYPSO method to the
Figure 1. Regional analyses are performed on the nine climatic regions adapted from[30]: 1. North Africa (30°−37°N; 18°W −36° E),
2. Sahara(18°−30°N; 18°W−36° E), 3. West Sahel (10°−18°N; 18°−10°W), 4. East Sahel (10°−18°N; 10°W−36° E), 5. Guinea Coast (12°S−10°N; 18°W−22° E), 6. East Africa (12°S−10°N; 22° −36° E), 7. Horn of Africa (12°S−18°N; 36°−52° E), 8. Sub-South Africa (20°−12°S; 5° −42°E), 9. South Africa (35°−20°S; 10°−36° E).
3 Environ. Res. Lett. 14(2019) 124039
projections of annual mean values of the nine PVpot regional means. Finally, we compute the changes in the temporal variability of PVpot, as well as the chan-ges in PVpot that are due to a change in either TAS (TAS-induced) or W10 (W10-induced), following [15]. Details of the computation are described in the
‘Annex Methodology’.
3. Results
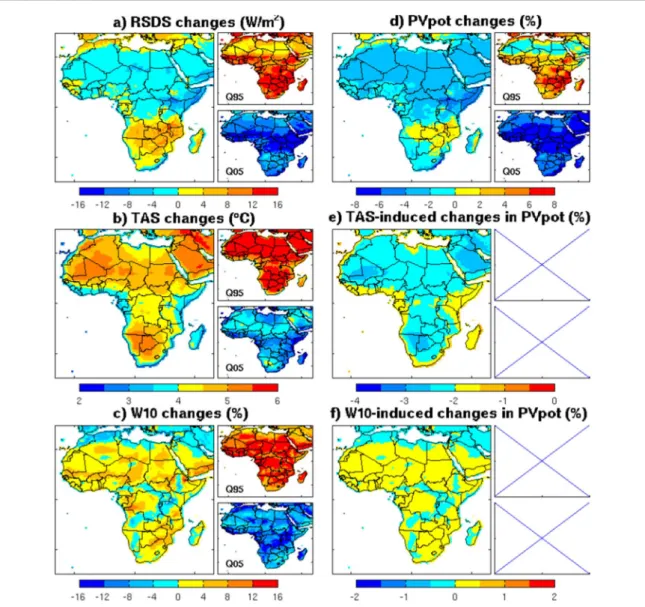
3.1. Expected changes of mean PVpot and its drivers We comment here changes in mean PVpot expected by the end of the century(2070–2099). Figure2shows the ensemble mean change and the bounds of the 90% confidence interval of the projections for this variable (figure2(d)) and its drivers (figures2(a)–(c)). By the
end of the century, except for some regions where it is expected to increase(up to+2% in parts of southern Africa and along parts of the northern coast), PVpot is expected to decrease on average by 4% over the
continent, reaching up to 6% over the Horn of Africa. These projections come with a large uncertainty and at the exception of the Sahara, the sign of change is actually uncertain(figure2(d)). Thus, even though the
mean change is relatively small(−4% on average by
the end of the century), large changes may actually
occur in reality (from less than −8% to more
than+8%, figure2(d)). By the end of the century, the
response to uncertainty ratio(R2U, figure3) is only
larger than 1 over the Sahara(region 2), East Sahel (region 4), and the Horn of Africa (region 7). It falls down to 0.6 over West Sahel and East Africa(regions 3 and 6), 0.5 over the Gulf of Guinea and South Africa (regions 5 and 9), and even 0.2 over Sub-South Africa (region 8).
Figure 4 shows the decomposition of the total
uncertainty of PVpot. This total uncertainty is particu-larly large over the Sahel and the elevated terrains of eastern Africa (figure 4(a)), where a large part of
total uncertainty results from RCM uncertainty Figure 2. Ensemble mean climate change responseμ for the end of the century (2070–2099), in (a) RSDS, (b) TAS, (c) W10, and (d) PVpot, in W m−2,°C, %, and %, respectively, and in the PVpot changes that would be induced by the changes in either (e) TAS alone or(f) W10 alone, in %. Also shown are the corresponding bounds (Q95 and Q05) of the 90% confidence interval. See the Methods section for details.
(figure4(c)), as a result of large differences in the main
effects obtained for RCM2 and RCM5 in Sahel and for RCM1 and RCM4 in the elevated terrains of eastern
Africa (supplementary figure 2). Elsewhere, total
uncertainty is smaller and results mostly from IV.
Hence, the projections of PVpot (figure 2(d))
mainly resemble the ones of RSDS(figure2(a)). By the
end of the century, RSDS is expected to decrease on average by 4 W m−2over most the continent, reaching up to 12 W m−2over the Horn of Africa(figure2(a)).
Exceptions where RSDS is expected to increase are southern Africa (up to+6 W m−2) and parts of the northern and the western coasts. Uncertainty in RSDS projections is also logically similar to that of PVpot. It is also largely due to RCM uncertainty over the Sahel and the elevated terrains of eastern Africa, and IV elsewhere.
Expected changes in TAS and W10 can also mod-ulate changes in PVpot. By the end of the century, TAS is expected to increase by+5.5 °C over western Sahel
and Namibia/Botswana, +5 °C over the
mid-latitudes,+4.5 °C over the equatorial region, and +4 °C along the coasts, under the RCP8.5 scenario (figure2(b)). The dispersion between climate
projec-tions is up to 3°C by the end of the century; the total uncertainty mostly results from IV and GCM
uncertainty(supplementary figure 3(b)). Overall, the
significance of expected changes is high when
com-pared to total uncertainties(R2U>1 whatever the region,figure3(b)). Except along the northern coast
and parts of central Africa where it decreases by up to 4%(figure 2(c)), W10 is expected to increase
every-where by up to+8%. For this variable, the dispersion between the projections is large, especially in equator-ial regions (R2U<1 in most regions, figure 3(c)).
Total uncertainty mostly results from IV(up to 80% over the Sahel, Western Sahara, Horn of Africa, and along the southern coast) and GCM uncertainty (up to 80% over large parts of eastern Sahara(supplementary figure 3(c)).
Figures2(e) and (f) show the changes in PVpot that
would be induced by the end of the century solely by the changes in either TAS or W10, respectively. Change in TAS is expected to reduce PVpot over the entire continent, on average by 2.5% (figure 2(e)).
Conversely, changes in wind speed are not expected to really affect mean PVpot(induced changes are below 1%,figure2(f)).
Hence, our results show that the PVpot spatial pat-tern of change(figure2(d)) resembles the one of RSDS
(figure2(a)), albeit altered by the projected warming.
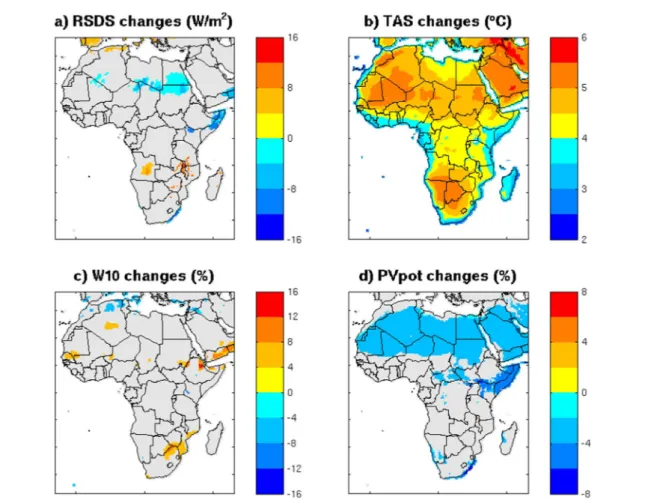
Over parts of southern Africa and along parts of the Figure 3. Ensemble mean climate change responseμ for the end of the century (2070–2099), in (a) RSDS (W/m2), (b) TAS (°C), (c) W10(%), and (d) PVpot (%), as seen in figure1. The gray shaded area represents areas where R2U<1 (U=total uncertainty). See the Methods section for details.
5 Environ. Res. Lett. 14(2019) 124039
western and the northern coasts, the warming is indeed strong enough to offset the increase in RSDS and produce a decline in PVpot.
In additionfigure5shows that the expected chan-ges in PVpot can also depend on the season, especially for JJA and DJF. For example in June–July–August, PVpot is expected to increase on average by+4% over the Sahel and along southwestern Africa by the end of the century, and decrease on average by 4% elsewhere, reaching up to−8% along the coast of Guinea Coast. In September–October–November (SON), DJF, and
MAM, PVpot is expected to increase by up to+4% in
parts of southern Africa and along parts of the north-ern coast, and decrease on average by 4% elsewhere,
reaching up to 6%(8%) over the Horn of Africa in
SON(DJF).
3.2. Expected changes of mean PVpot at regional scales
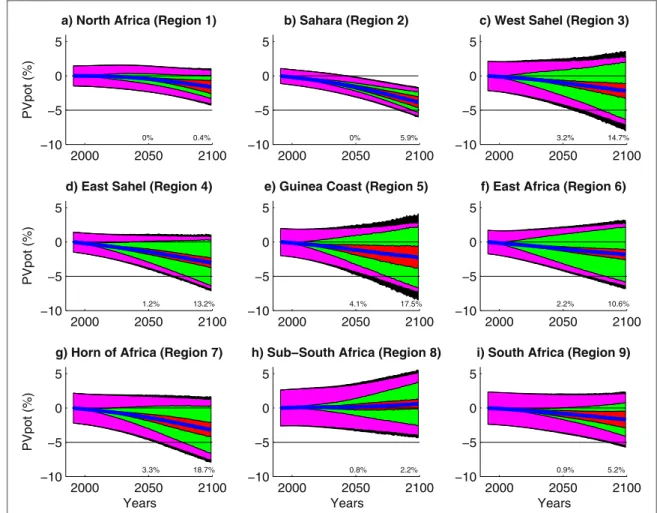
Figure6shows the PVpot changes over 1990–2099 in
each region depicted in figure 1. Shown are the
ensemble mean climate change responseμ (dark blue
curve), the 90% confidence interval (black curves), and the individual contribution of each source of
uncertainty (red: GCM uncertainty, green: RCM
uncertainty, magenta: IV, black: model residuals).
Except in region 8 where it remains constant, PVpot steadily decreases throughout the 21st century in all the regions. The mean projected changes exceed total uncertainty(R2U>1) after 2024 in region 2, 2060 in region 4, 2085 in region 7, 2099 in region 1, and never
elsewhere. Accounting for this uncertainty, wefind
that the probability for PVpot to decrease by more
than 5%(which corresponds to a significant change
for electricity production) by 2050 (2099) is of 0% (0.4%) in region 1, 0% (5.9%) in region 2, 3.2% (14.7%) in region 3, 1.2% (13.2%) in region 4, 4.1% (17.5%) in region 5, 2.2% (10.6%) in region 6, 3.3% (18.7%) in region 7, 0.8% (2.2%) in region 8, and 0.9% (5.2%) in region 9. Thus, even though the probability for a meaningful decrease is relatively small by 2050, it
becomes likely(10%–20%) by the end of the century
over most of the continent(Sahel, Guinea Coast, and eastern Africa(regions 3, 4, 5, 6 and 7, respectively)). In all regions, the confidence interval of the projected changes increases throughout the century as a result of increasing model uncertainty. Results can vary from one region to the other: in the northern regions, the confidence interval remains relatively small and the three sources of uncertainty equally contribute after about 2050; in the tropical regions and the Sahel however, the contribution from RCM uncertainty Figure 4. Decomposition of the total uncertainty of PVpot changes for the end of the century(2070–2099). Shown is the total
uncertainty standard deviation(STD=√T) of PVpot in % (a), and the contribution from each source of uncertainty (GCM (b), RCM (c), internal variability (d), and residual (e)), expressed in % of contribution to total uncertainty. Here, T corresponds to the total uncertainty variance, as described in the‘Annex Methodology’.
strongly increases throughout the century and prevails after about 2050; at last in the southern regions, the contribution from IV remains very high throughout the century, and in South Africa, the contribution from GCM uncertainty is higher than the one from RCM after 2050.
Furthermore, we show(supplementary figure 4)
that the confidence interval can be very different in the seasonal means as compared to the annual means, and from one season to another. For example, the con-fidence interval over the Sahel is very large in JJA but very small in DJF. Conversely over southern Africa, the confidence interval is very large in DJF and MAM, but much smaller in JJA and SON. In the annual means and the seasonal means, the confidence interval generally increases as a result of RCM uncertainty. 3.3. Expected changes in the temporal variability of PVpot
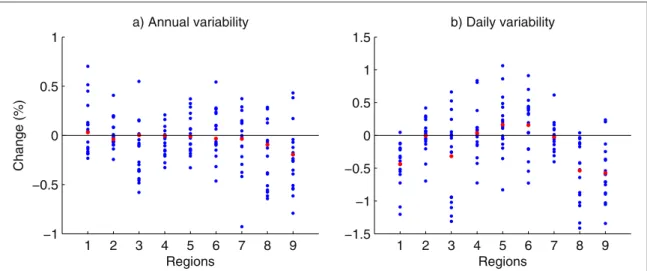
Figures7(a) and (b) show the mean changes in PVpot
annual(a) and daily (b) variability for each region by the end of the century (red dot), in addition to the
results obtained for each simulation chain respectively (blue dots). Annual and daily variability are not expected to change a lot on average, whatever the region. Annual variability is expected to change by a
maximum of 1%(as compared to the value of PVpot
over the reference period) depending on the simula-tion, generally increasing in regions 1(North Africa), and decreasing in region 3, 8, and 9(West Sahel and southern Africa,figure 7(a)). The daily variability is
expected to change by a maximum of 1.5% (as
compared to the value obtained for PVpot over the reference period) depending on the simulation, gen-erally increasing in regions 5 and 6(Guinea Coast and East Africa), and decreasing in regions 1, 8, and 9 (North Africa and southern Africa, figure7(b)). The
expected change is rather low on average for the whole ensemble, but may be rather large depending on the models. For a number of regions, even the sign of change is not certain. For instance, the daily variability may either increase or conversely decrease depending on the simulation chain. Additional analyses (supple-mentaryfigures 5) show that interannual variability is Figure 5. Ensemble mean climate change responseμ for seasonal mean PVpot for the end of the century (2070–2099; %), as averaged over(a) June–July–August (JJA), (b) September–October–November (SON), (c) December–January–February (DJF), and (d) March– April–May (MAM).
7 Environ. Res. Lett. 14(2019) 124039
expected to stay relatively stable in all four seasons, with a large dispersion across models, except for DJF where it clearly decreases in almost all the models in region 1(North Africa) and 2 (Sahara), on average by
1% (as compared to the value of PVpot over the
reference period). Daily variability is also expected to stay relatively stable in all four seasons, with a large dispersion across models, especially over the Sahel (region 3 and 4) in JJA and SON. In addition, daily variability is expected to clearly increase in region 7 (Sub-South Africa) in SON and in region 5 (Guinea Coast) in DJF, and clearly decrease in regions 8 and 9 (southern Africa) in JJA and SON, and in region 1 in SON and MAM.
4. Discussion and conclusion
In agreement with previous studies(e.g. [10,20]), we
find that except for a few regions (northern coast and 10°S), the annual mean solar potential in Africa is expected to decrease over the 21st century(on average by 4%), in particular over the Horn of Africa (up to 6%). In addition, the solar potential is expected to
increase on average by+4% over the Sahel in JJA
(rainy season over the Sahel), and decrease by more than 8% over the Horn of Africa in DJF. As in[20], we
find that the expected reduction in solar potential is a direct result of decreasing solar radiation(except for southern Africa where solar radiation increases) and
increasing temperature(decreases PVpot on average
by 2.5% points; we recall here that this estimation is relatively approximative, as PVpot is computed from
daily means(see Annex Methodology)). The
warm-ing-induced reduction, also seen in Europe[15] and
West Africa[20], calls for future efforts to reduce the
dependency of the PV cells performance on the ambient temperature [31]. As for Europe [15], our
results project little changes in the temporal stability (daily, annual, and decadal) of the solar potential in all seasons.
Large uncertainties are associated with our projec-tions, except over the Sahara where uncertainty is very small(only resulting from IV; figures2–4, and6).
Else-where, even the sign of change is not sure, depending on the simulation chain considered. The same applies for possible changes in variability (figure 7). This
Figure 6. Annual PVpot time series, in %, of the ensemble mean climate change responseμ (thick blue curve), as averaged over the nine regions depicted infigure1. The bounds of the 90% confidence interval, represented by Q95 and Q05 (most external black curves), is decomposed into the individual contribution of each source of uncertainty, represented by different colored shades (GCM uncertainty in red, RCM uncertainty in green, internal variability uncertainty in magenta, and method residual in black). Also shown are the probabilities, for each region, for PVpot to decrease by more than 5% by 2050 and 2099. Note that the fact that the changes are expressed in relative terms partly contributes to obtain the smallest changes over regions with the highest potential. See the Methods section for details.
implies that despite a small change in the ensemble mean(mean resource and variability of the resource), important changes may actually occur in reality. In particular, wefind that the probability for the annual mean solar potential to decrease below 5% is quasi null by 2050, but reaches 10%–20% by the end of the cen-tury over most of the continent(Sahara, Sahel, Guinea Coast, and eastern Africa;figure 6). Over the Sahel,
this probability is still high in JJA(10.5% in 2050 and 18% by the end of the century) despite the projected strong increase in mean solar potential(+4% on aver-age by the end of the century; supplementaryfigure 4). Over the Horn of Africa, this probability is very high in
DJF(26% in 2050 and 51.3% by the end of the
cen-tury) due to the strong decrease projected in the DJF
solar potential(more than 8%; supplementary figure
4). The stability of the resource (mean and variability) is thus to be put in perspective compared to this rela-tively large uncertainty. Although the significant uncertainty associated to projections has not the capa-city to endanger the development and viability of solar projects in this region[32–35], it should be accounted
for during the design of solar projects.
This uncertainty mainly results from RCM uncer-tainty over most of the continent. A large part of total uncertainty is also due to climate IV over southern Africa, the Guinea Coast and parts of the northern coast. In these regions, the irreducible IV will lead to rather large, unpredictable, variations of the resource. Elsewhere, uncertainty can be reduced with the improvements of RCMs. In particular, we suggest that the different parametrizations used in each RCM, and more specifically the ones for cloud cover and convec-tion(supplementary figure 6), play an important role explaining this large RCM dispersion(e.g. [36,37]).
An in-depth investigation is required to fully address this issue, which is currently ongoing. Note also that [11] shows that the projections of solar radiation is
different in the multimodel mean GCMs than it is in the multimodel mean RCMs because of the different behavior of the cloud cover in global and regional models, which further highlights the important role of cloud cover simulation. At last, it is important to recall that an additional source of uncertainty, not accoun-ted for in QUALYPSO, results from the quality of the projections(mean and variability), that varies greatly from a region to another(supplementary figure 1).
A more critical limitation is likely related to the impacts of aerosols, abundant in Africa. Aerosols, natural(e.g. Saharan dust) and anthropogenic (e.g. pollution), can significantly affect the potential for solar production(e.g. [38]). First, they fully modulate
RSDS via their direct impacts on the incoming solar radiation and their indirect impacts on cloud cover. In addition, their deposition on PV arrays is expected to decrease the efficiency of PV cells. Thus, a mod-ification of aerosols concentrations as a result of land use changes, modification in dust events intensity and frequency(and especially Saharan dusts), or pol-lution, could have a critical effect on the potential for solar production. For instance, the expected changes in surface wind speed seen infigure2(c) can affect the
solar potential via their impacts on the synoptic cir-culation and the displacement of dust from the source(e.g. Sahara) to the different regions of Africa. Unfortunately, the RCMs used in CORDEX-AFRICA poorly represent these different interactions of the aerosols with the climate. In addition, the climate
scenarios used in CORDEX-AFRICA(e.g. RCP8.5)
have been shown to strongly underestimate the pre-sent and future anthropogenic emissions of aerosols in Africa[39]. Depending on the future policy
scenar-ios for anthropogenic emissions of aerosols, solar potential over Africa could thus vary by up to 7% in 2030[38]. According to the authors, this impact is
related to the global effect of the aerosols on the large Figure 7. Projected changes of the PVpot(a) annual variability and (b) daily variability, in %, as averaged over the nine regions
depicted infigure1. Shown are the anomalies((2070–2099)–(1976–2005)) of the annual and daily variability, expressed in % as compared to the reference mean value of PVpot, computed from the 17 raw simulations(blue dots) and the corresponding ensemble mean(red dots). See the Methods section for details.
9 Environ. Res. Lett. 14(2019) 124039
scale circulation and associated cloud cover patterns, rather than to their local effects on the atmospheric properties. A deep investigation of the skill of current models to simulate relevant aerosols dynamics and concentration and in turn of the effects of aerosols on solar resource is definitely to be carried out in future works.
Finally, as in [10], our projections result solely
from the future changes imposed in the forcings under the RCP8.5 scenario. Although the identification of such forcings is beyond the scope of this study, we sug-gest that the projected warming results at least partly from the imposed increase in greenhouse gases(e.g. [40]), while the projections of RSDS result at least
partly from the imposed changes in aerosols, through their impacts on the local atmospheric optical proper-ties and/or cloud cover patterns (e.g. [38]). In fact, the
resemblance between our projected RSDS pattern of change and the projected cloud cover pattern of change from thefifth assessment report (cloud cover is
projected to increase(decrease) by about+5% (5%)
over eastern(southern) Africa; [40]) points towards a
strong role of the nebulosity in explaining the projec-tions of RSDS. As previously mention, the important role of cloud cover is also suggested by[11], and our
study further supports this point.
Acknowledgments
The research leading to this publication received funding from the French public research institution IRD, and was supported by the French National
program LEFE(Les Enveloppes Fluides et
l’Environ-nement). We acknowledge the usage of the CORDEX-AFRICA dataset from the World Climate Research Program’s Working Group on Regional Climate (http://cordex.org/data-access/esgf/), and the usage
of the SARAH2 dataset(https://wui.cmsaf.eu/safira/ action/viewDoiDetails?acronym=SARAH_V002).
This work is a contribution to CORDEX-AFRICA initiative. The research leading to this publication is co-funded by the NERC/DFID ‘Future Climate for Africa’ program under the AMMA-2050 project,
Grant No. NE/M019969/1 and by IRD (Institut de
Recherche pour le Développement; France). We also
thank the staff at the IGE computation center(Patrick Juen and Wajdi Nechba) for their technical support, as well as Nicolas Plain for his role in accessing the SARAH2 data and his insights into the dataset.
Annex Methodology
A.1. Computation of the power generation potential PVpot
Following[15,27], the potential production of solar
power for a given time t can be computed as follows:
=
( )t P t( ) ( )t / ( )
PVpot R RSDS RSDSSTC, 1
where RSDS(t) is surface downwelling shortwave radiation for t, the production for the standard test conditions is RSDSSTC=1000 W m−2, and PRis the performance ratio of the PV cells, expressed as
g
= + [ ( )- ] ( )
( )
PR t 1 Tcell t TSTC , 2
where Tcellis the PV cell temperature, TSTC=25 °C,
and γ=−0.005 °C−1, considering the typical
response of monocrystalline silicon solar panels. Tcell is expressed as a linear function of TAS, RSDS and W10: = + + + ( ) ( ) ( ) ( ) ( ) T t c cTAS t c RSDS t c W10t , 3 cell 1 2 3 4 with c1=4.3 °C, c2=0.943, c3=0.028 °C m2W−1, and c4=−1.528 °C s m−1 [41]. Hence, if ambient conditions correspond to the standard conditions, PVpot(t) equals 1 and PV power production reaches the rated value. If Tcell>25 °C and/or RSDS< 1000 W m−2, then PVpot(t) <1 and the PV produc-tion is lower than the rated value. Because CORDEX-AFRICA is only available at the daily time step, we apply the instantaneous PVpot(t) equations described above to daily means. Although this may trigger a slight difference due to the covariability between temperature and radiation(low temperature at night, large temperature during daytime), additional analyses (not shown) show that in the West African stations tested, simulations with high resolution data show no significant differences with daily mean simulations. We expect those results to be rather similar for the whole continent.
We consider the impact of climate change on the annual and seasonal mean potential production, as well as on its day-to-day and year-to-year variability. At last, we compute the changes in PVpot resulting
from changes in either TAS(TAS-induced) or W10
(W10-induced) as detailed in [15] and described
fur-ther down. At this point, note that our study does not account for other parameters affecting the outdoor performance of PV modules efficiency such as deposi-tion of dust on the PV panels, nor the tilt of the PV panels, the solar spectrum distribution and the air mass effect on it[42,43].
A.2. Estimation of the different sources of uncertainty using QUALYPSO
Conversely to typical ANOVA approaches used for
such analysis, QUALYPSO [28] allows for a robust
partition and for an unbiased estimation of all uncertainty components in multimember multimodel ensembles of projections, even in the case of single run ensembles(i.e. when only one experiment is available for some or all simulation chains; which is the case here as only one run is available for each GCM) and even when ensembles are incomplete(i.e. when not all
GCM/RCM combinations are available which is also
the case here; only 17 GCM/RCM combinations are
RCM combinations, see table1). Using QUALYPSO,
we can estimate the mean climate change response of the considered variable, the total uncertainty of the projections and the contribution of the different uncertainty components to it. More specifically, the different steps of QUALYPSO are as follows.
1. For each climate chain(each GCM/RCM
combi-nation), extraction of the climate response of the chain for the considered variable achieved by fitting a trend model.
2. For each climate chain, computation of the change variables(i.e. absolute or relative differ-ences) between a future and a reference period (centered here on 1990).
3. Using the climate change responses of all available GCM/RCM chains, estimation of the mean cli-mate change response of the ensemble of chains. 4. Decomposition of the climate change response
using an analysis of variance (ANOVA) model.
The deviations of each GCM and each RCM from the mean climate change response of the ensem-ble are estimated using data augmentation and Bayesian methods.
5. The dispersion (variance) between the main
effects obtained for the different GCMs (resp.
RCMs) gives an estimate of the model uncertainty
due to GCMs (resp. RCMs). We refer to this
dispersion as GCM(resp. RCM) uncertainty in
the text.
6. The IV is estimated by the variance of the deviations from the climate change response of the simulation chains.
For further details on the method, the reader is
referred to [28]. QUALYPSO estimates can be
pro-duced for each prediction lead time. Here, we mainly present results obtained for changes between 2070–2099 and 1976–2005. Note that for W10 and PVpot, QUALYPSO is applied on the change variable, as we argue that for W10 and PVpot, the simulated changes are more reliable than the absolute values. Hence, for W10 and PVpot, the projected changes in mean W10, mean PVpot, are expressed in relative terms(%).
In our work, we give the ensemble mean and the
90% confidence interval of the projections derived
from QUALYPSO. Under the assumption that change variables for each year t are normally distributed, the bounds of this interval are obtained from quantiles 95 (Q95) and 05 (Q05) as follows: m m = + ´ = -( ) ( ) ( ) ( ) ( ) ( ) ( ) t t T t t t T t Q95 1.96 , and Q05 1.96 , 4
where μ(t) is the ensemble mean climate change
response, and T(t) is the total uncertainty variance. We
additionally compute the response-to-uncertainty ratio(R2U), as the ratio between the ensemble mean climate change responseμ(t) and the total uncertainty standard deviation(STD( )t = T t( ) ). Thus, R2U is a measure of the significance of changes, i.e. when R2U>1, the magnitude of the signal exceeds stan-dard deviation of the ensemble.
A.3. Computation of TAS-induced and W10-induced PVpot changes
For each of the 17 GCM/RCM chains, we compute the
changes in PVpot due to a change in either TAS (TAS-induced) or W10 (W10-(TAS-induced) as follows. Following [15], the changes in PVpot(t) that result from a change
in TAS can be expressed as
a D = D ( ) ( ) ( ) ( ) t t t TAS_induced_PVpot RSDS . TAS , 5 3
whereΔTAS(t) is the change in TAS (=TAS anomalies
computed from the TAS climate response of the chain), RSDS(t) is the absolute value of RSDS taken from the RSDS climate response of the chain, and α3=−4.715 × 10⁻⁶W m−2. Then, we express PVpot in relative term as follows:
a D = D ( ) ( ( ) )/ ( ) t t TAS_induced_PVpot_rel RSDS . TAS PVpot , 6 3 ref
whereΔTAS_induced_PVpot_rel(t) is the
ΔTAS_in-duced_PVpot(t) relative to the reference period,
and PVpotref is the absolute value of PVpot for
the reference period, taken from the PVpot
climate response of the chain. Using RSDS( )t =
( )t /P ( )
PVpot . RSDSSTC R t from equation (1) we
obtain a D = ´ D ( ) ( ( ) ( )) ( ) / / t t P t TAS_induced_PVpot_rel .PVpot . RSDS . TAS PVpot , 7 R 3 STC ref
where PR(t) is computed from the raw simulations
according to equation(2), and PVpot(t) and PVpotref are taken from the PVpot climate response. The same
procedure is applied to W10 using(adaptation from
equation(5)) of [15]: a D = D ( ) ( ) ( ) t t W10_induced_PVpot RSDS . W10, 8 4
whereα4=7.64 × 10⁻⁶W m−2m s−1. Note that the uncertainty range is not presented for TAS-induced and W10-induced because they cannot be computed due to the expression of equations(5)–(8).
A.4. Analyzing the temporal variability
We analyze temporal variability at the daily and annual time scales. We compute both variables from 30 year periods. For interannual variability, wefirst detrend the time series of the annual values obtained for each GCM/RCM chain using the climate response of the
chain(to avoid capturing long-term changes rather
than those occurring at the scales of interest). For daily variability, the daily time series of each chain is also 11
detrended, and the annual cycle is removed(to avoid the masking effect of this cycle; practically, for each calendar day, the interannual mean value for that
calendar day is removed). The daily and yearly
variability are computed as the normalized standard deviation of these preprocessed time series, and expressed in %. The normalization consists in dividing the standard deviation by the climatology of the
reference period(1976–2005). The described
proce-dure is applied to each of the 17 raw time series of PVpot before computing the corresponding ensemble mean. Note that since variability is expressed in percentages, the projected changes in variability are given in percentage points.
Data availability statements
The data that support thefindings of this study are
openly available at https://doi.org/10.5676/EUM_
SAF_CM/SARAH/V002 ([44]; SARAH2); and https://doi.org/10.1594/WDCC/CXAF44CLCL
([45]; CORDEX-AFRICA CLM). The remaining
experiments from CORDEX-AFRICA (SMHI 2017,
DMI 2017, GERICS 2017, and KNMI 2017) data will
soon be openly available at DOI:https://cera-www.
dkrz.de/WDCC/ui/cerasearch/q?
page=0&query=cordex+AFR-44&rows=15.
ORCID iDs
Adeline Bichet https:
//orcid.org/0000-0003-1409-1620
Benoit Hingray
https://orcid.org/0000-0001-6991-0975
Guillaume Evin
https://orcid.org/0000-0003-3456-9441
Arona Diedhiou https:
//orcid.org/0000-0003-3841-1027
Sandrine Anquetin
https://orcid.org/0000-0001-5127-1650
References
[1] IRENA 2015 Africa 2030: Roadmap for a Renewable Energy Future(Abu Dhabi: International Renewable Energy Agency) [2] Plain N, Hingray B and Mathy S 2019 Accounting for low solar
resource days to size 100% solar microgrids power systems in Africa Renewable Energy131 448–58
[3] Redelsperger J-L, Thorncroft C D, Diedhiou A, Lebel T, Parker D J and Polcher J 2006 African monsoon
multidisciplinary analysis: an international research project andfield campaign Bull. Am. Meteorol. Soc.87 1739–46
[4] Sterl S, Liersch S, Koch H, van Lipzig N P M and Thiery W 2018 A new approach for assessing synergies of solar and wind power: implications for West Africa Environ. Res. Lett.13 094009
[5] Lothon M, Saïd F, Lohou F and Campistron B 2008 Observation of the diurnal cycle in the low troposphere of West Africa Mon. Weather Rev.136 3477–500
[6] Harrison E, Minnis P, Barkstrom B, Ramanathan V, Cess R and Gibson R 1990 Seasonal variation of cloud radiative
forcing derived from the Earth radiation budget experiment J. Geophys. Res.: Atmos.95 18687–703
[7] Dajuma A, Yahaya S, Touré E, Diedhiou A, Adamou R, Konaré A, Sido M and Golba M 2016 Sensitivity of solar photovoltaic panel efficiency to weather and dust over West Africa: comparative experimental study between Niamey (Niger) and Abidjan (Côte d’Ivoire) Comput. Water Energy, Environ. Eng.5 123–47
[8] Radziemska E 2003 The effect of temperature on the power drop in crystalline silicon solar cells Renew. Energy28 1–12
[9] Labordena M, Patt A, Bazilian M, Howells M and Lilliestam J 2017 Impact of political and economic barriers for
concentrating solar power in Sub-Saharan Africa Energy Policy
102 52–72
[10] Wild M, Folini D, Henschel F, Fischer N and Müller B 2015 Projections of long-term changes in solar radiation based on CMIP5 climate models and their influence on energy yields of photovoltaic systems Sol. Energy116 12–24
[11] Bartók B, Wild M, Folini D, Lüthi D, Kotlarski S, Schär C, Vautard R, Jerez S and Imecs Z 2017 Projected changes in surface solar radiation in CMIP5 global climate models and in EURO-CORDEX regional climate models for Europe Clim. Dyn.49 2665–83
[12] Giorgi F, Marinucci M R and Visconti G 1990 Use of a limited area model nested in a general circulation model for regional climate simulation over Europe J. Geophys. Res.95 413–8
[13] Paeth H and Mannig B 2013 On the added value of regional climate modeling in climate change assessment Clim. Dyn.41 1057–66
[14] Torma C S, Giorgi F and Coppola E 2015 Added value of regional climate modeling over areas characterized by complex terrain—precipitation over the Alps J. Geophys. Res.: Atmos.
120 3957–72
[15] Jerez S et al 2015 The impact of climate change on photovoltaic power generation in Europe Nat. Commun.6 10014
[16] Crook J A, Jones L A, Forster P M and Crook R 2011 Climate change impacts on future photovoltaic and concentrated solar power energy output Energy Environ. Sci.9 3101–9
[17] Zou L, Wang L, Li J, Lu Y, Gong W and Niu Y 2019 Global surface solar radiation and photovoltaic power from coupled model intercomparison project phase 5 climate models J. Clean. Prod.224 304–24
[18] Lawin A E, Niyongendako M and Manirakiza C 2019 Solar irradiance and temperature variability and projected trends analysis in burundi Climate7 83
[19] Ohunakin O S, Adaramola M S, Oyewola O M, Matthew O J and Fagbenle R O 2015 The effect of climate change on solar radiation in Nigeria Sol. Energy116 272–86
[20] Bazyomo S D Y B, A Lawin E, Coulibaly O and Ouedraogo A 2016 Forecasted changes in West Africa photovoltaic energy output by 2045 Climate4 53
[21] Giorgi F, Jones C and Asrar G R 2009 Addressing climate information needs at the regional level: the CORDEX framework WMO Bull. 58 175–83
[22] Hewitson B, Lennard C, Nikulin G and Jones C 2012 CORDEX-Africa: a unique opportunity for science and capacity building CLIVAR Exchanges 17 6–7
[23] Jones C G, Giorgi F and Asrar G 2011 The coordinated regional downscaling experiment: CORDEX; an international downscaling link to CMIP5 CLIVAR Exchanges 56 34–40 [24] Pfeifroth U, Kothe S, Mûller R, Trentmann J, Hollmann R,
Fuchs P and Werscheck M 2017 Surface Radiation Data Set— Heliosat (SARAH)—Edition 2 (Satellite Application Facility on Climate Monitoring) (https://doi.org/10.5676/
EUM_SAF_CM/SARAH/V002)
[25] Journée M and Bertrand C 2011 Quality control of solar radiation data within the RMIB solar measurements network Sol. Energy85 72–86
[26] IRENA 2018 Renewable Power Generation Coasts in 2017 (Abu Dhabi: International Renewable Energy Agency)
[27] Mavromatakis F et al 2010 Modeling the photovoltaic potential of a site Renew. Energy35 1387–90
[28] Evin G, Hingray B, Blanchet J, Eckert N, Morin S and Verfaillie D 2019 Partitioning uncertainty components of an incomplete ensemble of climate projections using data augmentation J. Clim.32 2423–40
[29] Hingray B and Saïd M 2014 Partitioning internal variability and model uncertainty components in a multimember multimodel ensemble of climate projections J. Clim.27 6779–98
[30] Giorgi F and Francisco R 2000 Uncertainties in regional climate change prediction: a regional analysis of ensemble simulations with the HADCM2 coupled AOGCM Clim. Dyn.16 169–82
[31] Patt A, Pfenninger S and Lilliestam J 2013 Vulnerability of solar energy infrastructure and output to climate change Clim. Change121 93–102
[32] IRENA 2016 Solar PV in Africa: Costs and Markets (Abu Dhabi: International Renewable Energy Agency)
[33] Ouedraogo N S 2017 Modeling sustainable long-term electricity supply-demand in Africa Appl. Energy190 1047–67
[34] Ouedraogo N S 2017 Africa energy future : alternative scenarios and their implications for sustainable development strategies Energy Policy106 457–71
[35] Trotter P A, Maconachie R and McManus M C 2018 Solar energy’s potential to mitigate political risks: the case of an optimised Africa-wide network Energy Policy117 108–26
[36] Lara-Fanego V, Ruiz-Arias J A, Pozo-Vazquez D,
Santos-Alamillos F J and Tovar-Pescador J 2012 Evaluation of the WRF model solar irradiance forecasts in Andalusia (southern Spain) Sol. Energy86 2200–17
[37] Prein A F et al 2015 A review on regional convection-permitting climate modelling: demonstrations, prospects, and challenges Rev. Geophys.53 232–361
[38] Gaetani M, Huld T, Vignati E, Monforti-Ferrario F, Dosio A and Raes F 2014 The near future availability of
photovoltaic energy in Europe and Africa in climate-aerosol modeling experiments Renew. Sustain. Energy Rev.38 706–16
[39] Liousse C, Assamoi E, Criqui P, Granier C and Rosset R 2014 Explosive growth in African combustion emissions from 2005 to 2030 Environ. Res. Lett.9 035003
[40] Collins M et al 2013 Long-Term Climate Change: Projections, Commitments and Irreversibility. In: Climate Change 2013: The Physical Science Basis. Contribution of Working Group I to the Fifth Assessment Report of the Intergovernmental Panel on Climate Change ed T F Stocker et al(Cambridge: Cambridge University Press)
[41] Chenni R, Makhlouf M, Kerbache T and Bouzid A 2007 A detailed modeling method for photovoltaic cells Energy32 1724–30
[42] De Soto W, Klein S A and Beckman W A 2006 Improvement and validation of a model for photovoltaic array performance Sol. Energy80 78–88
[43] Minemoto T, Nagae S and Takakura H 2007 Impact of spectrum irradiance distribution and temperature on the outdoor performance of amorphous Si photovoltaic modules Sol. Energy Mater. Sol. Cells91 919–23
[44] Müller R, Pfeifroth U, Träger-Chatterjee C, Cremer R, Trentmann J and Hollmann R 2015 Surface Solar Radiation Data Set—Heliosat (SARAH)—Edition 1 (Satellite Application Facility on Climate Monitoring) (https://doi.org/10.5676/ EUM_SAF_CM/SARAH/V001)
[45] Panitz H-J, Schubert-Frisius M and Dosio A 2015 CORDEX simulations(evaluation, historical, rcp85, and rcp45) on a ca. 50 km grid over Africa based on CCLM4-8-17 forced by MPI-ESM-LR, EC-EARTH, CNRM-CM5 and HadGEM2-ES. World Data Center for Climate(WDCC) at DKRZ (https:// doi.org/10.1594/WDCC/CXAF44CLCL)
13 Environ. Res. Lett. 14(2019) 124039
![Figure 1. Regional analyses are performed on the nine climatic regions adapted from [ 30 ] : 1](https://thumb-eu.123doks.com/thumbv2/123doknet/13677044.431131/5.892.184.826.92.506/figure-regional-analyses-performed-climatic-regions-adapted.webp)