HAL Id: hal-02166357
https://hal.inria.fr/hal-02166357v2
Submitted on 19 Nov 2019
HAL is a multi-disciplinary open access
archive for the deposit and dissemination of
sci-entific research documents, whether they are
pub-lished or not. The documents may come from
teaching and research institutions in France or
abroad, or from public or private research centers.
L’archive ouverte pluridisciplinaire HAL, est
destinée au dépôt et à la diffusion de documents
scientifiques de niveau recherche, publiés ou non,
émanant des établissements d’enseignement et de
recherche français ou étrangers, des laboratoires
publics ou privés.
Voxel-based assessments of treatment effects on
longitudinal brain changes in the Multidomain
Alzheimer Preventive Trial cohort
Raphaël Sivera, Nicolas Capet, Valeria Manera, Roxane Fabre, Marco Lorenzi,
Hervé Delingette, Xavier Pennec, Nicholas Ayache, Philippe Robert
To cite this version:
Raphaël Sivera, Nicolas Capet, Valeria Manera, Roxane Fabre, Marco Lorenzi, et al..
Voxel-based assessments of treatment effects on longitudinal brain changes in the Multidomain
Alzheimer Preventive Trial cohort.
Neurobiology of Aging, Elsevier, 2020, 94, pp.50-59.
Voxel based assessments of treatment effects on longitudinal brain
changes in the MAPT cohort
Raphaël Sivera
∗a, Nicolas Capet
d, Valeria Manera
b,c, Roxane Fabre
b,e, Marco Lorenzi
a,
Hervé Delingette
a, Xavier Pennec
a, Nicholas Ayache
a, and Philippe Robert
b,c,dfor the MAPT/DSA group
†a
Université Côte d’Azur, Inria Sophia Antipolis, Epione Research Project, France.
b
Université Côte d’Azur, CoBTeK lab, France.
c
Association Innovation Alzheimer, France.
d
Centre Hospitalier Universitaire (CHU) de Nice, CMRR, France.
e
Centre Hospitalier Universitaire (CHU) de Nice, Département de Santé Publique, France.
November 19, 2019
Abstract
Objective The Multidomain Alzheimer Preventive Trial (MAPT) was designed to assess the effect of omega-3 supplementation and multidomain intervention on cognitive decline of subjects with subjective memory complaint. In term of cognitive testing, no significant effect was found. In this paper, we evaluate the effect of the interventions on the brain morphological changes.
Methods Subjects with MRI acquisitions at baseline and at 36 months were included (N=376). Morpho-logical changes were characterized by volume measurements and nonlinear deformation.
Results The multidomain intervention was associated with a significant effect on the 3-year brain morpho-logical changes in the deformation-based approach. Differences were mainly located in the left periventricular area next to the temporoparietal junction. These changes were associated with better cognitive performance and mood/behavior stabilization. No effect of the omega-3 supplementation was observed.
Discussion This result suggests a possible effect on cognition, not yet observable after 3 years. We argue that neuroimaging could help define whether early intervention strategies are effective to delay cognitive decline and dementia.
Keywords: multidomain intervention, clinical trial, subjective memory complaint, deformation-based morphometry
∗Corresponding author at: Epione Research Project, INRIA Antipolis, 2004, route des Lucioles, 06902
Sophia-Antipolis, France, raphael.sivera@inria.fr
1
Introduction
1.1
The MAPT study
Subjective memory complaint (SMD) in individuals with unimpaired performance on cognitive tests is re-garded as a possible risk factor of Alzheimer’s disease (AD) (van Oijen et al., 2007). For this reason, people with SMD represent a promising population to put in place early interventions, and prevention strategies (An-drieu et al., 2008). Current evidence suggests that multi-domain interventions targeting nutrition, physical exercise, cognitive activity and social stimulation may improve cognitive health (Kivipelto et al., 2018) in older adults with SMD (Ngandu et al., 2015). For instance, an increase in omega-3 polyunsaturated fatty acid intake has been proposed as a possible intervention for preventing or delaying age-related cognitive decline (Dacks et al., 2013).
The Multidomain Alzheimer Preventive Trial (MAPT) was a 3-year multi-centric randomized placebo-controlled trial designed to assess the effect of omega-3 supplementation and a multidomain intervention (MDI) on cognitive decline of subjects with SMD. The multidomain intervention consisted of regular group sessions focusing on physical activity, cognitive training, nutritional advice and social stimulation and of an individual preventive consultation to follow each participant. The supplementation in omega-3 polyunsatu-rated fatty acids was tested in comparison with a placebo. 1680 Subjects were randomized in four parallel groups including three intervention groups (omega-3 alone, MDI plus placebo, MDI plus omega-3) and a placebo control group. All participants in the MAPT study underwent extensive and longitudinal clinical testing, including classical clinical scales and tasks to assess the physical and cognitive functioning, the au-tonomy in activities of daily living, and the presence cognitive and behavioral disturbances. Furthermore, a sub-sample of participants underwent structural magnetic resonance imaging (sMRI) both at baseline and at the end of the 3-year trial. A complete description of the trial is published in Vellas et al. (2015).
Andrieu et al. (2017) studied the effects of the treatments on the cognition, as indexed by a combination of classical clinical and cognitive tests, and found no significant differences between any of the three inter-vention groups and the placebo group. An hypothesis to explain these negative results is that the cognitive tests employed in MAPT study were not sensitive enough to detect subtle longitudinal changes in subjects with SMD, that, by definition, are characterized by non-impaired performance on classical cognitive testing. Screening neuropsychological tests are designed to have good inter-rater and test-retest reliability as well as concurrent validity and predictive validity in MCI and AD but also in other forms of dementia. However these tests may be less adapted for fine assessments of cognitive changes (Cullen et al., 2007) and they have been criticized for lack of sensitivity in patients with mild dementia or subjective cognitive complaints (Tierney, 2000).
Moreover, conclusions on the efficacy of such preventive strategy may be affected by the design of the interventions (choice of activities, frequency, supplementation dose, etc) and by the main dementia-related risk factors in the population (Isaacson et al., 2018). In order to design effective interventions, we need to be able to precisely assess the patient longitudinal condition and to focus on the most important interventions to limit the impact on the patient life (Robinson et al., 2018).
In this context, the assessment of brain morphological changes can provide complementary information on the interventions’ effect. A similar question was addressed in Stephen et al. (2019), the effect of a MDI on the brain morphology was evaluated for the Finnish Geriatric Intervention Study to Prevent Cognitive Impairment and Disability (FINGER). No significant effect was found on the morphological changes but a correlation between the baseline morphology and the cognitive benefits was highlighted.
In this paper, we investigate the effect of both MAPT interventions on brain morphology to verify whether brain changes may represent a more sensitive biomarker of the treatments’ effects.
1.2
Longitudinal modeling of the brain morphology
Structural magnetic resonance imaging (sMRI) has been proven helpful to characterize neuropsychiatric conditions (Bron et al., 2015; Jack et al., 2016; Lorenzi et al., 2017) or to assess the efficacy of specific
treatments (Lieberman, 2005).
In particular, knowledge of the spatial pattern and rate of decline of cerebral brain volume provides valuable information for detecting early neurodegenerative disease such as Alzheimer’s disease at different stages of disease progression (McDonald et al., 2009). For example, atrophy in Alzheimer’s disease is not uniform across brain regions, nor does it follow a linear trajectory. The atrophy rate is greater in early disease stages within the medial temporal cortex, and in later stages within prefrontal, parietal, posterior temporal and cingulate cortex (Risacher et al., 2010). This non-linear behavior of the atrophy is also characterized by an acceleration phase during the early stages of the disease, specifically hippocampal and entorhinal atrophy in mild cognitive impairment (Sabuncu et al., 2011; Devanand et al., 2007; Colliot et al., 2008). However, to our knowledge, there is no strong evidence that measure of regional brain atrophy is relevant to predict symptomatic change in patients with cognitive complaints and normal neuropsychological tests (Saykin et al., 2006; Sluimer et al., 2008).
These usual morphometric features are generally obtained from a priori defined regions of interests (ROIs) such as the hippocampi or the ventricles. They offer valuable quantitative assessments but can be limited and many alternatives have been proposed during the last decades to assess the local differences in brain tissues composition and shape (Ashburner and Friston, 2000; Qiu et al., 2007; Hutton et al., 2009).
Deformation based approaches describe the voxel-wise shape remodeling (Ashburner et al., 1998). Anatom-ical and morphologAnatom-ical differences are estimated using registration and modeled by diffeomorphic deforma-tions. These transformations of the space convey direct information on the visible changes of the brain. These approaches can be really powerful to describe the aging brain trajectory (Sivera et al., 2019) and to explore the potential morphological correlates to cognitive changes (Schmidt-Wilcke et al., 2009).
2
Method
2.1
Participants
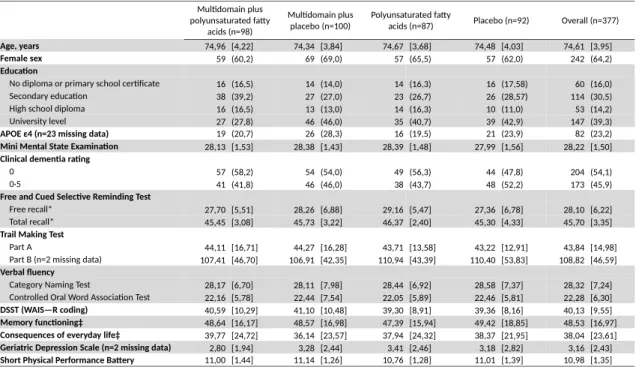
Every subjects of the MAPT cohort with two MRI acquisitions at baseline and 36 months were included. The total sample includes 377 subjects, randomized in the MDI plus omega-3 group (N=98), the MDI plus placebo group (N=100), the omega-3 alone group (N=87), or the placebo control group (N=92). The demographic features and the genetic, cognitive and functional profile of subjects at baseline are reported in Table 1.
Demographic data includes age, sex and education. Cognitive data include the Mini-Mental State Ex-amination (MMSE) (Folstein et al., 1975), the Free and Cued Selective Reminding Test (Grober et al., 1988), self-reported Visual-analogue scale (EVA) (McNair and Kahn, 1983), the Digit Symbol Substitu-tion Test (Wechsler, 1981), the Trail Making Tests (TMT-A and TMT-B) (Reitan, 1958)) and verbal letter fluency (Controlled Oral Word Association Test (Cardebat et al., 1990)). Behavioral and functional data include the Geriatric Depression Scale (GDS) (Yesavage et al., 1982), the Short Physical Performance Bat-tery (SPPB) (Guralnik et al., 2000) and everyday life assessments using the Alzheimer’s Disease Cooperative Study Activities of Daily Living Prevention Instrument (ADCS) (Galasko et al., 2006)).
In order to verify that the 3-year change of the subjects cognitive, behavioral and functional profile in our sub-sample (ie. subjects with two MRIs, N=377) is comparable to the original study population (N=1680), we submitted the scores changes (results at M36 minus results at baseline) of each of the available tests to separate ANOVAs with Group (MDI plus omega-3, MDI plus placebo, omega-3 alone, placebo) as between-subject factor.
One subject (from the omega-3 alone group) was excluded from the image analysis due to a failure of execution of the processing pipeline. The statistical analyses of the morphological changes, using segmentation and registration, were performed on 376 subjects.
Multidomain plus polyunsaturated fatty acids (n=98) Multidomain plus placebo (n=100) Polyunsaturated fatty
acids (n=87) Placebo (n=92) Overall (n=377) Age, years 74,96 [4,22] 74,34 [3,84] 74,67 [3,68] 74,48 [4,03] 74,61 [3,95] Female sex 59 (60,2) 69 (69,0) 57 (65,5) 57 (62,0) 242 (64,2) Education
No diploma or primary school certificate 16 (16,5) 14 (14,0) 14 (16,3) 16 (17,58) 60 (16,0) Secondary education 38 (39,2) 27 (27,0) 23 (26,7) 26 (28,57) 114 (30,5) High school diploma 16 (16,5) 13 (13,0) 14 (16,3) 10 (11,0) 53 (14,2) University level 27 (27,8) 46 (46,0) 35 (40,7) 39 (42,9) 147 (39,3) APOE ε4 (n=23 missing data) 19 (20,7) 26 (28,3) 16 (19,5) 21 (23,9) 82 (23,2) Mini Mental State Examination 28,13 [1,53] 28,38 [1,43] 28,39 [1,48] 27,99 [1,56] 28,22 [1,50] Clinical dementia rating
0 57 (58,2) 54 (54,0) 49 (56,3) 44 (47,8) 204 (54,1) 0·5 41 (41,8) 46 (46,0) 38 (43,7) 48 (52,2) 173 (45,9) Free and Cued Selective Reminding Test
Free recall* 27,70 [5,51] 28,26 [6,88] 29,16 [5,47] 27,36 [6,78] 28,10 [6,22] Total recall* 45,45 [3,08] 45,73 [3,22] 46,37 [2,40] 45,30 [4,33] 45,70 [3,35] Trail Making Test
Part A 44,11 [16,71] 44,27 [16,28] 43,71 [13,58] 43,22 [12,91] 43,84 [14,98] Part B (n=2 missing data) 107,41 [46,70] 106,91 [42,35] 110,94 [43,39] 110,40 [53,83] 108,82 [46,59] Verbal fluency
Category Naming Test 28,17 [6,70] 28,11 [7,98] 28,44 [6,92] 28,58 [7,37] 28,32 [7,24] Controlled Oral Word Association Test 22,16 [5,78] 22,44 [7,54] 22,05 [5,89] 22,46 [5,81] 22,28 [6,30] DSST (WAIS—R coding) 40,59 [10,29] 41,10 [10,48] 39,30 [8,91] 39,36 [8,16] 40,13 [9,55] Memory functioning‡ 48,64 [16,17] 48,57 [16,98] 47,39 [15,94] 49,42 [18,85] 48,53 [16,97] Consequences of everyday life‡ 39,77 [24,72] 36,14 [23,57] 37,94 [24,32] 38,37 [21,95] 38,04 [23,61] Geriatric Depression Scale (n=2 missing data) 2,80 [1,94] 3,28 [2,44] 3,41 [2,46] 3,18 [2,82] 3,16 [2,43] Short Physical Performance Battery 11,00 [1,44] 11,14 [1,26] 10,76 [1,28] 11,01 [1,39] 10,98 [1,35]
Data are mean (SD), or n (%), unless otherwise specified. Percentages were calculated on the basis of the number of participants for whom data were available for each criterion. DSST=Digit Symbol Substitution Test. WAIS—R=Wechsler Adult Intelligence Scale—Revised. ADCSADLPI=Alzheimer’s Disease Cooperative Study Activities of Daily Living Prevention Instrument. *48 is the total possible score. ‡Measured on a visual analogue scale.
2.2
Regional atrophy and cortical thickness assessments
First, the longitudinal morphological changes were evaluated using cortical thickness and sub-cortical volu-metric measures. The imaging data was processed using the longitudinal stream available in the FreeSurfer software (Reuter et al., 2012). We decided to focus our analysis on the regions of the brain well-known to be atrophying in dementia from early stages (MCI) to severe stages (Whitwell et al., 2007). The changes were measured between the baseline and the 36-month follow-up.
For the volumetric information 24 regions were selected, and changes in global left plus right regions were computed for 9 of these regions. The cortical thickness was evaluated in 34 regions of each hemispheres. Similarly the left/right averages were added to the analysis. We also assessed the effect on changes on the total white and gray-matter volume and the brain parenchyma fraction (BPF). In total the morphology is characterized by 142 scalar variables (the extensive list is available in supplementary material) giving an exploratory overview of a large spectrum of possible changes.
The difference between the treatment groups was tested using an ordinary linear model with no cross effect. A non-parametric re-randomization test was performed to correct for multiple comparisons.
2.3
Statistical analysis of the deformations
2.3.1 Modeling the brain morphology
The deformation-based approach used in this work is based on an efficient parametrization of diffeomorphisms using stationary velocity fields (Arsigny et al., 2006). In this setting, smooth and reversible deformations that spatially align the anatomies are estimated through non-linear registration (Lorenzi and Pennec, 2014) between pairs of images. These deformations are fully parametrized by the flow of a stationary velocity field (SVF). From these deformations it is possible to compute the corresponding volume changes locally in the brain (Lorenzi et al., 2013), but it is also possible to analyze the longitudinal intra-subject trajectory directly in the deformation space using the SVFs transported in a common reference space where they can be compared (Hadj-Hamou et al., 2016).
2.3.2 Assessing the effect of the treatments on the brain
The objective was to assess the effect of both MAPT interventions (MDI and omega-3 supplementation) on the brain morphological changes. To do so, we tested the H0 hypothesis that the treatments were not
correlated with the vector fields parametrizing the deformations. However these fields are high dimensional and repeating the test for every voxel will result in a large number of correlated tests. To address this problem, we used a non-parametric re-randomization test to control for family-wise error rate (FWER). This statistical approach does not require strong assumptions on the data distribution, especially when the patients are in a randomized trial, and is well fitted to the neuroimaging settings (Nichols and Holmes, 2002).
Several statistics can be used at the voxel level; most of them are based on the comparison of the residual variance matrix and the model variance matrix. Here, the voxel statistic was based on the likelihood ratio to compare the goodness of fit between the linear model taking into account the treatments and the constant model. No additional covariate was included in our model. The maximum of this statistic was then used to summarize the result over the whole brain.
For each random permutation of the subjects, the maximum of the likelihood-ratio statistic map is com-puted on the whole brain area. These values give an empirical distribution of the maximum statistic under
H0. This empirical distribution allows us to compute, for the real group assignment, the resulting p-value.
In order to get a reliable p-value estimation, N = 2000 permutations were computed. Indeed, the standard deviation of the p-value estimation at a significance level of α = 0.05 is equal to:
P =pα(1 − α)/N ≈ 0.005
multidomain intervention variables individually. For these analyses the same permutations of the 376 subjects were used, the only difference being that the linear model tested only took into account one variable of interest. Results about the existence of a global difference in morphological change are not really informative and we are also interested in the interpretation of the eventual difference and their relation to a progression toward more advanced diseased stages. To achieve this we first visualized the voxel-wise z-value maps. They give insights on where the difference were correlated with the treatments. Then, the mean changes were computed for each subgroups, and the local differences were highlighted. This allows to make hypotheses about the properties of these differences.
3
Results
3.1
Cognitive, behavioral and functional assessment
Results regarding the 3-year change of the subjects cognitive, behavioral and functional profile in our sub-sample are reported in Table 2. The score changes (results at M36 minus results at baseline) of each of the available tests are evaluated using ANOVAs with Group (MDI plus omega-3, MDI plus placebo, omega-3 alone, placebo) as between-subject factor.
Difference between (score at 3 years - score at baseline) Multidomain plus polyunsaturated fatty acids (n=98) Multidomain plus placebo (n=100) Polyunsaturated fatty acids (n=87) Placebo (n=92)
Mean [SD] Mean [SD] Mean [SD] Mean [SD] p-valuea
Mini Mental State Examination 0,14 [1,69] -0,14 [1,89] -0,11 [1,89] -0,28 [2,40] 0,525 Free and Cued Selective Reminding Test
Free recall* 1,93 [4,95] 1,32 [5,68] 1,59 [5,48] 1,49 [5,61] 0,886 Total recall* 0,27 [2,75] -0,40 [4,90] -0,32 [2,99] -1,12 [6,44] 0,218 Trail Making Test
Part A -3,32 [12,30] -1,93 [17,77] -1,62 [15,82] -1,46 [12,52] 0,818 Part B -1,56 [34,20] -2,10 [35,37] -3,78 [36,03] -2,32 [58,45] 0,988 Verbal fluency
Category Naming Test -1,06 [6,10] 1,05 [6,72] 0,90 [8,55] -1,38 [6,67] 0,027 Controlled Oral Word Association Test 0,36 [5,37] 1,13 [5,69] 1,65 [6,43] -0,20 [6,38] 0,167 DSST (WAIS—R coding) 0,26 [5,09] 1,13 [5,44] 1,12 [6,42] -0,31 [6,21] 0,256 Memory functioning‡ -0,78 [17,62] -0,27 [17,98] 1,48 [17,25] 1,36 [22,82] 0,800 Consequences of everyday life‡ -5,84 [29,48] -4,76 [23,98] -3,27 [23,31] 3,13 [26,48] 0,085 Geriatric Depression Scale 0,01 [2,48] -0,41 [2,53] 0,13 [2,83] -0,03 [2,43] 0,494 Short Physical Performance Battery -0,16 [1,68] -0,10 [1,37] -0,12 [1,68] -0,41 [1,62] 0,534
aANOVA
DSST=Digit Symbol Substitution Test. WAIS—R=Wechsler Adult Intelligence Scale—Revised. ADCSADLPI=Alzheimer’s Disease Cooperative Study Activities of Daily Living Prevention Instrument. *48 is the total possible score. ‡Measured on a visual analogue scale.
Table 2: Changes of the cognitive, behavioral and functional assessments in the three intervention groups compared with the control group.
Converging with previous reports (Andrieu et al., 2017), no significant effect of the intervention was found on the overall cognitive decline (Mini-Mental State Examination), on depression (Geriatric Depression Scale), and on physical fitness (Short Physical Performance Battery). Similarly, no consequences were found on everyday life (Alzheimer’s Disease Cooperative Study Activities of Daily Living Prevention Instrument). Concerning the change of the cognitive profile, no effect of group was found on the memory (as indexed by classical neurophysiological tests – Free and Cued Selective Reminding Test – and self-report – Visual-analogue scale EVA) attention and executive functions (Digit Symbol Substitution Test and TMT-A and TMT-B) or verbal letter fluency (Controlled Oral Word Association Test). A significant effect on semantic verbal fluency (Category Naming Test) was found (p=.027), but post-hoc comparisons (Bonferroni corrected) revealed no-significant difference between the three intervention groups and the control group, and among the
different intervention groups. These results argue that our subsample (N=377) is comparable to the original study population (N=1680).
3.2
Segmentation-based statistical analysis of the intervention’s effect
These results rely on the longitudinal processing stream of the FreeSurfer software. All the results for the change of every volumes and cortical thickness are reported in supplementary material. Table 3 summarizes the global result. No effect was observable in any regions, including the total white-matter, gray-matter or brain volume to intra cranial volume, for both interventions. This absence of observable effect is not related to the large number variables selected in this exploratory approach. Indeed the strongest difference were measured in the corpus callosum posterior and the left thalamus and their respective p-values without correction (respectively 0.036 and 0.043) were quite large. As a consequence no meaningful conclusion or hypothesis can be drawn from this experiment.
Fisher statistic univariate p-value corrected p-value (parametric) (2000 permutations)
Brain volume 1.10 0.333 1.
Cortical gray matter 0.73 0.481 1.
White matter 1.78 0.170 1.
Summary (maximum) 3.35 0.036 0.80
Table 3: Statistical analysis of morphological assessments relatively to treatment groups. Differences are evaluated using a simple linear model with no cross-effect. We report here the results for a selection of variables and for the global statistic. The complete results for the 142 morphological variables are reported in supplementary material. The maximum is attained on the volume of the posterior corpus callosum but the result is not significant after correction for multiple tests.
3.3
Deformation-based statistical analysis of the intervention’s effect
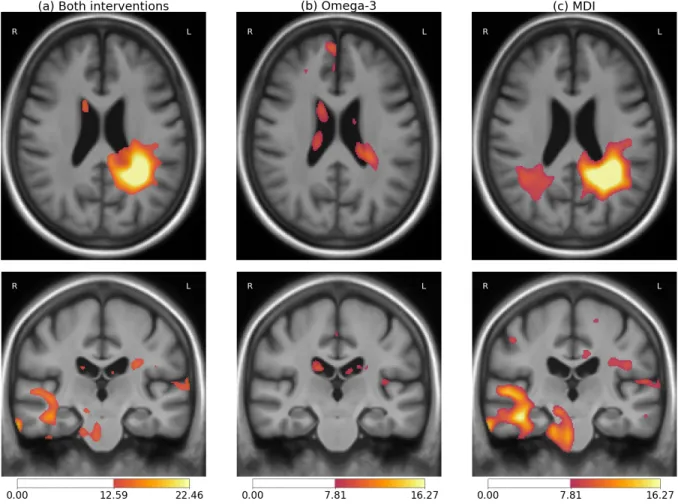
A significant effect of the treatments was found on the morphological changes over the 3 years of follow-up (p-value = 0.018). This result for the primary efficacy analysis jointly considers both treatments (MDI and omega-3) and is corrected for the whole brain voxel-wise comparisons. The localization of this effect is visible in Figure 1a. The effect is stronger in the periventricular area in the left hemisphere near the temporoparietal junction (TPJ). Few differences are also visible in the right temporal lobe, but these are not statistically significant.
Further testing was conducted to evaluate if the observed effect was associated with the omega-3 or the MDI. Firstly, the linear model associated with the omega-3 was found not to be significantly better than the constant model (p-value = 0.927). In this context, the small differences visible in Figure 1b in the ventricles – a region that often reflects morphological changes affecting the brain at a larger scale – may not even be specifically associated with the treatment. Secondly, the MDI-only model led to significant results (p-value = 0.026). Moreover the pattern observed for the MDI was really similar to the one found for the joint modeling (see Figure 1c). Finally, the model taking into account both variables did not perform significantly better than the one taking into account the MDI only (p-value=0.933).
To summarize, the observed morphological differences were only associated with the MDI. The full 3-dimensional statistical z-map for the MDI is then reproduced in Figure 2. The positive cluster extent in the left posterior periventricular area seems to indicate a relatively localized effect. However the non-significant differences in the corresponding area in the right hemisphere and in the right temporal lobe may indicate the existence of changes in regions We should also keep in mind that the effect can be smoothed by the
Figure 1: Localization of the treatments effect on the longitudinal morphological changes for: (a) both categorical variables associated with the omega-3 supplementation and the multidomain intervention, (b) omega-3 only, (c) multidomain intervention only. Color bars indicate the magnitude of the z-values for the likelihood-ratio test for the variables of interest in the linear regression of the local deformation parameters. High values indicate a difference in the morphological changes that is associated with the treatment status. Intensity thresholds correspond to the non-corrected parametric testing at level 0.05 (lower threshold) and 0.001 (higher threshold).
regularization of the deformations and that the displacements which are visible in this area could be induced by morphological changes in other parts of the brain.
Figure 2: Multi-slices visualization of the MDI effect on the longitudinal morphological changes. Color bars indicate the magnitude of z-values for the corresponding test. This figure proposes a more complete visualization of the results shown in Figure 1(c). Slices are sampled regularly every 12 mm in the longitudinal axis and every 15 mm along the axial axis.
3.4
Description of the MDI effect on the brain morphology
In this section we focus on the description of the MDI effect. The omega-3 status is ignored to increase sample sizes as no morphological effect have been found. We first consider the group-average deformations, then the log-Jacobian of the SVFs are computed to assess the atrophy associated with these deformations (see Lorenzi et al. (2013)).
Figure 3 represents the mean velocity fields parametrizing the longitudinal deformations for the group undergoing MDI and for the control group. Both fields are similar and correspond to a normal aging process. The difference in the periventricular area is nonetheless visible with a deformation of smaller amplitude for the MDI group. The localization of the effect is visible with an asymmetrical pattern and a stronger difference in the left TPJ. We also note a reduction of the deformation in both temporal lobes for subjects undergoing the MDI.
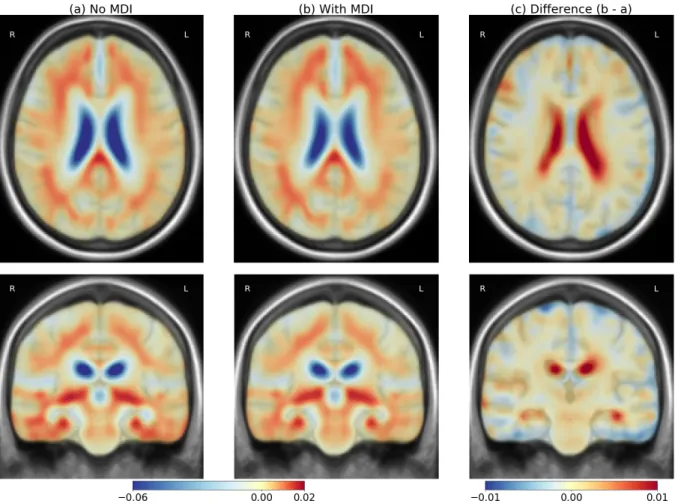
The log-Jacobian maps are represented in Figure 4 to shows the local volume changes induced by the average deformations with or without the MDI. The difference shows a reduction of the atrophy in the whole brain: there is less atrophy in the parenchyma and less expansion in the CSF. Relatively to the deformations, the spatial pattern is less localized and the specific effect in the left TPJ is less visible. This observation suggests that the longitudinal difference is associated with a global difference in volume loss but also a more complex reconfiguration of the morphology.
The atrophy maps are also integrated using the 44-region FreeSurfer segmentation introduced in sec-tion 3.2. This operasec-tion gives another estimasec-tion of the volume changes of the regions of interest. The statistical analysis of these results shows a stronger effect of the MDI on the left lateral ventricle, the left inferior ventricle and the right hippocampus. However there is no significant result when correcting for mul-tiple comparisons. This analysis reinforces the hypothesis of a difference that is only partially due to volume changes and is associated to a more complex morphological reconfiguration.
Figure 3: Mean velocity fields parametrizing the deformations for the subjects without MDI (left) and with MDI (center). The difference (right, scaled x5) highlights the changes associated with the intervention. The two means are really similar, the main difference is a smaller amplitude of deformation in the periventricular area.
Figure 4: Mean atrophy for the subjects without MDI (left) and with MDI (center) and the difference (right) to highlights the changes associated with the intervention. The two means are really similar, the difference correspond to a global slower atrophy pattern.
3.5
Relation to cognitive and behavioral scores
No direct cognitive effects of the treatment was observed. However, it is possible to relate the observed morphological differences to clinical assessments in order to better interpret the results. In this section we measured the correlation between the MDI specific morphological effect and the cognitive changes measured by the clinical scores.
In the previous section, a regression model was used to evaluate the effect of the MDI on the morphology. The SVFs that parametrized this model were used to linearly decomposed the individual trajectories. The explanatory variable resulting from this decomposition was then analyzed in relation with the change of four cognitive and behavioral scores as measured by the difference in score between the 3-year followup and the baseline.
The four selected variables, introduced previously, are the Mini Mental State Examination (MMSE), the Geriatric Depression Scale (GDS), the free recall test and the category naming verbal fluency test. The analysis was done using the whole population (i.e. the 376 subjects).
The correlation between the coefficients of the morphological decomposition and each clinical variable was assessed using a Fisher test. The results are presented in Table 4. The intercept measures the average change in cognitive/behavioral score in the whole population while the coefficient corresponds to the additional change that is associated to the longitudinal morphological difference between the control and the MDI group.
The MDI specific brain changes were significantly associated with positive cognitive and behavioral effects: decrease in the GDS total score and increase of the memory recall test. For comparison, no significant change in GDS was observed for the control group while a general improvement in recall performance was observed for the overall population (the morphological changes of interest being associated with greater amelioration). The effect on MMSE and fluency was not significant but, in both cases, it corresponded to a slowing of the cognitive decline.
F-test p-value intercept [CI] coefficient [CI] MMSE 0.078 -0.14 [ -0.35, +0.066] 0.097 [ -0.011, +0.2] GDS 0.011 0.013 [ -0.25, +0.28] -0.18 [ -0.32, -0.042]
Recall <0.001 1.3 [ +0.71, +1.8] 0.55 [ +0.26, +0.84]
Fluency 0.44 -0.2 [ -0.94, +0.55] 0.15 [ -0.23, +0.54]
Table 4: Test for correlation between the MDI morphological effect and the cognitive and behavioral clinical assessments. The intercepts correspond to the average 3-year change, the coefficients correspond to the additional score change for a morphological change equal to the difference between the control group and the MDI group.
4
Discussion
4.1
Interpretation of the morphological changes
The statistical analysis of the brain deformations estimated from structural MRIs showed a possible effect of the MDI on the morphological changes. Differences were observed in periventricular area and in the temporal lobes in an asymmetrical pattern. The effect was stronger in the left hemisphere near the precuneus and using non-parametric analyses, we showed that this effect was statistically significant.
The localization of this effect in the deep white matter may indicate a direct effect on the myelinised axons in this area. Damages on the white matter tracks are not necessarily correlated with cortical atrophy in patients with mild cognitive impairment Agosta et al. (2011) and these changes could be early signs of the decline before the cortical atrophy. Moreover physiological changes in this area may have complex
implications on the general cognitive condition and are consequently hard to characterize using cognitive testing.
The asymmetry could be related to the selection of exercises proposed in the MDI. A focus on tasks strongly relying on language would be associated with a stronger effect on the left hemisphere. While lexical-semantic processing is not affected in every case of AD, it is well established that this domain is typically affected early in the disease course, and it thus constitutes a primary target for detection and prognosis of MCI (Taler and Phillips, 2008).
Similarities can be found with early Alzheimer atrophy patterns where cortical atrophy is first observed in the temporal lobes, in the inferior parietal and posterior cingulate (McDonald et al., 2009). The difference of atrophy measured between controls and MDI subjects is smoother and less localized but is not incom-patible with this pattern. Thompson et al. (2007) demonstrated that cortical atrophy occurred earlier and progressed faster in the left hemisphere than in the right in patients with Alzheimer’s disease. Hippocampal asymmetry was found to significantly reduce in subjects with dementia (Barnes et al., 2005; Shi et al., 2009). Cerebral atrophy and asymmetry changes in cognitively impaired patients are less understand and less well-established in comparison with healthy aging. As brain asymmetry is believed to be favorable for efficient multitask information processing and survival (Rogers, 2002), the shifted lateralization of healthy elderly in caudal anterior cingulate, parahippocampal, and entorhinal gyri may be more protective and compensatory than destructive in the maintenance of the cognitive and emotional homeostasis (Lütcke and Frahm, 2008), probably in response to the regional atrophy and decreased laterality during aging (Liu et al., 2010; Sowell et al., 2003). In our case, one interpretation is that the intervention would increase or contribute to maintain the cognitive reserve in these areas leading to an asymmetric delay on the disease progression.
More generally, the global reduction of deformation and atrophy that is associated with the MDI, may indicate that a slower progression thanks to the interventions.
4.2
Limitations
The selected morphometric approach gives a rough localization of visible structural displacements in the brain. The localization incertitude is reinforced by the fact that registration algorithms are not able to accurately estimate deformations in homogeneous intensity areas. By consequence, the method can be more sensitive in high contrast area and miss some information elsewhere. For example, the differences are always more visible at the ventricles boundaries (high contrast between the tissue and the CSF) and this bias may contribute to the localization of the findings. Moreover the deformation is not always directly related to local volume changes and the atrophy of a region creates apparent displacements in neighboring regions. The use of a full diffeomorphic deformation is powerful to detect subtle changes but the increase in complexity and generality makes the interpretation of the results more difficult.
Concerning the clinical implication, the interpretation is also complex because we can only consider the joint effect of the MDI which regroups a large spectrum of activity (social interactions, physical cognitive exercises, nutritional advice, etc.). The interpretation is also made difficult because no direct effect of the treatments on the cognitive changes has been shown. The analysis presented in section 3.5 proposes a first evaluation of the relation between these morphological changes and the cognitive condition. However these relations are evaluated on the same dataset and the results could be really sensitive to hidden exogenous variables.
The implementation of the statistical model has its own limitations. It makes the GLM model appli-cable to multivariate fields but does not includes alternative approaches such as mixed-effect modeling or computational optimizations. It would also be interesting to try to replicate these results with a different morphological modeling and statistical approach as the model choice and the software may influence the findings (Bowring et al., 2018).
Finally, some limitations that have been highlighted regarding the MAPT study (see Yassine and Schneider (2017); Coley and Andrieu (2017)) are particularly relevant for our work. First the absence of effect of the omega-3 may be related to the prescribed doses or by the relatively short duration of the study (3 years
only). Second, in the assessment of the effect of the MDI, we need to be aware that this intervention was not double-blind due to the nature of the intervention.
4.3
Perspectives
Further analyses should be done to better understand the nature of the changes, their localization and the long-term consequence on the cognition.
An analysis of the deformation over a longer time interval could increase the accuracy of the estimation. It would also make it possible to link the local deformations to the cognitive evaluation despite the intrinsic variability of these assessments. Then, in conjunction with structural images, metabolic or functional imaging would give complementary information on the localization and the nature of the changes. Diffusion imaging could help validating the hypothesis concerning the effect of the interventions on the white matter tracks.
In order to design better protocols, it would be interesting to know the relative contribution of each intervention within the MDI. We should however note that the observed joint effect is relatively weak and it would not be an easy task. The asymmetry of the findings suggesting a possible language-related effect, it would also be interesting to have more lexical-semantic tests in futures multidomain interventions trials.
It would also be useful to be able to adapt to the specific patient needs. Stephen et al. (2019) suggest that the MDI may be more effective for patients with less morphological changes. A similar analysis could be done for the MAPT and, more generally, neuroimaging could be helpful to personalize the intervention to the patient condition.
Finally, the long-term effect on cognition should be assessed. The correlation of the morphological effect with the cognitive and behavioral changes suggests a possible long-term improvement of the subjects cognitive and behavioral profile that could be comparable to the normal speed of the cognitive decline. It could be interesting to focus on cognitive tests evaluating functions which rely on the highlighted areas. However even if these changes are correlated, we have no proof that the MDI has a long-term protective effect that could be used for the prevention of the cognitive decline and of an eventual dementia.
5
Conclusion
In the context of the MAPT study, a significant effect of the multidomain intervention on the brain morphol-ogy was found. The voxel-wise deformation-based approach highlights differences in the white matter near the left temporoparietal junction. These morphological changes correspond to a slower age progression and are correlated with better performance in cognitive assessment. These results are in agreement with previous studies suggesting a positive effect of a similar intervention on cognitive health in older adults (Kivipelto et al., 2018). No visible effect was found for the omega-3 supplementation relatively to the placebo. To go further, the long-term effects of the intervention on the cognitive and behavioral condition should be evaluated.
From the methodological standpoint, the results of the present study suggest that the statistical analysis of longitudinal deformations may be a powerful tool to assess the morphological changes and the effect of a treatment even without priors on the affected areas. In this work, we were unable to observe these differences using the volumetric approach, which suggest that the observed effect is associated with a complex morphological reconfiguration that cannot be reduced to simple local volume changes. This work thus suggests that the morphological changes may be helpful to link physiological changes and cognitive changes, even before the changes in cognitive functions are clinically relevant.
In the light of the lack of results on the clinical criteria used in MAPT patients and our results, future interventional trials on subjects with SMD or in the early stages of the disease progression should include alternative to the classical cognitive, behavioral and functional assessment, potentially more sensitive to subtle changes. The joint use of more specific clinical and image-based biomarkers changes could allow earlier detection of a risk of conversion in MCI or AD.
6
Declaration of interests
The authors have no competing interests to declare.
7
Acknowledgment
7.1
Funding
This work, part of the MNC3 (Medicine Numérique, Cerveau Cognition Comportement) has been supported by the French government, through the UCAJEDI Investments in the Future project managed by the National Research Agency (ANR) with the reference number ANR-15-IDEX-01.
This project has received funding from the European Research Council (ERC) under the European Union’s Horizon 2020 research and innovation program (grant G-Statistics agreement No 786854).
The MAPT study was supported by grants from the Gérontopôle of Toulouse, the French Ministry of Health (PHRC 2008, 2009), Pierre Fabre Research Institute (manufacturer of the omega-3 supplement), Exhonit Therapeutics SA, and Avid Radiopharmaceuticals Inc. The promotion of this study was supported by the University Hospital Center of Toulouse. The data sharing activity was supported by the “Association Monegasque pour la recherche sur la maladie d’Alzheimer”(AMPA) and the INSERM – University of Toulouse III UMR 1027 Unit.
7.2
The MAPT group
MAPT Study Group Principal investigator: Bruno Vellas (Toulouse); Coordination: Sophie Guyonnet; Project leader: Isabelle Carrié; CRA: Lauréane Brigitte; Investigators: Catherine Faisant, Françoise Lala, Julien Delrieu, Hélène Villars; Psychologists: Emeline Combrouze, Carole Badufle, Audrey Zueras; Method-ology, statistical analysis and data management: Sandrine Andrieu, Christelle Cantet, Christophe Morin; Multidomain group: Gabor Abellan Van Kan, Charlotte Dupuy, Yves Rolland (physical and nutritional components), Céline Caillaud, Pierre-Jean Ousset (cognitive component), Françoise Lala (preventive consul-tation). The cognitive component was designed in collaboration with Sherry Willis from the University of Seattle, and Sylvie Belleville, Brigitte Gilbert and Francine Fontaine from the University of Montreal. Co-Investigators in associated centres: Jean-François Dartigues, Isabelle Marcet, Fleur Delva, Alexandra Foubert, Sandrine Cerda (Bordeaux); Marie-Noëlle-Cuffi, Corinne Costes (Castres); Olivier Rouaud, Patrick Manckoundia, Valérie Quipourt, Sophie Marilier, Evelyne Franon (Dijon); Lawrence Bories, Marie-Laure Pader, Marie-France Basset, Bruno Lapoujade, Valérie Faure, Michael Li Yung Tong, Christine Malick-Loiseau, Evelyne Cazaban-Campistron (Foix); Françoise Desclaux, Colette Blatge (Lavaur); Thierry Dan-toine, Cécile Laubarie-Mouret, Isabelle Saulnier, Jean-Pierre Clément, Marie-Agnès Picat, Laurence Bernard-Bourzeix, Stéphanie Willebois, Iléana Désormais, Noëlle Cardinaud (Limoges); Marc Bonnefoy, Pierre Livet, Pascale Rebaudet, Claire Gédéon, Catherine Burdet, Flavien Terracol (Lyon), Alain Pesce, Stéphanie Roth, Sylvie Chaillou, Sandrine Louchart (Monaco); Kristelle Sudres, Nicolas Lebrun, Nadège Barro-Belaygues (Montauban); Jacques Touchon, Karim Bennys, Audrey Gabelle, Aurélia Romano, Lynda Touati, Cécilia Marelli, Cécile Pays (Montpellier); Philippe Robert, Franck Le Duff, Claire Gervais, Sébastien Gonfrier (Nice); Yannick Gasnier and Serge Bordes, Danièle Begorre, Christian Carpuat, Khaled Khales, Jean-François Lefebvre, Samira Misbah El Idrissi, Pierre Skolil, Jean-Pierre Salles (Tarbes).
MRI group: Carole Dufouil (Bordeaux), Stéphane Lehéricy, Marie Chupin, Jean-François Mangin, Ali Bouhayia (Paris); Michèle Allard (Bordeaux); Frédéric Ricolfi (Dijon); Dominique Dubois (Foix); Marie Paule Bonceour Martel (Limoges); François Cotton (Lyon); Alain Bonafé (Montpellier); Stéphane Chanalet (Nice); Françoise Hugon (Tarbes); Fabrice Bonneville, Christophe Cognard, François Chollet (Toulouse). PET scans group: Pierre Payoux, Thierry Voisin, Julien Delrieu, Sophie Peiffer, Anne Hitzel, (Toulouse); Michèle Allard (Bordeaux); Michel Zanca (Montpellier); Jacques Monteil (Limoges); Jacques Darcourt (Nice). Medico-economics group: Laurent Molinier, Hélène Derumeaux, Nadège Costa (Toulouse).
Safety management : Pascale Olivier-Abbal
DSA Group Sandrine Andrieu, Christelle Cantet, Nicola Coley
References
Agosta, F., Pievani, M., Sala, S., Geroldi, C., Galluzzi, S., Frisoni, G.B., Filippi, M., 2011. White Matter Damage in Alzheimer Disease and Its Relationship to Gray Matter Atrophy. Radiology 258, 853–863. doi:10.1148/radiol.10101284.
Andrieu, S., Guyonnet, S., Coley, N., Cantet, C., Bonnefoy, M., Bordes, S., Bories, L., Cufi, M.N., Dantoine, T., Dartigues, J.F., Desclaux, F., Gabelle, A., Gasnier, Y., Pesce, A., Sudres, K., Touchon, J., Robert, P., Rouaud, O., Legrand, P., Payoux, P., Caubere, J.P., Weiner, M., Carrié, I., Ousset, P.J., Vellas, B., 2017. Effect of long-term omega 3 polyunsaturated fatty acid supplementation with or without multidomain intervention on cognitive function in elderly adults with memory complaints (MAPT): a randomised, placebo-controlled trial. The Lancet Neurology 16, 377–389. doi:10.1016/S1474-4422(17)30040-6. Andrieu, S., Ousset, P.J., Coley, N., Ouzid, M., Mathiex-Fortunet, H., Vellas, B., 2008. Guidage study: a
5-year double blind, randomised trial of egb 761 for the prevention of alzheimer’s disease in elderly subjects with memory complaints. i. rationale, design and baseline data. Current Alzheimer Research 5, 406–415. Arsigny, V., Commowick, O., Pennec, X., Ayache, N., 2006. A log-euclidean framework for statistics on
diffeomorphisms. Medical Image Computing and Computer-Assisted Intervention-MICCAI 2006 , 924– 931.
Ashburner, J., Friston, K.J., 2000. Voxel-Based Morphometry—The Methods. NeuroImage 11, 805–821. doi:10.1006/nimg.2000.0582.
Ashburner, J., Hutton, C., Frackowiak, R., Johnsrude, I., Price, C., Friston, K., 1998. Identifying global anatomical differences: Deformation-based morphometry. Human brain mapping 6, 348–357.
Barnes, J., Scahill, R.I., Schott, J.M., Frost, C., Rossor, M.N., Fox, N.C., 2005. Does Alzheimer’s Disease Affect Hippocampal Asymmetry? Evidence from a Cross-Sectional and Longitudinal Volumetric MRI Study. Dementia and Geriatric Cognitive Disorders 19, 338–344. doi:10.1159/000084560.
Bowring, A., Nichols, T.E., Maumet, C., 2018. Same data-different software-different results? analytic variability of group fmri results, in: OHBM 2018-24th Annual Meeting of the Organization for Human Brain Mapping, pp. 1–3.
Bron, E.E., Smits, M., van der Flier, W.M., Vrenken, H., Barkhof, F., Scheltens, P., Papma, J.M., Steketee, R.M., Méndez Orellana, C., Meijboom, R., Pinto, M., Meireles, J.R., Garrett, C., Bastos-Leite, A.J., Abdulkadir, A., Ronneberger, O., Amoroso, N., Bellotti, R., Cárdenas-Peña, D., Álvarez Meza, A.M., Dolph, C.V., Iftekharuddin, K.M., Eskildsen, S.F., Coupé, P., Fonov, V.S., Franke, K., Gaser, C., Ledig, C., Guerrero, R., Tong, T., Gray, K.R., Moradi, E., Tohka, J., Routier, A., Durrleman, S., Sarica, A., Di Fatta, G., Sensi, F., Chincarini, A., Smith, G.M., Stoyanov, Z.V., Sørensen, L., Nielsen, M., Tangaro, S., Inglese, P., Wachinger, C., Reuter, M., van Swieten, J.C., Niessen, W.J., Klein, S., 2015. Standardized evaluation of algorithms for computer-aided diagnosis of dementia based on structural MRI: The CADDementia challenge. NeuroImage 111, 562–579. doi:10.1016/j.neuroimage.2015.01.048.
Cardebat, D., Doyon, B., Puel, M., Goulet, P., Joanette, Y., 1990. Formal and semantic lexical evocation in normal subjects. Performance and dynamics of production as a function of sex, age and educational level. Acta Neurologica Belgica 90, 207–217.
Coley, N., Andrieu, S., 2017. Lessons from the Multidomain Alzheimer Preventive Trial – Authors’ reply. The Lancet Neurology 16, 586. doi:10.1016/S1474-4422(17)30226-0.
Colliot, O., Chételat, G., Chupin, M., Desgranges, B., Magnin, B., Benali, H., Dubois, B., Garnero, L., Eustache, F., Lehéricy, S., 2008. Discrimination between alzheimer disease, mild cognitive impairment, and normal aging by using automated segmentation of the hippocampus. Radiology 248, 194–201. Cullen, B., O’Neill, B., Evans, J.J., Coen, R.F., Lawlor, B.A., 2007. A review of screening tests for cognitive
impairment. Journal of Neurology, Neurosurgery & Psychiatry 78, 790–799. doi:10.1136/jnnp.2006. 095414.
Dacks, P.A., Shineman, D.W., Fillit, H.M., 2013. Current evidence for the clinical use of long-chain polyun-saturated N-3 fatty acids to prevent age-related cognitive decline and Alzheimer’s disease. The journal of nutrition, health & aging 17, 240–251. doi:10.1007/s12603-012-0431-3.
Devanand, D.P., Pradhaban, G., Liu, X., Khandji, A., De Santi, S., Segal, S., Rusinek, H., Pelton, G.H., Honig, L.S., Mayeux, R., Stern, Y., Tabert, M.H., de Leon, M.J., 2007. Hippocampal and entorhinal atrophy in mild cognitive impairment: Prediction of Alzheimer disease. Neurology 68, 828–836. doi:10. 1212/01.wnl.0000256697.20968.d7.
Folstein, M.F., Folstein, S.E., McHugh, P.R., 1975. "Mini-mental state". A practical method for grading the cognitive state of patients for the clinician. Journal of Psychiatric Research 12, 189–198.
Galasko, D., Bennett, D.A., Sano, M., Marson, D., Kaye, J., Edland, S.D., Alzheimer’s Disease Cooperative Study, 2006. ADCS Prevention Instrument Project: assessment of instrumental activities of daily living for community-dwelling elderly individuals in dementia prevention clinical trials. Alzheimer Disease and Associated Disorders 20, S152–169. doi:10.1097/01.wad.0000213873.25053.2b.
Grober, E., Buschke, H., Crystal, H., Bang, S., Dresner, R., 1988. Screening for dementia by memory testing. Neurology 38, 900–903. doi:10.1212/wnl.38.6.900.
Guralnik, J.M., Ferrucci, L., Pieper, C.F., Leveille, S.G., Markides, K.S., Ostir, G.V., Studenski, S., Berkman, L.F., Wallace, R.B., 2000. Lower extremity function and subsequent disability: consistency across studies, predictive models, and value of gait speed alone compared with the short physical performance battery. The Journals of Gerontology. Series A, Biological Sciences and Medical Sciences 55, M221–231. doi:10. 1093/gerona/55.4.m221.
Hadj-Hamou, M., Lorenzi, M., Ayache, N., Pennec, X., 2016. Longitudinal analysis of image time series with diffeomorphic deformations: a computational framework based on stationary velocity fields. Frontiers in neuroscience 10.
Hutton, C., Draganski, B., Ashburner, J., Weiskopf, N., 2009. A comparison between voxel-based corti-cal thickness and voxel-based morphometry in normal aging. NeuroImage 48, 371–380. doi:10.1016/j. neuroimage.2009.06.043.
Isaacson, R.S., Ganzer, C.A., Hristov, H., Hackett, K., Caesar, E., Cohen, R., Kachko, R., Meléndez-Cabrero, J., Rahman, A., Scheyer, O., Hwang, M.J., Berkowitz, C., Hendrix, S., Mureb, M., Schelke, M.W., Mosconi, L., Seifan, A., Krikorian, R., 2018. The clinical practice of risk reduction for Alzheimer’s disease: A precision medicine approach. Alzheimer’s & Dementia 14, 1663–1673. doi:10.1016/j.jalz.2018.08.004.
Jack, C.R., Therneau, T.M., Wiste, H.J., Weigand, S.D., Knopman, D.S., Lowe, V.J., Mielke, M.M., Vemuri, P., Roberts, R.O., Machulda, M.M., Senjem, M.L., Gunter, J.L., Rocca, W.A., Petersen, R.C., 2016. Transition rates between amyloid and neurodegeneration biomarker states and to dementia: a population-based, longitudinal cohort study. The Lancet Neurology 15, 56–64. doi:10.1016/S1474-4422(15)00323-3.
Kivipelto, M., Mangialasche, F., Ngandu, T., 2018. Lifestyle interventions to prevent cognitive im-pairment, dementia and Alzheimer disease. Nature Reviews Neurology 14, 653–666. doi:10.1038/ s41582-018-0070-3.
Lieberman, J.A., 2005. Antipsychotic Drug Effects on Brain Morphology in First-Episode Psychosis. Archives of General Psychiatry 62, 361. doi:10.1001/archpsyc.62.4.361.
Liu, T., Wen, W., Zhu, W., Trollor, J., Reppermund, S., Crawford, J., Jin, J.S., Luo, S., Brodaty, H., Sachdev, P., 2010. The effects of age and sex on cortical sulci in the elderly. NeuroImage 51, 19–27. doi:10.1016/j.neuroimage.2010.02.016.
Lorenzi, M., Ayache, N., Frisoni, G.B., Pennec, X., 2013. LCC-Demons: a robust and accurate symmetric diffeomorphic registration algorithm. NeuroImage 81, 470–483.
Lorenzi, M., Filippone, M., Frisoni, G.B., Alexander, D.C., Ourselin, S., Initiative, A.D.N., et al., 2017. Probabilistic disease progression modeling to characterize diagnostic uncertainty: application to staging and prediction in alzheimer’s disease. NeuroImage .
Lorenzi, M., Pennec, X., 2014. Efficient Parallel Transport of Deformations in Time Series of Images: From Schild’s to Pole Ladder. Journal of Mathematical Imaging and Vision 50, 5–17. doi:10.1007/ s10851-013-0470-3.
Lütcke, H., Frahm, J., 2008. Lateralized Anterior Cingulate Function during Error Processing and Conflict Monitoring as Revealed by High-Resolution fMRI. Cerebral Cortex 18, 508–515. doi:10.1093/cercor/ bhm090.
McDonald, C.R., McEvoy, L.K., Gharapetian, L., Fennema-Notestine, C., Hagler, D.J., Holland, D., Koyama, A., Brewer, J.B., Dale, A.M., For the Alzheimer’s Disease Neuroimaging Initiative, 2009. Regional rates of neocortical atrophy from normal aging to early Alzheimer disease. Neurology 73, 457–465. doi:10.1212/ WNL.0b013e3181b16431.
McNair, D., Kahn, R., 1983. Self-assessment of cognitive deficits. Assessment in geriatric psychopharmacology 137, 143.
Ngandu, T., Lehtisalo, J., Solomon, A., Levälahti, E., Ahtiluoto, S., Antikainen, R., Bäckman, L., Hänninen, T., Jula, A., Laatikainen, T., Lindström, J., Mangialasche, F., Paajanen, T., Pajala, S., Peltonen, M., Rauramaa, R., Stigsdotter-Neely, A., Strandberg, T., Tuomilehto, J., Soininen, H., Kivipelto, M., 2015. A 2 year multidomain intervention of diet, exercise, cognitive training, and vascular risk monitoring versus control to prevent cognitive decline in at-risk elderly people (FINGER): a randomised controlled trial. The Lancet 385, 2255–2263. doi:10.1016/S0140-6736(15)60461-5.
Nichols, T.E., Holmes, A.P., 2002. Nonparametric permutation tests for functional neuroimaging: A primer with examples. Human Brain Mapping 15, 1–25. doi:10.1002/hbm.1058.
van Oijen, M., Jan de Jong, F., Hofman, A., Koudstaal, P.J., Breteler, M., 2007. Subjective memory complaints, education, and risk of alzheimer’s disease. Alzheimer’s & Dementia 3, 92 – 97. doi:https: //doi.org/10.1016/j.jalz.2007.01.011.
Qiu, A., Younes, L., Wang, L., Ratnanather, J.T., Gillepsie, S.K., Kaplan, G., Csernansky, J., Miller, M.I., 2007. Combining anatomical manifold information via diffeomorphic metric mappings for studying cortical thinning of the cingulate gyrus in schizophrenia. NeuroImage 37, 821–833. doi:10.1016/j.neuroimage. 2007.05.007.
Reitan, R.M., 1958. Validity of the Trail Making Test as an Indicator of Organic Brain Damage. Perceptual and Motor Skills 8, 271–276. doi:10.2466/pms.1958.8.3.271.
Reuter, M., Schmansky, N.J., Rosas, H.D., Fischl, B., 2012. Within-subject template estimation for unbiased longitudinal image analysis. NeuroImage 61, 1402–1418. doi:10.1016/j.neuroimage.2012.02.084. Risacher, S.L., Shen, L., West, J.D., Kim, S., McDonald, B.C., Beckett, L.A., Harvey, D.J., Jack, C.R.,
Weiner, M.W., Saykin, A.J., 2010. Longitudinal MRI atrophy biomarkers: Relationship to conversion in the ADNI cohort. Neurobiology of Aging 31, 1401–1418. doi:10.1016/j.neurobiolaging.2010.04.029. Robinson, L., Dickinson, C., Magklara, E., Newton, L., Prato, L., Bamford, C., 2018. Proactive approaches
to identifying dementia and dementia risk; a qualitative study of public attitudes and preferences. BMJ Open 8, e018677. doi:10.1136/bmjopen-2017-018677.
Rogers, L.J., 2002. Advantages and disadvantages of lateralization, in: Rogers, L.J., Andrew, R. (Eds.), Comparative Vertebrate Lateralization. Cambridge University Press, Cambridge, pp. 126–154. doi:10. 1017/CBO9780511546372.006.
Sabuncu, M.R., Desikan, R.S., Sepulcre, J., Yeo, B.T.T., Liu, H., Schmansky, N.J., Reuter, M., Weiner, M.W., Buckner, R.L., Sperling, R.A., Fischl, B., 2011. The Dynamics of Cortical and Hippocampal Atrophy in Alzheimer Disease. ARCH NEUROL 68, 9.
Saykin, A., Wishart, H., Rabin, L., Santulli, R., Flashman, L., West, J., McHugh, T., Mamourian, A., 2006. Older adults with cognitive complaints show brain atrophy similar to that of amnestic mci. Neurology 67, 834–842.
Schmidt-Wilcke, T., Poljansky, S., Hierlmeier, S., Hausner, J., Ibach, B., 2009. Memory performance corre-lates with gray matter density in the ento-/perirhinal cortex and posterior hippocampus in patients with mild cognitive impairment and healthy controls — A voxel based morphometry study. NeuroImage 47, 1914–1920. doi:10.1016/j.neuroimage.2009.04.092.
Shi, F., Liu, B., Zhou, Y., Yu, C., Jiang, T., 2009. Hippocampal volume and asymmetry in mild cognitive impairment and Alzheimer’s disease: Meta-analyses of MRI studies. Hippocampus 19, 1055–1064. doi:10. 1002/hipo.20573.
Sivera, R., Delingette, H., Lorenzi, M., Pennec, X., Ayache, N., 2019. A model of brain morphological changes related to aging and Alzheimer’s disease from cross-sectional assessments. NeuroImage 198, 255– 270. doi:10.1016/j.neuroimage.2019.05.040.
Sluimer, J.D., van der Flier, W.M., Karas, G.B., Fox, N.C., Scheltens, P., Barkhof, F., Vrenken, H., 2008. Whole-brain atrophy rate and cognitive decline: longitudinal mr study of memory clinic patients. Radiology 248, 590–598.
Sowell, E.R., Peterson, B.S., Thompson, P.M., Welcome, S.E., Henkenius, A.L., Toga, A.W., 2003. Mapping cortical change across the human life span. Nature Neuroscience 6, 309–315. doi:10.1038/nn1008. Stephen, R., Liu, Y., Ngandu, T., Antikainen, R., Hulkkonen, J., Koikkalainen, J., Koikkalainen, J., Lötjönen,
J., Levälahti, E., Parkkola, R., Pippola, P., Rinne, J., Strandberg, T., Tuomilehto, J., Vanninen, R., Kivipelto, M., Soininen, H., Solomon, A., for the FINGER, 2019. Brain volumes and cortical thickness on MRI in the Finnish Geriatric Intervention Study to Prevent Cognitive Impairment and Disability (FINGER). Alzheimer’s Research & Therapy 11, 53. doi:10.1186/s13195-019-0506-z.
Taler, V., Phillips, N.A., 2008. Language performance in Alzheimer’s disease and mild cognitive impairment: A comparative review. Journal of Clinical and Experimental Neuropsychology 30, 501–556. doi:10.1080/ 13803390701550128.
Thompson, P.M., Hayashi, K.M., Dutton, R.A., Chiang, M.C., Leow, A.D., Sowell, E.R., De Zubicaray, G., Becker, J.T., Lopez, O.L., Aizenstein, H.J., Toga, A.W., 2007. Tracking Alzheimer’s Disease. Annals of the New York Academy of Sciences 1097, 183–214. doi:10.1196/annals.1379.017.
Tierney, M.C., 2000. Prediction of Probable Alzheimer Disease in Patients With Symptoms Suggestive of Memory Impairment: Value of the Mini-Mental State Examination. Archives of Family Medicine 9, 527–532. doi:10.1001/archfami.9.6.527.
Vellas, B., Carrie, I., Gillette-Guyonnet, S., Touchon, J., Dantoine, T., Cuffi, M.N., Bordes, S., Gasnier, Y., Robert, P., Bories, L., Rouaud, O., Sudres, K., Bonnefoy, M., Pesce, A., Dufouil, C., Lehericy, S., Mangin, J.F., Payoux, P., Adel, D., Legrand, P., Catheline, D., Zaim, M., Molinier, L., Costa, N., Delrieu, J., Voisin, T., Faisant, C., Lala, F., Nourhashémi, F., Rolland, Y., Kan, G.A.V., Dupuy, C., Cestac, P., Belleville, S., Willis, S., Cesari, M., Weiner, M.W., Ousset, P.J., Andrieu, S., 2015. MAPT study: A multidomain approach for preventing alzheimer’s disease: design and baseline data. The journal of prevention of Alzheimer’s disease , 23.
Wechsler, D., 1981. Manual for the Wechsler adult intelligence scale - revised. Psychological Corp.
Whitwell, J.L., Przybelski, S.A., Weigand, S.D., Knopman, D.S., Boeve, B.F., Petersen, R.C., Jack Jr, C.R., 2007. 3d maps from multiple mri illustrate changing atrophy patterns as subjects progress from mild cognitive impairment to alzheimer’s disease. Brain 130, 1777–1786.
Yassine, H.N., Schneider, L.S., 2017. Lessons from the Multidomain Alzheimer Preventive Trial. The Lancet Neurology 16, 585–586. doi:10.1016/S1474-4422(17)30227-2.
Yesavage, J.A., Brink, T.L., Rose, T.L., Lum, O., Huang, V., Adey, M., Leirer, V.O., 1982. Development and validation of a geriatric depression screening scale: a preliminary report. Journal of Psychiatric Research 17, 37–49.