HAL Id: hal-02146857
https://hal-amu.archives-ouvertes.fr/hal-02146857
Submitted on 28 Feb 2020HAL is a multi-disciplinary open access
archive for the deposit and dissemination of sci-entific research documents, whether they are pub-lished or not. The documents may come from teaching and research institutions in France or abroad, or from public or private research centers.
L’archive ouverte pluridisciplinaire HAL, est destinée au dépôt et à la diffusion de documents scientifiques de niveau recherche, publiés ou non, émanant des établissements d’enseignement et de recherche français ou étrangers, des laboratoires publics ou privés.
Distributed under a Creative Commons Attribution - NonCommercial| 4.0 International License
weaknesses among people at metabolic and
cardiovascular risk: Validity testing of the Health
Literacy Questionnaire
Xavier Debussche, Victorine Lenclume, Maryvette Balcou-Debussche, Danielle
Alakian, Claude Sokolowsky, Delphine Ballet, Gerald R. Elsworth, Richard H.
Osborne, Laetitia Huiart
To cite this version:
Xavier Debussche, Victorine Lenclume, Maryvette Balcou-Debussche, Danielle Alakian, Claude Sokolowsky, et al.. Characterisation of health literacy strengths and weaknesses among people at metabolic and cardiovascular risk: Validity testing of the Health Literacy Questionnaire. SAGE OPEN MEDICINE, 2018, 6, pp.1 - 12. �10.1177/2050312118801250�. �hal-02146857�
SAGE Open Medicine
Creative Commons Non Commercial CC BY-NC: This article is distributed under the terms of the Creative Commons
Attribution-NonCommercial 4.0 License (http://www.creativecommons.org/licenses/by-nc/4.0/) which permits non-commercial use, reproduction and distribution of the work without further permission provided the original work is attributed as specified on the SAGE and Open Access pages (https://us.sagepub.com/en-us/nam/open-access-at-sage).
https://doi.org/10.1177/2050312118801250
SAGE Open Medicine Volume 6: 1 –12 © The Author(s) 2018 Article reuse guidelines: sagepub.com/journals-permissions DOI: 10.1177/2050312118801250 journals.sagepub.com/home/smo
Characterisation of health literacy
strengths and weaknesses among
people at metabolic and cardiovascular
risk: Validity testing of the Health
Literacy Questionnaire
Xavier Debussche
1,2, Victorine Lenclume
2, Maryvette Balcou-Debussche
3, Danielle
Alakian
4, Claude Sokolowsky
4, Delphine Ballet
3, Gerald R Elsworth
5,
Richard H Osborne
5,6and Laetitia Huiart
2,7Abstract
Objectives: Health literacy refers to the ability of individuals to gain access to, use, and understand health information and
services in order to maintain a good health. The assessment of health literacy profiles in a population is potentially crucial to respond to health needs. The Health Literacy Questionnaire explores nine dimensions of health literacy and has been shown to display robust psychometric properties. The aim was to test the validity of the multidimensional Health Literacy Questionnaire and to describe the health literacy profiles in a French population at risk of cardiovascular disease.
Methods: Data were collected using self-administered questionnaires from 175 participants attending health education and
support programmes in local associations of patients in Paris. Analysis included scale reliability, confirmatory factor analysis, and health literacy profiles via descriptive statistics.
Results: In confirmatory factor analysis, the nine-factor structure was close to the original Health Literacy Questionnaire.
A nine-factor confirmatory factor analysis model was fitted to the 44 items with no cross-loadings or correlated residuals allowed. Given the restricted nature of the model, the fit was satisfactory: χ2
WLSMV(866 df) = 1383.81, p = 0.0000, comparative fit index = 0.925, Tucker–Lewis index = 0.918, root mean square error of approximation = 0.058, weighted root mean square residual = 1.175. Composite reliability ranged from 0.77 to 0.91. Among the 9 scales of the Health Literacy Questionnaire, the highest scores were found for scale 1 ‘Feeling understood and supported by healthcare professionals’ and scale 9 ‘Understand health information enough to know what to do’ and the lowest for scale 2 ‘Having sufficient information to manage my health’ and scale 7 ‘Navigating the healthcare system’.
Conclusion: The French version of the Health Literacy Questionnaire was shown to be psychometrically robust with good
reliability. In the context of France, the 9 scales of Health Literacy Questionnaire allow a thorough assessment of health literacy strengths and weaknesses to respond to health literacy needs and improve the accessibility of health information and services.
Keywords
Epidemiology/public health, health literacy, France, validity testing, cardiovascular risk
Date received: 7 May 2018; accepted: 26 August 2018
1Service d’Endocrinologie Diabétologie Nutrition, CHU Felix Guyon, Saint-Denis, Réunion, France
2Centre d’Investigations Cliniques 1410 INSERM, Reunion University Hospital, Saint-Pierre, Réunion, France
3EA7389 Institut Coopératif Austral pour la Recherche en Education, University of Reunion, Saint-Denis, France
4Maison du Diabète Obésité risque Cardiovasculaire (M’DOC), Paris, France 5Health Systems Improvement Unit, Centre for Population Health Research, School of Health and Social Development, Deakin University, Geelong, VIC, Australia
Original Article
6Department of Public Health, University of Copenhagen, Copenhagen, Denmark
7Sciences Économiques et Sociales de la Santé et Traitement de l’Information Médicale, Unité Mixte de Recherche 912 INSERM-IRD, Marseille, France
Corresponding author:
Xavier Debussche, Service d’Endocrinologie Diabétologie Nutrition, CHU Felix Guyon, Allée des topazes CS11021, 97400 Saint-Denis, La Réunion, France. Email: xavier.debussche@chu-reunion.fr
Introduction
According to the World Health Organization, health literacy refers to ‘the cognitive and social skills which determine the motivation and ability of individuals to gain access to, under-stand and use information in ways which promote and main-tain good health’.1 Health literacy has been mainly assessed through functional tests of reading ability, understanding, and/or numeracy and has been linked with various health out-comes: poorer health status, increased mortality, increased hospital admissions, poorer medication adherence, risk fac-tors for poor health, and increased healthcare costs.2 Assessing the health literacy of individuals within a community, region or country can provide insight into the problems faced by individuals when trying to access health services and manage disease.3 Early measures of health literacy include the Rapid Estimate of Adult Literacy in Medicine (REALM),4 the Test of Functional Health Literacy in Adults (TOFHLA),5 and the Newest Vital Sign.6 These tools have important limitations: narrow range of health literacy dimensions, and insufficient power to show unbiased differences across groups.7,8 Recent tools have been developed which attempt to embrace the full breadth of dimensions embodied in the concept of health lit-eracy.9 The multidimensional Health Literacy Questionnaire (HLQ) has been developed on the theoretical basis of the World Health Organization (WHO) definition of health liter-acy, and its construction followed a grounded validity-driven approach.10 The conceptual development of constructs and the cognitive testing of items benefitted from extensive patient engagement.11 The HLQ explores health literacy through nine separate conceptually distinct scales whose psy-chometric properties have been showed to be robust in sev-eral languages.11–15
In France, while a few research teams are exploring health literacy in diabetes, cancer, rheumatic diseases, and its rela-tions to health inequities, health and care pathways, and health education and prevention,16–24 to date no health liter-acy instrument has been developed or adapted in France with comparable properties as for the HLQ, to allow assessment in communities and across specific populations with the aim of adaptation of services and structures to the health needs of people struggling with disease management or prevention. The present work reports the French translation of the HLQ, the testing of its psychometric properties, and its usefulness in a population of individuals at risk for cardiovascular dis-eases attending counselling support and education in three community settings in France.
Methods
Health Literacy Questionnaire
The HLQ is composed of 44 items measuring 9 scales com-prising 4–6 items each (Table 1). Scales 1–5 are scored on a 4-point Likert-type response scale (strongly disagree, disa-gree, adisa-gree, strongly agree) and scales 6–9 are scored on a 5-point Likert-type scale which was improved recently by the
authors of the original questionnaire with response options focusing on difficulty (cannot do or always difficult, usually difficult, sometimes difficult, usually easy, always easy).15
French language and cultural adaptation
The French translation of the HLQ followed a thorough pro-cedure provided by the authors of the questionnaire.25 Based on a detailed item intent document, the HLQ was first trans-lated into French by (a) a professional interpreter (French– English bilingual and native French speaking) and (b) two French–English bilingual speakers (native French speakers) with broad experience in French local contexts in both rural and urban settings. Differences in the three forward transla-tions were discussed by the French research team (X.D., M.B.D, D.B.) and a recommended draft French version was prepared and then blindly back translated by a bilingual English native translator. An HLQ author (R.H.O.) reviewed the final version. Nuances in French translation and the orig-inal English intent of each item were then discussed in detail in three consensus conferences with X.D., M.B.D., R.H.O., the translators, three representatives of civil society or local association of patients and one allied health professional with an interest in local cultures. Cultural relevance and measurement equivalence of items were discussed. With this team, and with reference to the detailed written intent of every item, the team was able to assess every nuance of the forward (French) translation from diverse lay and profes-sional perspectives in order to achieve the best possible ver-sion for the French setting. Following the exhaustive translation and consensus phases, the final forward transla-tion was applied in the field. No further improvements to the items were deemed necessary.
Setting and participants
Participants were recruited from February to October 2016 among voluntary individuals attending to the counselling and education services of three local associations of patients in Paris and suburbs (‘Maisons DOC: Diabète Obésité Cardiovasculaire’). These associations are dedicated to the health support and health education for persons with diabetes, obesity, or high cardiovascular risk. Participants gave their informed consent and fulfilled anonymously the question-naire before attending to the education session or counselling encounter: self-administered paper questionnaire, with help for 10 participants (from health professional, n = 8; family, n = 1; other user of Maisons DOC, n = 1). In addition to the HLQ, other variables collected included sociodemographics (age, gender, living alone or not, employment status, educa-tional attainment), and health conditions (diabetes, obesity, cardiovascular disease, and other associated chronic condi-tions: arthritis, cancer, other). Oral informed consent was obtained from all participants included in the study. In accord-ance with French regulation, a written consent was not required as the study was observational and strictly
anonymised. Data collection procedures complied with the French regulatory rules and were declared to the national French CNIL (Commission Nationale Informatique et Libertés, n°1594321v0).
Sample size
A target number of 200 participants were first determined considering the feasibility of recruitment in the Maisons DOC over 6 months. A minimum sample size of 150 was however considered acceptable, as this study was a validation
of a careful translation of an already well-researched ques-tionnaire where all items were expected to load well on their target factors (and thus the communalities of all items would be anticipated to be high) and all target factors were antici-pated to be quite strongly determined by between four and six variables.26
Data analysis
Analyses were conducted with SAS version 9.4, Mplus version 7.4 and STATA version 13.1. Characteristics of participants
Table 1. Health Literacy Questionnaire (HLQ) scales with high and low descriptors.11
Scales Low level of the construct High level of the construct 1 Feeling understood and supported by healthcare providers (4 items)
People who are low on this domain are unable to engage with doctors and other healthcare providers. They do not have a regular healthcare provider and/or have difficulty trusting healthcare providers as a source of information and/or advice
Have an established relationship with at least one healthcare provider who knows them well and who they trust to provide useful advice and information and to assist them to understand information and make decisions about their health 2 Having sufficient information to manage my health (4 items)
Feel that there are many gaps in their knowledge, and that they do not have the information they need to live with and manage their health concerns
Feel confident that they have all the information that they need to live with and manage their condition and to make decisions
3 Actively managing my health (5 items)
People with low levels do not see their health as their responsibility, they are not engaged in their healthcare and regard healthcare as something that is done to them
Recognise the importance and are able to take responsibility for their own health. They proactively engage in their own care and make their own decisions about their health. They make health a priority
4 Social support for health (5 items)
Completely alone and unsupported for health A person’s social system provides them with all the support they want or need for health
5 Appraisal of health information (5 items)
No matter how hard they try, they cannot understand most health information and get confused when there is conflicting information
Able to identify good information and reliable sources of information. They can resolve conflicting information by themselves or with help from others
6 Ability to actively engage with healthcare providers (5 items) Are passive in their approach to healthcare, inactive, that is, they do not proactively seek or clarify information and advice and/or service options. They accept information without question. Unable to ask questions to get information or to clarify what they do not understand. They accept what is offered without seeking to ensure that it meets their needs. Feel unable to share concerns. The do not have a sense of agency in interactions with providers
Are proactive about their health and feel in control in relationships with healthcare providers. Are able to seek advice from additional healthcare providers when necessary. They keep going until they get what they want. Empowered
7 Navigating the healthcare system (6 items)
Unable to advocate on their own behalf and unable to find someone who can help them use the healthcare system to address their health needs. Do not look beyond obvious resources and have a limited understanding of what is available and what they are entitled to
Able to find out about services and supports so they get all their needs met. Able to advocate on their own behalf at the system and service level
8 Ability to find good health information (5 items)
Cannot access health information when required. Are
dependent on others to offer information Are ‘information explorer’. Actively use a diverse range of sources to find information and are up to date 9 Understanding health information well enough to know what to do (5 items)
Have problems understanding any written health information or instructions about treatments or medications. Unable to read or write well enough to complete medical forms
Are able to understand all written information (including numerical information) in relation to their health and able to write appropriately on forms where required
were summarised by median (interquartile range) or percent-ages. Missing values and difficulty level by scale were deter-mined by descriptive statistics produced for each item. For scales 1–5 (part 1 of the questionnaire), the difficulty level was calculated as the fraction of disagree/strongly disagree responses as against agree/strongly agree responses. For scales 6–9 (part 2 of the questionnaire), the difficulty level was calcu-lated as the fraction responding cannot do or always difficult/ usually difficult/ sometimes difficult as against usually easy/ always easy.
For scale reliability, Cronbach’s coefficient α was calcu-lated, but completed by unbiased estimates of composite reliability.27 Since the HLQ scales were stated a priori, con-firmatory factor analysis (CFA) was used to test factor struc-ture. A one-factor CFA model was fitted to the data for each scale.11 The response options were scored as ordinal varia-bles. Mplus provided the weighted least squares mean and variance adjusted (WLSMV) estimator, the unstandardised and standardised factor loadings as estimate to the variance in the measured variable explained by the latent variable (R2), and the associated standard errors, together with fit sta-tistics (χ2, CFI – comparative fit index; TLI – Tucker–Lewis index; RMSEA – root mean square error of approximation; WRMR – weighted root mean square residual). Threshold values for the tests of ‘close fit’ used were CFI > 0.95; TLI > 0.95; RMSEA < 0.06; WRMR < 1.0. RMSEA < 0.08 was taken to indicate a ‘reasonable’ fit. A full nine-factor CFA model with no correlated residuals or cross-loadings was fitted to the data to investigate discriminant validity.
Means differences on the HLQ scores across a range of sociodemographic variables were determined using one-way analysis of variance (ANOVA). Effect size (ES) with 95% confidence interval (CI) for standardised differences in means between sociodemographic characteristics were detected using Cohen’s d. ES was considered ‘small’ when >0.20–0.50, ‘medium’ when 0.50–0.80, and ‘large’ >0.80. α risk was set to 1.67% using the Bonferroni correction (5%/3) for multiple comparison.
Results
Sociodemographic characteristics of the sample
A total of 198 participants were recruited, 6 declined, 17 could not complete the questionnaire (French language diffi-culties, n = 15; had no time to fill the questionnaire, n = 2). Finally, a total of 175 questionnaires were collected. Responses to the HLQ items were high: there was only one missing data point (item 9.1). Table 2 depicts the sociodemo-graphic and health features of the participants. The median age was 66 years (extremes 18–87). In this sample, there were more women (76.6%) than men. This sample had a high level of education with 61.1% who had a university level. More than half of the people lived alone (50.3%) and were retired (56.6%). Metabolic, musculoskeletal, and cardiovascular
diseases, depression or anxiety, cancer and asthma were the most frequent reported disorders.
Difficulty level
Difficulty level of items for each of the 9 scales of the trans-lated HLQ is shown in Table 3. For scales 1–5 with 4-point response options (strongly disagree to strongly agree), scale 1 ‘Feeling understood and supported by healthcare provid-ers’ showed the lowest difficulty level (average item diffi-culty 0.14), and scale 2 ‘Having sufficient information to manage my health’ showed the highest difficulty level (aver-age item difficulty 0.39).
For scales 6–9 with 5-point response options (cannot do or always difficult to always easy), scale 9 ‘Understanding health information well enough to know what to do’ showed the lowest difficulty level (average item difficulty 0.41), and scale 7 ‘Navigating the healthcare system’ the highest level of difficulty (average item difficulty 0.62). In Part 1, the easi-est item was on scale 3, ‘Actively managing my health’ (item 3.4 ‘I set my own goals about health and fitness’ (0.12)), and the hardest item on scale 2, ‘Having sufficient information to manage my health’ (item 2.3 ‘I am sure I have all the infor-mation I need to manage my health effectively’ (0.51)). In
Table 2. Characteristics of participants.
Characteristics Responders n (%) Age, years median (IQR) 169 66 (59–70)a
Sex 175
Female 134 (76.6)
Education level 175
Primary school (or less) 13 (7.4)
Middle school 18 (10.3) Secondary school 37 (21.1) University 107 (61.1) Cohabitation status 175 Living alone 88 (50.3) Employment status 175 Part/full-time 50 (28.6) Retired 99 (56.6) Unemployed 22 (12.6) Other 4 (2.3)
Self-reported chronic diseaseb
Diabetes 174 100 (57.4)
Cardiovascular disease
(stroke, heart problems) 174 23 (13.2)
Cancer 174 12 (6.9)
Musculoskeletal
(arthritis, back pain) 174 80 (46.0)
Asthma 174 11 (6.3)
Depression or anxiety 174 45 (25.9)
Obesity 174 91 (52.3)
IQR: interquartile range. aMedian (IQR). bMore than one possible.
Part 2, the easiest item was on scale 9, ‘Understand health information well enough to know what to do’ (item 9.5 ‘Understand what healthcare providers are asking you to do’ (0.32)) and the hardest item in scale 7, ‘Navigating the healthcare system’ (item 7.1 ‘Find the right healthcare’ (0.69)).
Psychometrics properties
The psychometric properties of the HLQ are described in Table 4. The composite reliability was ⩾0.8 for all scales except for scale 9: ‘Understand health information well enough to know what to do’ (0.77). The scales with the high-est composite reliability were scale 1: ‘Feeling understood and supported by healthcare providers’ (0.91), and scale 4: ‘Social support for health’ (0.90). Cronbach’s alpha ranged from 0.70 for scale 9 to 0.86 for scale 6.
The model fit for all scales was generally good except for scales 9. ‘Understand health information well enough to know what to do’. For this scale, CFI and TLI were low (<0.95), and RMSEA was high (>0.08). For each scale, fac-tor loadings were satisfacfac-tory to high, with 40 out of the 44 items showing factor loadings of ⩾0.60 (ranging from 0.60 to 0.99). Four items were low: item 2.1. ‘I feel I have good information about health’ (0.55), item 3.4. ‘I set my own goals about health and fitness’ (0.57), item 5.4. ‘I know how to find out if the health information I receive is right for me or not’ (0.48), and item 9.2. ‘Accurately follow the instruc-tions from healthcare providers’ (0.41).
A nine-factor CFA model was fitted to the 44 items with no cross-loadings or correlated residuals allowed. Given the very restricted nature of the model, the fit was quite satisfac-tory: χ2
WLSMV(866 df) = 1383.81, p = 0.0000, CFI = 0.925, TLI = 0.918, RMSEA = 0.058, and WRMR = 1.175. While the CFI and TLI are lower than the pre-specified cut-off and the WRMR is higher, this is not surprising given the large numbers of parameters in the model set precisely to 0.0. The ranges of the factor loadings in this model were as follows: scale 1. ‘Feeling understood and supported by healthcare providers’: 0.74–0.99; scale 2. ‘Having sufficient informa-tion to manage my health’: 0.55–0.88; scale 3. ‘Actively managing my health’: 0.57–0.83; scale 4. ‘Social support for health’: 0.60–0.91; scale 5. ‘Appraisal of health informa-tion’: 0.48–0.76; scale 6. ‘Ability to actively engage with healthcare providers’: 0.69–0.85; scale 7. ‘Navigating the healthcare system’: 0.66–0.82; scale 8. ‘Ability to find good health information’: 0.69–0.83; scale 9. ‘Understand health information to know what to do’: 0.41–0.77.
Table 5 shows the inter-factor correlations. There was a clear discrimination between the scales in Part 1 with disa-gree/agree response options (range of 0.33–0.67), and a clear discrimination between the scales in Part 1 and the scales in Part 2 with cannot do/very easy response options (range of 0.35–0.70). However, discrimination was less marked between the scales in Part 2 (range of 0.69–0.86). Inter-factor
correlations were >0.80 for scales 6 and 7 (0.81), 6 and 9 (0.83), 7 and 9 (0.83), 8 and 9 (0.86).
Health literacy profiles of the sample
Distribution of the mean scores for the 9 scales of the HLQ is shown in Table 6. For the first five scales, the highest score was found for scale 1 ‘Feeling understood and supported by healthcare professionals’, and the lowest for scales 2 ‘Having sufficient information to manage my health’ and 4 ‘Social support for health’. For the remaining scales (6–9), the high-est score was seen for scale 9 ‘Understand health informa-tion enough to know what to do’ and the lowest score for scale 7 ‘Navigating the healthcare system’.
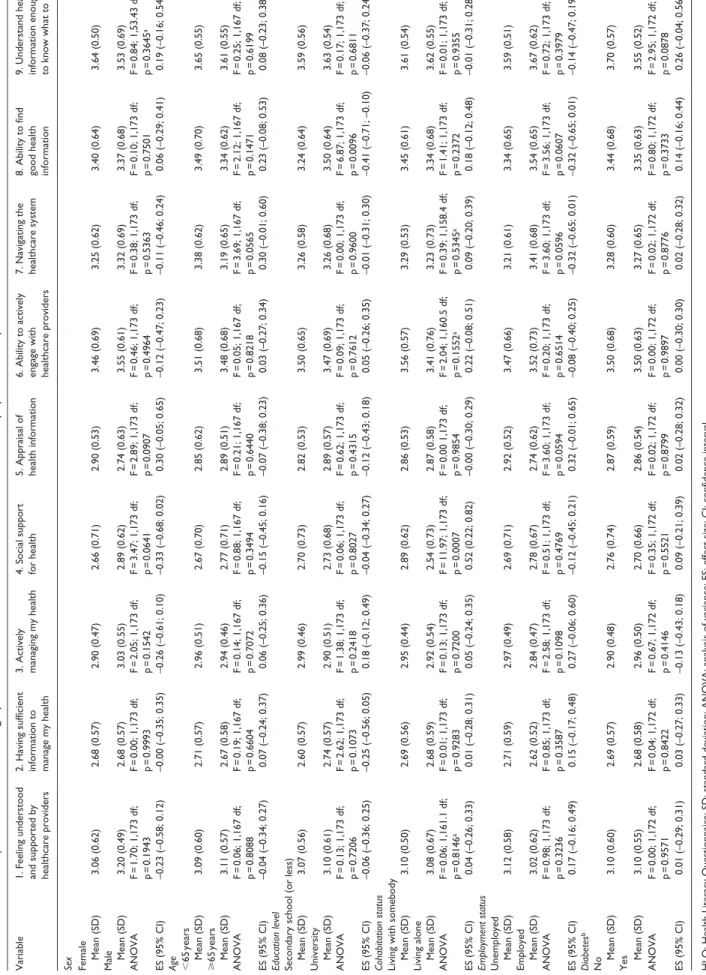
Some patterns were found according to sociodemographic status of participants (Table 7). People with higher education (University vs Secondary school or less) were higher for scale 8 ‘Ability to find good health information’ (ES 0.41 (0.10–0.71); p = 0.01). People living alone had lower scores than those who were living with somebody for scale 4 ‘Social support for health’ (ES 0.52 (0.22; 0.82); p = 0.001). Weaker ES was found for age (<65 vs ⩾65 years) in scale 7 ‘Navigating the healthcare system’ (ES 0.30 (–0.01; 0.60); p = 0.056), and for employment status (Unemployed vs Employed) in scale 5 ‘Appraisal of health information’ (ES 0.32 (–0.01; 0.65); p = 0.059) and scale 7 ‘Navigating the healthcare system’ (ES −0.32 (–0.65; 0.01) p = 0.06). Employed people tended to have lower scores for 5 ‘Appraisal of health information’, but higher scores for 7 ‘Navigating the healthcare system’.
Discussion
The French version of the HLQ was translated and adapted from the English-language HLQ following a highly rigorous process. Filling of the self-administered questionnaires by participants was found to be easy, taking 10–15 min, and with a very few refusals. The HLQ has strong psychometric properties in this population sample from Paris and sur-rounding suburbs among people with elevated cardiovascu-lar risk. In a highly restrictive model, CFA showed a nine-factor structure close to the original English language HLQ providing robust evidence of construct validity. All scales also demonstrated satisfactory reliability, with com-posite reliability >0.80, except for scale 9 (0.77). The HLQ had satisfactory psychometric properties, allowing the fine grained measurement of nine distinct domains of health lit-eracy.11 Other translated versions of the HLQ have been pub-lished with psychometric data analysis. The Danish, German, and Slovak versions of the HLQ demonstrated comparable strong properties.13–15
To our knowledge the present study is the first in France exploring health literacy using an instrument based on a mod-ern conceptualisation of health literacy and including the con-cepts of access, use, understanding and appraisal, not only of
Table 3. Difficulty level of the translated Health Literacy Questionnaire (HLQ) in a French population at risk for metabolic or
cardiovascular disease.
Subscale/item N (n = 175) Difficulty levela (%) (95% CI)
Part 1 – Scales 1–5: How strongly you disagree or agree with the following statements (strongly disagree/disagree/agree/strongly agree) 1. Feeling understood and supported by healthcare providers
I have at least one healthcare provider who … 175 12.6 (8.1–18.4)
I have at least one healthcare provider I can … 175 12.6 (8.1–18.4)
I have the healthcare providers I need … 175 19.4 (13.9–26.1)
I can rely on at least one … 175 13.1 (8.5–19.1)
2. Having sufficient information to manage my health
I feel I have good information about health … 175 22.9 (16.9–29.8)
I have enough information to help me deal … 175 37.7 (30.5–45.3)
I am sure I have all the information I … 175 50.9 (43.2–58.5)
I have all the information I need to … 175 44.0 (36.5–51.7)
3. Actively managing my health
I spend quite a lot of time actively managing … 175 29.1 (22.5–36.5)
I make plans for what I need to do to be … 175 14.3 (9.5–20.4)
Despite other things in my life, I make time … 175 24.0 (17.9–31.2)
I set my own goals about health and fitness 175 12.0 (7.6–17.8)
There are things that I do regularly … 175 27.4 (21.0–34.7)
4. Social support for health
I can get access to several people who … 175 25.7 (19.4–32.9)
When I feel ill, the people around me really … 175 45.1 (37.6–52.8)
If I need help, I have plenty of people I … 175 29.1 (22.5–36.5)
I have at least one person … 175 41.1 (33.8–48.8)
I have strong support from … 175 33.7 (26.8–41.2)
5. Appraisal of health information
I compare health information from different … 175 21.7 (15.9–28.6)
When I see new information about health, I … 175 25.7 (19.4–32.9)
I always compare health information … 175 28.6 (22.0–35.9)
I know how to find out if the health … 175 32.0 (25.2–39.5)
I ask healthcare providers about the quality … 175 21.7 (15.9–28.6)
Subscale/item Responders
(n = 175) Difficulty level
b (%) (95% CI)
Part 2 – Scales 6–9: How easy or difficult the following tasks are for you to do now (cannot do or always difficult/usually difficult/ sometimes difficult/usually easy/always easy)
6. Ability to actively engage with healthcare providers
Make sure that healthcare providers understand … 175 60.6 (52.9–67.9) Feel able to discuss your health concerns with a … 175 41.1 (33.8–48.8)
Have good discussions about your health … 175 44.6 (37.1–52.3)
Discuss things with healthcare providers … 175 52.6 (44.9–60.2)
Ask healthcare providers questions to get … 175 47.4 (39.8–55.1)
7. Navigating the healthcare system
Find the right healthcare 175 69.1 (61.7–75.9)
Get to see the healthcare providers you need to 175 57.7 (50.0–65.1)
Decide which healthcare provider you need … 175 52.6 (44.9–60.2)
Make sure you find the right place to get … 175 62.9 (55.2–70.0)
Find out what healthcare services you are … 175 60.6 (52.9–67.9)
Work out what is the best care for you 175 66.9 (59.4–73.8)
8. Ability to find good health information
Find information about health problems 175 53.7 (46.0–61.3)
Find health information from several … 175 50.3 (42.6–57.9)
Get information about health so you are … 175 46.9 (39.3–54.5)
Get health information in words you … 175 53.1 (45.5–60.7)
Subscale/item Responders
(n = 175) Difficulty level
b (%) (95% CI)
9. Understand health information well enough to know what to do
Confidently fill medical forms in the correct … 174 39.7 (32.3–47.3)
Accurately follow the instructions from … 175 50.3 (42.6–57.9)
Read and understand written health … 175 48.0 (40.4–55.7)
Read and understand all the information on … 175 37.1 (30.0–44.8)
Understand what healthcare providers are … 175 32.0 (25.2–39.5)
CI: confidence interval.
aDifficulty level was calculated as the proportion responding disagree and strongly disagree as against agree or strongly agree.
bDifficulty level was calculated as the proportion responding cannot do, very difficult or quite difficult as against quite easy and very easy.
Table 3. (continued)
Table 4. Psychometric properties of the HLQ, French version, in a population sample at risk for cardiovascular disease, n = 175.
Factor loading (95% CI) R2 Cronbach’s α Composite reliability
Part 1 - Scales 1–5: How strongly you disagree or agree with the following statements (strongly disagree/disagree/agree/strongly agree)
1. Feeling understood and supported by healthcare providers 0.85 0.91
I have at least one healthcare provider who … 0.74 (0.67–0.82) 0.55 I have at least one healthcare provider I can … 0.90 (0.86–0.94) 0.80 I have the healthcare providers I need … 0.74 (0.68–0.80) 0.54 I can rely on at least one healthcare provider 0.99 (0.96–1.00) 0.99 Model fit – χ2
WLSMV(2) = 8.935, p = 0.0115, CFI = 0.995, TLI = 0.986, RMSEA = 0.141, WRMR = 0.464
2. Having sufficient information to manage my health 0.78 0.84
I feel I have good information about health … 0.55 (0.46–0.63) 0.30 I have enough information to help me deal … 0.88 (0.83–0.94) 0.78 I am sure I have all the information I … 0.76 (0.70–0.82) 0.58 I have all the information I need to … 0.82 (0.76–0.87) 0.67 Model fit – χ2
WLSMV(2) = 4.734, p = 0.0938, CFI = 0.996, TLI = 0.988, RMSEA = 0.088, WRMR = 0.319
3. Actively managing my health 0.78 0.85
I spend quite a lot of time actively managing … 0.74 (0.66–0.83) 0.55 I make plans for what I need to do to be … 0.70 (0.61–0.79) 0.49 Despite other things in my life. I make time … 0.83 (0.76–0.89) 0.68 I set my own goals about health and fitness 0.57 (0.49–0.64) 0.32 There are things that I do regularly … 0.81 (0.75–0.87) 0.66 Model fit – χ2
WLSMV(5) = 31.560, p = 0.0000, CFI = 0.962, TLI = 0.924, RMSEA = 0.174, WRMR = 0.842
4. Social support for health 0.85 0.90
I can get access to several people who … 0.78 (0.72–0.83) 0.60 When I feel ill. the people around me really … 0.77 (0.70–0.83) 0.59 If I need help. I have plenty of people I … 0.91 (0.88–0.94) 0.83 I have at least one person … 0.60 (0.52–0.69) 0.36 I have strong support from … 0.89 (0.85–0.93) 0.79 Model fit – χ2
WLSMV(5) = 16.363, p = 0.0059, CFI = 0.991, TLI = 0.982, RMSEA = 0.114, WRMR = 0.472
5. Appraisal of health information 0.75 0.81
I compare health information from different … 0.75 (0.67–0.83) 0.56 When I see new information about health, I … 0.76 (0.69–0.83) 0.57 I always compare health information from … 0.76 (0.68–0.84) 0.58 I know how to find out if the health … 0.48 (0.37–0.58) 0.23 I ask healthcare providers about the quality … 0.65 (0.57–0.74) 0.43 Model fit – χ2
WLSMV(5) = 5.421, p = 0.3667, CFI = 0.999, TLI = 0.998, RMSEA = 0.022, WRMR = 0.349
Part 2 - Scales 6–9: How easy or difficult the following tasks are for you to do now (cannot do or always difficult/usually difficult/ sometimes difficult/usually easy/always easy)
6. Ability to actively engage with healthcare providers 0.86 0.89
Make sure that healthcare providers understand … 0.69 (0.62–0.76) 0.47 Feel able to discuss your health concerns with a … 0.79 (0.73–0.84) 0.62
health information, but also of health services, in order to gather information to inform responses to the needs of indi-viduals, communities, regions or countries. In this sample of people with obesity, diabetes, or cardiovascular risk who were undertaking education sessions, health literacy levels were overall quite low. In particular, three constructs of health literacy appeared at stake: ‘Having sufficient information to manage my health’, ‘Social support for health’, and
Table 5. Inter-factor correlations in the nine-factor model.
Scale Part 1 Part 2
1 2 3 4 5 6 7 8 2 0.668 3 0.525 0.481 4 0.665 0.524 0.333 5 0.463 0.464 0.673 0.337 6 0.697 0.593 0.357 0.641 0.409 7 0.609 0.668 0.380 0.498 0.353 0.814 8 0.372 0.632 0.346 0.363 0.545 0.691 0.784 9 0.475 0.501 0.378 0.408 0.558 0.830 0.831 0.862
Factor loading (95% CI) R2 Cronbach’s α Composite reliability
Have good discussions about your health … 0.79 (0.73–0.85) 0.63 Discuss things with healthcare providers … 0.84 (0.80–0.89) 0.71 Ask healthcare providers questions to get … 0.85 (0.80–0.90) 0.72 Model fit – χ2
WLSMV(5) = 2.207, p = 0.8198, CFI = 1.000, TLI = 1.005, RMSEA = 0.000, WRMR = 0.172
7. Navigating the healthcare system 0.85 0.88
Find the right healthcare 0.66 (0.59–0.73) 0.44
Get to see the healthcare providers you need to 0.70 (0.64–0.76) 0.49 Decide which healthcare provider you need … 0.74 (0.69–0.79) 0.55 Make sure you find the right place to get … 0.82 (0.77–0.86) 0.67 Find out what healthcare services you are entitled to 0.80 (0.74–0.85) 0.64 Work out what is the best care for you 0.77 (0.71–0.82) 0.59 Model fit – χ2
WLSMV(9) = 18.127, p = 0.0337, CFI = 0.992, TLI = 0.986, RMSEA = 0.076, WRMR = 0.462
8. Ability to find good health information 0.83 0.87
Find information about health problems 0.74 (0.68–0.80) 0.55 Find health information from several … 0.78 (0.72–0.84) 0.61 Get information about health so you are … 0.71 (0.64–0.78) 0.51 Get health information in words you … 0.69 (0.62–0.77) 0.48 Get health information by yourself 0.83 (0.76–0.89) 0.68 Model fit – χ2
WLSMV (5) = 5.139, p = 0.3991, CFI = 1.000, TLI = 1.000, RMSEA = 0.013, WRMR = 0.282
9. Understand health information well enough to know what
to do 0.70 0.77
Confidently fill medical forms in the correct … 0.66 (0.57–0.75) 0.44 Accurately follow the instructions from … 0.41 (0.32–0.51) 0.17 Read and understand written health … 0.62 (0.53–0.72) 0.39 Read and understand all the information on … 0.77 (0.70–0.84) 0.60 Understand what healthcare providers … 0.68 (0.60–0.77) 0.47 Model fit – χ2
WLSMV(5) = 25.951, p = 0.0001, CFI = 0.938, TLI = 0.875, RMSEA = 0.155, WRMR = 0.687
HLQ: Health Literacy Questionnaire; CI: confidence interval; CFI: comparative fit index; TLI: Tucker–Lewis index; RMSEA: root mean square error of approximation; WRMR: weighted root mean square residual.
Table 4. (continued)
‘Navigating the healthcare system’. On the other hand, higher levels of HL were found for ‘Feeling understood and sup-ported by healthcare professionals’ and ‘Understand health information well enough to know what to do’. Older (>65 years) and unemployed or retired participants displayed higher difficulties in navigating the healthcare system. In the context of France, it could be important to look at the availa-bility and accessiavaila-bility of health information and the diffi-culty of understanding and becoming orientated in the healthcare system, while people appear to be generally confi-dent with their primary care practitioner.28 Our sample repre-sented a quite selected population with diabetes or other cardiovascular risk since self-selected to attend the educa-tional activities of the association, with potential demand on health system and sufficient delivery of information.29 On another hand, the population studied here was characterised by a high proportion of potentially vulnerable women, retired or unemployed, living alone albeit with a relatively high level of education. Social support also appears to be too a crucial component of HL. Health inequalities have been shown to coexist with lower health literacy assessed via the HLQ in Australia,30 Slovakia,15 and Denmark.14 In the European Health Literacy Survey (HLS-EU) survey, which only
characterised populations into a limited number of categories of health literacy in eight European countries, health literacy levels varied markedly between countries, but limited health literacy was more frequent in vulnerable subgroups (social or economic deprivation, education or old age).31
Difficulty levels among the 9 scales showed that the hard-est items are in the second part of the quhard-estionnaire (scales 6–9). This distribution is quite different from the original English-language HLQ,11 with difficulty levels in the items of part 2 ranging 8%–42% compared to 32%–69% for the French HLQ. The French results, as regards to part 2, are closer to the one observed in the Danish HLQ (12%–51%).14 This might reflect greater challenges for French people in these domains, as suggested by lower scores compared to the Australian studies.30 However, two other factors may be at play. The first is that the response options are slightly differ-ent to those in the original validation study as the version we used included the concept of frequency to make response options better reflect the real experience of people in the community. Indeed, in an Australian study of the measure-ment properties of the HLQ among older adults after a fall,32 inspection of the category probability curves of the first ver-sion of the HLQ revealed that some participants struggled with understanding what might be the best response option for them between ‘very difficult’ and ‘quite difficult’. A team from Slovakia systematically compared the two versions, from both the difficulty perspective and the psychometrics, and found the new version to be superior as the analyses
demonstrated clear response option choices and reduced ceiling effects across items.15
A second potential confounder of the item and scale dif-ficulty data is cultural variation across European cultures. While the somewhat onerous translation process (9 h of con-sensus discussion) with nuanced guidance of what every item is supposed to mean (and not mean) from the lay respondent’s perspective (i.e. the HLQ item intents), and also with detailed explication of minor idiomatic expressions or jargon in the English version, it is still possible that French people (or any other culture) see issues related to healthcare differently than other European or Australian cultures. France’s general attitude may be quite different from that of other countries in terms of the ease with which someone should be able to navigate the system, the level of support they should have, or the amount of information they should have, and therefore rate these as unsatisfactory across the relevant HLQ items (irrespective of whether they are ade-quate or not). Sociocultural issues can generate bias when comparing countries and diverse populations – akin to the ecological fallacy.33 Health literacy involves to the ability of individuals to implement health-relevant practices, under-stand their meaning, and adapt these practices taking into account the strengths and limitations of environments and contexts in which they are actualised.34 Health literacy of a person or a community is the result of the balance between, on one hand, the individual skills, taking into account the multiple constraints that a person face, including social posi-tioning, gender, culture, and health services, and on another hand the relationships with health professionals, services, and system.34–37 Given these risks of such bias, it is recom-mended that comparing health literacy scores between cul-tures should not be undertaken prior to generation of robust evidence that unbiased estimates can be generated. This has only been done to a limited extent within one diverse setting in Australia.12
This study has some limitations. First, the relatively small sample studied here, with a majority of retired indi-viduals and women with relatively high proportion of social isolation cannot fully reflect the French population. Second, the questionnaire was self-administered by attendees of education sessions or during an encounter with a health edu-cator; therefore, the sample may be biased towards people already productively involved in their own care and preven-tive activities. Future research should consider engaging populations in other settings such as primary care, the gen-eral community and people from diverse migrant or other marginised groups.
In conclusion, the findings from a sample of people at high risk for cardiovascular disease show the potential usefulness for the assessment of HL needs in individuals, settings, and has the potential to provide specific guidance for public health actions in France and French speaking countries. Our study provides a French validated version of the multidimensional Health Literacy Questionnaire. It has a good internal
Table 6. Health Literacy Questionnaire scores for the
overall sample. French population at risk for metabolic and cardiovascular disease (n = 175).
Mean (SD) (95% CI) HLQ scales
Range 1 (lowest) to 4 (highest)
1. Feeling understood and supported by
healthcare professionals 3.09 (0.59) (3.00–3.18) 2. Having sufficient information to
manage my health 2.68 (0.57) (2.60–2.77) 3. Actively managing my health 2.93 (0.49) (2.86–3.01) 4. Social support for health 2.72 (0.70) (2.61–2.82) 5. Appraisal of health information 2.87 (0.56) (2.78–2.95) Range 1 (lowest) to 5 (highest)
6. Ability to actively engage with
healthcare professionals 3.48 (0.67) (3.38–3.58) 7. Navigating the healthcare system 3.26 (0.64) (3.17–3.36) 8. Ability to find good health
information 3.39 (0.65) (3.30–3.49) 9. Understand health information
enough to know what to do 3.61 (0.55) (3.53–3.69)
a
HLQ: Health Literacy Questionnaire; SD: standard deviation; CI: confi-dence interval.
Table 7.
Relationships between sociodemographic variables and HLQ scores. . French version, in a population sample at risk for cardiovas
cular disease, n = 175.
Variable
1. Feeling understood and supported by healthcare providers 2. Having sufficient information to manage my health 3. Actively managing my health 4. Social support for health 5. Appraisal of health information 6. Ability to actively engage with healthcare providers 7. Navigating the healthcare system 8. Ability to find good health information 9. Understand health information enough to know what to do
Sex Female Mean (SD)
3.06 (0.62) 2.68 (0.57) 2.90 (0.47) 2.66 (0.71) 2.90 (0.53) 3.46 (0.69) 3.25 (0.62) 3.40 (0.64) 3.64 (0.50) Male Mean (SD) 3.20 (0.49) 2.68 (0.57) 3.03 (0.55) 2.89 (0.62) 2.74 (0.63) 3.55 (0.61) 3.32 (0.69) 3.37 (0.68) 3.53 (0.69) ANOVA F = 1.70; 1,173 df; p = 0.1943 F = 0.00; 1,173 df; p = 0.9993 F = 2.05; 1,173 df; p = 0.1542 F = 3.47; 1,173 df; p = 0.0641 F = 2.89; 1,173 df; p = 0.0907 F = 0.46; 1,173 df; p = 0.4964 F = 0.38; 1,173 df; p = 0.5363 F = 0.10; 1,173 df; p = 0.7501 F = 0.84; 1,53.43 df; p = 0.3645 a ES (95% CI) –0.23 (–0.58; 0.12) –0.00 (–0.35; 0.35) –0.26 (–0.61; 0.10) –0.33 (–0.68; 0.02) 0.30 (–0.05; 0.65) –0.12 (–0.47; 0.23) –0.11 (–0.46; 0.24) 0.06 (–0.29; 0.41) 0.19 (–0.16; 0.54) Age <65 years Mean (SD) 3.09 (0.60) 2.71 (0.57) 2.96 (0.51) 2.67 (0.70) 2.85 (0.62) 3.51 (0.68) 3.38 (0.62) 3.49 (0.70) 3.65 (0.55) ⩾ 65 years Mean (SD) 3.11 (0.57) 2.67 (0.58) 2.94 (0.46) 2.77 (0.71) 2.89 (0.51) 3.48 (0.68) 3.19 (0.65) 3.34 (0.62) 3.61 (0.55) ANOVA F = 0.06; 1,167 df; p = 0.8088 F = 0.19; 1,167 df; p = 0.6604 F = 0.14; 1,167 df; p = 0.7072 F = 0.88; 1,167 df; p = 0.3494 F = 0.21; 1,167 df; p = 0.6440 F = 0.05; 1,167 df; p = 0.8218 F = 3.69; 1,167 df; p = 0.0565 F = 2.12; 1,167 df; p = 0.1471 F = 0.25; 1,167 df; p = 0.6199 ES (95% CI) –0.04 (–0.34; 0.27) 0.07 (–0.24; 0.37) 0.06 (–0.25; 0.36) –0.15 (–0.45; 0.16) –0.07 (–0.38; 0.23) 0.03 (–0.27; 0.34) 0.30 (–0.01; 0.60) 0.23 (–0.08; 0.53) 0.08 (–0.23; 0.38)
Education level Secondary school (or less) Mean (SD)
3.07 (0.56) 2.60 (0.57) 2.99 (0.46) 2.70 (0.73) 2.82 (0.53) 3.50 (0.65) 3.26 (0.58) 3.24 (0.64) 3.59 (0.56) University Mean (SD) 3.10 (0.61) 2.74 (0.57) 2.90 (0.51) 2.73 (0.68) 2.89 (0.57) 3.47 (0.69) 3.26 (0.68) 3.50 (0.64) 3.63 (0.54) ANOVA F = 0.13; 1,173 df; p = 0.7206 F = 2.62; 1,173 df; p = 0.1073 F = 1.38; 1,173 df; p = 0.2418 F = 0.06; 1,173 df; p = 0.8027 F = 0.62; 1,173 df; p = 0.4315 F = 0.09; 1,173 df; p = 0.7612 F = 0.00; 1,173 df; p = 0.9600 F = 6.87; 1,173 df; p = 0.0096 F = 0.17; 1,173 df; p = 0.6811 ES (95% CI) –0.06 (–0.36; 0.25) –0.25 (–0.56; 0.05) 0.18 (–0.12; 0.49) –0.04 (–0.34; 0.27) –0.12 (–0.43; 0.18) 0.05 (–0.26; 0.35) –0.01 (–0.31; 0.30) –0.41 (–0.71; –0.10) –0.06 (–0.37; 0.24)
Cohabitation status Living with somebody Mean (SD)
3.10 (0.50) 2.69 (0.56) 2.95 (0.44) 2.89 (0.62) 2.86 (0.53) 3.56 (0.57) 3.29 (0.53) 3.45 (0.61) 3.61 (0.54)
Living alone Mean (SD)
3.08 (0.67) 2.68 (0.59) 2.92 (0.54) 2.54 (0.73) 2.87 (0.58) 3.41 (0.76) 3.23 (0.73) 3.34 (0.68) 3.62 (0.55) ANOVA F = 0.06; 1,161.1 df; p = 0.8146 a F = 0.01; 1,173 df; p = 0.9283 F = 0.13; 1,173 df; p = 0.7200 F = 11.97; 1,173 df; p = 0.0007 F = 0.00 1,173 df; p = 0.9854 F = 2.04; 1,160.5 df; p = 0.1552 a F = 0.39; 1,158.4 df; p = 0.5345 a F = 1.41; 1,173 df; p = 0.2372 F = 0.01; 1,173 df; p = 0.9355 ES (95% CI) 0.04 (–0.26; 0.33) 0.01 (–0.28; 0.31) 0.05 (–0.24; 0.35) 0.52 (0.22; 0.82) –0.00 (–0.30; 0.29) 0.22 (–0.08; 0.51) 0.09 (–0.20; 0.39) 0.18 (–0.12; 0.48) –0.01 (–0.31; 0.28)
Employment status Unemployed Mean (SD)
3.12 (0.58) 2.71 (0.59) 2.97 (0.49) 2.69 (0.71) 2.92 (0.52) 3.47 (0.66) 3.21 (0.61) 3.34 (0.65) 3.59 (0.51) Employed Mean (SD) 3.02 (0.62) 2.62 (0.52) 2.84 (0.47) 2.78 (0.67) 2.74 (0.62) 3.52 (0.73) 3.41 (0.68) 3.54 (0.65) 3.67 (0.62) ANOVA F = 0.98; 1,173 df; p = 0.3236 F = 0.85; 1,173 df; p = 0.3587 F = 2.58; 1,173 df; p = 0.1098 F = 0.51; 1,173 df; p = 0.4769 F = 3.60; 1,173 df; p = 0.0594 F = 0.20; 1,173 df; p = 0.6514 F = 3.60; 1,173 df; p = 0.0596 F = 3.56; 1,173 df; p = 0.0607 F = 0.72; 1,173 df; p = 0.3979 ES (95% CI) 0.17 (–0.16; 0.49) 0.15 (–0.17; 0.48) 0.27 (–0.06; 0.60) –0.12 (–0.45; 0.21) 0.32 (–0.01; 0.65) –0.08 (–0.40; 0.25) –0.32 (–0.65; 0.01) –0.32 (–0.65; 0.01) –0.14 (–0.47; 0.19) Diabetes b No Mean (SD) 3.10 (0.60) 2.69 (0.57) 2.90 (0.48) 2.76 (0.74) 2.87 (0.59) 3.50 (0.68) 3.28 (0.60) 3.44 (0.68) 3.70 (0.57) Yes Mean (SD) 3.10 (0.55) 2.68 (0.58) 2.96 (0.50) 2.70 (0.66) 2.86 (0.54) 3.50 (0.63) 3.27 (0.65) 3.35 (0.63) 3.55 (0.52) ANOVA F = 0.00; 1,172 df; p = 0.9571 F = 0.04; 1,172 df; p = 0.8422 F = 0.67; 1,172 df; p = 0.4146 F = 0.35; 1,172 df; p = 0.5521 F = 0.02; 1,172 df; p = 0.8799 F = 0.00; 1,172 df; p = 0.9897 F = 0.02; 1,172 df; p = 0.8776 F = 0.80; 1,172 df; p = 0.3733 F = 2.95; 1,172 df; p = 0.0878 ES (95% CI) 0.01 (–0.29; 0.31) 0.03 (–0.27; 0.33) –0.13 (–0.43; 0.18) 0.09 (–0.21; 0.39) 0.02 (–0.28; 0.32) 0.00 (–0.30; 0.30) 0.02 (–0.28; 0.32) 0.14 (–0.16; 0.44) 0.26 (–0.04; 0.56)
HLQ: Health Literacy Questionnaire; SD: standard deviation; ANOVA: analysis of variance;
ES: effect size; CI: confidence interval.
consistency in all 9 scales and is reliable and psychometrically robust in a highly restrictive nine-factor model.
Acknowledgements
The authors thank Audrey Sauger (interpreter: forward translation, consensus conference), Didier Balcou and Yves Derrien (forward translation, consensus conference), Tibor Katelbach (interpreter, backward translation, consensus conference), Gerardo Bautista and Véronique La Hausse (consensus conference), for their active par-ticipation in the translation and cultural adaptation process. The authors would also thank all the participants and staff of the Maisons DOC, and especially Marie-Laure Le Pommelet and Jacqueline Fillias, for their active involvement in the conduct of the study. Declaration of conflicting interests
The author(s) declared no potential conflicts of interest with respect to the research, authorship, and/or publication of this article. Ethical approval
Ethical approval for this study was obtained from CNIL (Commission Nationale Informatique et Libertés) n°1594321v0. Funding
The author(s) disclosed receipt of the following financial support for the research, authorship, and/or publication of this article: This work was supported by the IRESP (Institut de Recherche en Santé Publique) (AAP 2012-20), and the National Health and Medical Research Council of Australia Senior Research Fellowship (APP1059122). Informed consent
Verbal informed consent was obtained from all subjects before the study. In accordance with French regulation, a written consent was not required as the study was observational and strictly anonymized. ORCID iD
Xavier Debussche https://orcid.org/0000-0003-3087-4297 References
1. Kickbusch I, Pelikan JM, Apfel F, et al. Health literacy: the solid facts. Copenhagen: World Health Organization, 2013, pp. 1–86.
2. Dewalt DA, Berkman ND, Sheridan S, et al. Literacy and health outcomes: a systematic review of the literature. J Gen Intern Med 2004; 19: 1228–1239.
3. Batterham RW, Hawkins M, Collins PA, et al. Health liter-acy: applying current concepts to improve health services and reduce health inequalities. Public Health 2016; 132: 3–12. 4. Davis TC, Crouch MA, Long SW, et al. Rapid assessment of
literacy levels of adult primary care patients. Fam Med 1991; 23: 433–435.
5. Parker RM, Baker DW, Williams MV, et al. The test of func-tional health literacy in adults: a new instrument for measuring patients’ literacy skills. J Gen Intern Med 1995; 10: 537–541. 6. Weiss BD, Mays MZ, Martz W, et al. Quick assessment of
literacy in primary care: the newest vital sign. Ann Fam Med 2005; 3: 514–522.
7. Haun JN, Valerio MA, McCormack LA, et al. Health literacy measurement: an inventory and descriptive summary of 51 instruments. J Health Comm 2014; 19: 302–333.
8. Jordan JE, Osborne RH and Buchbinder R. Critical appraisal of health literacy indices revealed variable underlying con-structs, narrow content and psychometric weaknesses. J Clin Epidemiol 2011; 64: 366–379.
9. Sørensen K, Van den Broucke S, Pelikan JM, et al. Measuring health literacy in populations: illuminating the design and development process of the European Health Literacy Survey Questionnaire (HLS-EU-Q). BMC Public Health 2013; 13: 948–948.
10. Buchbinder R, Batterham R, Elsworth G, et al. A validity-driven approach to the understanding of the personal and soci-etal burden of low back pain: development of a conceptual and measurement model. Arthritis Res Ther 2011; 13: R152. 11. Osborne RH, Batterham RW, Elsworth GR, et al. The
grounded psychometric development and initial validation of the Health Literacy Questionnaire (HLQ). BMC Public Health 2013; 13: 658.
12. Elsworth GR, Beauchamp A and Osborne RH. Measuring health literacy in community agencies: a Bayesian study of the factor structure and measurement invariance of the Health Literacy Questionnaire (HLQ). BMC Health Serv Res 2016; 16: 508.
13. Nolte S, Osborne RH, Dwinger S, et al. German translation, cultural adaptation, and validation of the Health Literacy Questionnaire (HLQ). PLoS ONE 2017; 12: e0172340. 14. Maindal HT, Kayser L, Norgaard O, et al. Cultural adaptation
and validation of the Health Literacy Questionnaire (HLQ): robust nine-dimension Danish language confirmatory factor model. SpringerPlus 2016; 5: 1232.
15. Kolarcik P, Cepova E, Madarasova Geckova A, et al. Structural properties and psychometric improvements of the Health Literacy Questionnaire in a Slovak population. Int J Pub Health 2017; 62: 591–604.
16. Balcou-Debussche M. L’éducation thérapeutique: entre savoirs complexes, formateurs, apprenants hétérogènes et contextes pluriels [Patient education: between complex knowledge, educators, heterogeneous learners and multiple contexts]. Rech Soins Infirm 2012; 110: 45–59.
17. Balcou-Debussche M. Inscription sociale de l’ETP, hétérogé-néité et vulnérabilitédes personnes. Analyse de résultats obte-nus en contexte pluriel, à Mayotte [Social inscription of TPE, heterogeneity and patient’s vulnerability. Analysis of results obtained in the plural context of Mayotte]. Educ Ther Patient/ Ther Patient Educ 2013; 5: 113–121.
18. Balcou-Debussche M. Littératie en santé et interactions lan-gagières en éducation thérapeutique. Analyse de situations d’apprentissage au Mali, à La Réunion et à Mayotte [Health literacy and language interactions in therapeutic patient education. Analysis of learning situations in Mali, Reunion Island and Mayotte Island]. Education Santé Sociétés 2014; 1: 3–18.
19. Guillemin F, Carruthers E and Li LC. Determinants of MSK health and disability – social determinants of inequities in MSK health. Best Pract Res Clin Rheumatol 2014; 28: 411–433. 20. Kivits J. Everyday health and the Internet: a mediated health
perspective on health information seeking. Sociol Health Illn 2009; 31: 673–687.
21. Le Bonniec A, Haesebaert J, Derex L, et al. Why patients delay their first contact with health services after stroke? A qualitative focus group-based study. PLoS ONE 2016; 11: e0156933.
22. Ousseine YM, Rouquette A, Bouhnik AD, et al. Validation of the French version of the functional, communicative, and criti-cal health literacy scriti-cale (FCCHL). J Patient Rep Outcomes 2017; 2: 3.
23. Mancini J, Butow PN, Bouhnik AD, et al. Question prompt list responds to information needs of myelodysplastic syndromes patients and caregivers. Leuk Res 2015; 39: 599–605.
24. Margat A, De Andrade V and Gagnayre R. « Health Literacy » et éducation thérapeutique du patient: Quels rapports con-ceptuel et méthodologique? [“Health literacy” and therapeutic patient education: conceptual and methodological relation-ships]. Educ Therap Patient/Ther Patient Educ 2014; 6: 10105. 25. Hawkins M and Osborne R. Health Literacy Questionnaire
(HLQ) – translation and cultural adaptation procedure. Burwood, VIC, Australia: Deakin University, 2013.
26. MacCallum RC, Widaman KF, Zhang S, et al. Sample size in factor analysis. Psychol Methods 1999; 4: 84–99.
27. Raykov T. Scale construction and development using struc-tural equation modeling. In: Hoyle R (ed.) Handbook of structural equation modeling. New York: The Guilford Press, 2012, pp. 472–492.
28. Fosse-Edorh S, Fagot-Campagna A, Detournay B, et al. Impact of socio-economic position on health and quality of care in adults with Type 2 diabetes in France: the Entred 2007 study. Diabet Med 2015; 32: 1438–1444.
29. Fournier C, Gautier A, Mosnier-Pudar H, et al. ENTRED 2007: results of a French national survey on self-management
education to people with diabetes … still a long way to go! Educ Ther Patient/Ther Patient Educ 2014; 6: 10102. 30. Beauchamp A, Buchbinder R, Dodson S, et al.
Distribu-tion of health literacy strengths and weaknesses across socio-demographic groups: a cross-sectional survey using the Health Literacy Questionnaire (HLQ). BMC Public Health 2015; 15: 678.
31. Sørensen K, Pelikan JM, Röthlin F, et al. Health literacy in Europe: comparative results of the European Health Literacy Survey (HLS-EU). Eur J Pub Health 2015; 25: 1053–1058. 32. Morris R, Soh S, Hill K, et al. Measurement properties of the
Health Literacy Questionnaire (HLQ) among older adults who present to the emergency department after a fall: a Rasch anal-ysis. BMC Health Serv Res 2017; 17: 605.
33. Carvalho G, Clément P, Bogner F, et al. Final report sum-mary: BIOHEAD-CITIZEN (Biology, health and environmen-tal education for better citizenship). Report no. 11890, 2011. Brussels: European Commission.
34. Balcou-Debussche M. De l'éducation thérapeutique du patient à la littératie en santé. Problématisation socio-anthro-pologique d'objets didactiques contextualisés. Paris: Editions des Archives Contemporaines, 2016, 239 pp.
35. Aujoulat I, Luminet O and Deccache A. The perspective of patients on their experience of powerlessness. Qual Health Res 2007; 17: 772–785.
36. Taylor D and Bury M. Chronic illness, expert patients and care transition. Sociol Health Illn 2007; 29: 27–45.
37. Balcou-Debussche M and Debussche X. Hospitalisation for type 2 diabetes: the effects of the suspension of reality on patients’ subsequent management of their condition. Qual Health Res 2009; 19: 1100–1115.