Publisher’s version / Version de l'éditeur:
Vous avez des questions? Nous pouvons vous aider. Pour communiquer directement avec un auteur, consultez la première page de la revue dans laquelle son article a été publié afin de trouver ses coordonnées. Si vous n’arrivez pas à les repérer, communiquez avec nous à [email protected].
Questions? Contact the NRC Publications Archive team at
[email protected]. If you wish to email the authors directly, please see the first page of the publication for their contact information.
https://publications-cnrc.canada.ca/fra/droits
L’accès à ce site Web et l’utilisation de son contenu sont assujettis aux conditions présentées dans le site
LISEZ CES CONDITIONS ATTENTIVEMENT AVANT D’UTILISER CE SITE WEB.
Internal Report (National Research Council of Canada. Institute for Research in
Construction), 2000-10-01
READ THESE TERMS AND CONDITIONS CAREFULLY BEFORE USING THIS WEBSITE. https://nrc-publications.canada.ca/eng/copyright
NRC Publications Archive Record / Notice des Archives des publications du CNRC :
https://nrc-publications.canada.ca/eng/view/object/?id=599f26c4-4a42-492e-83f6-405147499c8b https://publications-cnrc.canada.ca/fra/voir/objet/?id=599f26c4-4a42-492e-83f6-405147499c8b
NRC Publications Archive
Archives des publications du CNRC
For the publisher’s version, please access the DOI link below./ Pour consulter la version de l’éditeur, utilisez le lien DOI ci-dessous.
https://doi.org/10.4224/20386121
Access and use of this website and the material on it are subject to the Terms and Conditions set forth at
Experimental studies on the fire endurance of high-strength concrete
columns
I
S e r
National Research Conseil national
1+1
Council Canada de rechershes Canada no. 819c . 2
1,
I R C1
Institute for lnstitut de Research recherche in Construction en construction
Experimental Studies on the Fire
Endurance of High-Strength Concrete
Colutrins
V.K.R. Kodur, R. McGrath, J.C. Latour and J. MacLaurin
Internal Report 81 9
October
2000
... , . ,..
. .
EXPERIMENTAL STUDIES ON THE FIRE ENDURANCE OF HIGH-STRENGTH CONCRETE COLUMNS
by
V.R.K. Kodur, R. McGrath, J.C. Latour and J. MacLaurin
ABSTRACT
Experimental studies were carried out to determine the fire endurance of high- strength concrete columns. The results of ten full-scale fire endurance tests are described in this report. The variables included column dimensions, concrete strength, type of aggregate in the concrete, tie configuration, eccentricity of loading and load intensity. These studies were conducted as part of a research program aimed at studying the fire endurance of high-strength concrete columns.
EXPERIMENTAL STUDIES ON THE FIRE ENDURANCE OF HIGH-STRENGTH CONCRETE COLUMNS
by
V.R.K. Kodur, R. McGrath, J.C. Latour and J. MacLaurin
ACKNOWLEDGEMENTS
This research is part of a Joint Research Project between the National Research Council of Canada (NRC), the Portland Cement Association (PCA), and the Canadian Portland Cement Association (CPCA). The authors appreciate the technical and financial contributions of PCA and CPCA.
The research reported in this paper (PCA & R&D Serial No. 2222) was conducted by the National Research Council of Canada, with the sponsorship of the Portland Cement Association (PCA Project Index No. 87-04b), Canadian Portland Cement Association and the National Research Council of Canada. The contents of this paper reflect the views of the authors, who are responsible for the facts and accuracy of the data presented. The contents do not necessarily reflect the views of the sponsors.
EXPERIMENTAL STUDIES ON THE FIRE ENDURANCE OF HIGH-STRENGTH CONCRETE COLUMNS
by
V.K.R. Kodur, R. McGrath, J.C. Latour and J. MacLaurin
INTRODUCTION
In recent years, the construction industry has shown significant interest in the use of high-strength concrete (HSC). This is due to the improvements in its structural performance such as high strength and the durability that it can provide, compared to traditional normal strength concrete (NSC). The use of high-strength concrete, which was previously in applications such as bridges, offshore structures and infrastructure projects, is becoming more popular in high-rise buildings. One of the major uses of HSC in buildings is for columns.
In buildings, HSC structural members are designed to satisfy the requirements of serviceability and safety limit states. One of the major safety requirements in building design is the provision of appropriate fire safety measures for structural members
[I].
The basis for this requirement can be attributed to the fact that, when other measures for containing the fire fail, structural integrity is the last line of defence.With the increased use of high-strength concrete, concern has developed regarding the behaviour of such concretes in fire. In particular, the occurrence of spalling at elevated temperatures when HSC is subjected to rapid heating, as in the case of a fire, is one of the reasons for this concern [2]. Further, results of fire tests in a number of laboratories
[3,4,5,6]
have shown that there are well-defined differences between the properties of HSC and NSC at elevated temperatures.Studies are in progress at the National Research Council of Canada (NRC) to develop fire resistance design guidelines for the use of high-strength concrete and for possible incorporation in codes and standards [I ,7]. The main objective of this study, being undertaken in partnership with the Portland Cement Association (PCA) and the Canadian Portland Cement Association (CPCA), is to determine the behaviour of HSC at elevated temperatures and to evaluate its fire endurance. As part of a joint research project, full-scale fire endurance tests on 10 HSC columns were conducted and the full experimental details, together with the test results, are presented in this report.
TEST SPECIMENS
The experimental program consisted of fire endurance tests on 10 reinforced concrete columns. The columns were designated HS1 to HS10. All 10 columns were made of high-strength concrete.
Dimensions
All columns were 3810 mm (12
ft
6 in.) long from end plate to end plate and were of square cross-section. Six of the columns, HS1 to HS6, were of 406 mm (16 in.) cross-sections while the remaining four. HS7 to HS10. were of 305 mm (12 in.) cross- sections. The cross-sectional dimensions of each column are listed in Table 1Materials
Cement
ASTM CISO, Type I portland cement, a general purpose cement for construction of reinforced concrete structures, was used for constructing Columns HS1 to HS6. The remaining 4 columns, HS7 to HS10, were made with CSAAS Type 10 portland cement.
Two types of coarse aggregates, namely siliceous aggregate and carbonate aggregate, were used. When concrete is made with normal weight coarse aggregate composed mainly of silica and silicates (quartz), it is referred to as siliceous aggregate concrete. However, when concrete is made with coarse aggregate, consisting mainly of calcium carbonate or a combination of calcium and magnesium carbonate (for example limestone and dolomite), it is referred to as carbonate aggregate concrete. The fine aggregate used in the concrete mix was sand.
Reinforcemen!
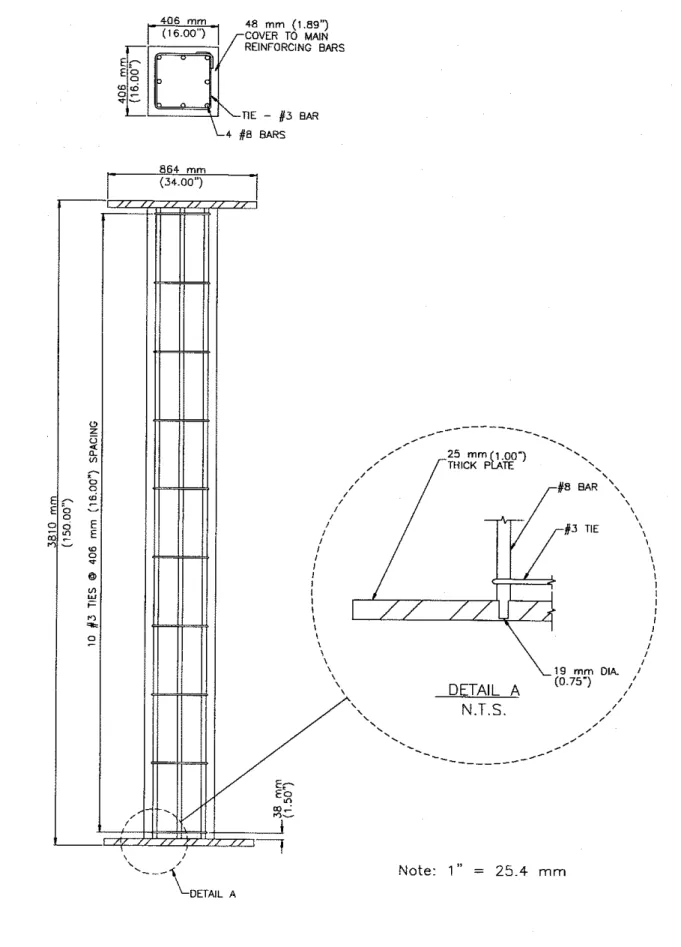
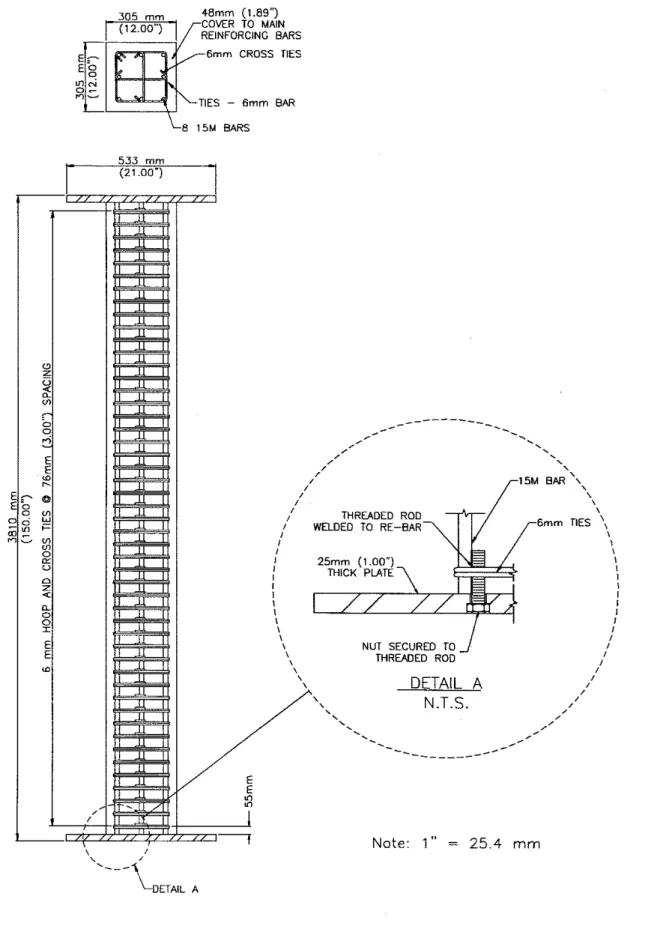
Deformed bars meeting requirements of ASTM A615-80 [8] were used as main and tie bars. The longitudinal steel in columns were symmetrical arrangements of 25 mm (No. 8) for Columns HS1 to HS6 and 16 mm (No. 5) for Columns HS7 to HS10. The ties were of 8 mm (No. 3) diameter for Columns HSI-HS6 while, for Columns HS7 to HS10, they were of 6 mm (114 in.) diameter. The spacing of ties for Columns HS1 to HS6 was 406 mm (16 in.). For Columns HS7 to HSlO the tie spacing was varied, as indicated in Table 2. The location of the main reinforcing bars that were welded to steel end plates, as well as the location of the ties, are shown in Figures 1 and 4. The main reinforcing bars and ties had a specified yield strength of 414 MPa (60 ksi).
The percentage of longitudinal steel in Columns HS1 to HS6 was 2.42% while, for Columns HS7 to HS9, it was 1.72%. Column HSlO had 2.58% longitudinal steel. The details of reinforcement, including the percentage of longitudinal steel, is given in Table 2. The details of reinforcing bars and ties are given in Figures 1 and 4.
The ties in Columns HS1 to HS6 were lapped with 90" bends at the ends. In Columns HS7 to HS10, the ends of all ties and cross-ties were bent 135" back into the core of the column. The confinement effect in Columns HS9 and HSlO were enhanced by providing additional two and four cross-ties, in addition to 6 mm (114 in.) ties at 76 mm (3 in.) spacing, respectively. The clear concrete cover of the ties was 38 mm (1.5 in.) for Columns HS1 to HS6 and 41 mm (1.6 in.) for Columns HS7 to HS10. Full details of ties, including the spacing and configuration, are given in Figures 1 and 4 and in Table 2.
Concrete Mix
Seven batches of concrete mixes were used in fabricating the columns. The seven batches were needed to obtain required test variables, such as concrete strength, aggregate type and size. The first six batches, Batches 1 to 6, were made at Construction Technology Laboratories Inc. in Skokie, Illinois, and were used to fabricate Columns HS1 to HS6, respectively. Columns HS7 to HSlO were fabricated using Batch 7 concrete mix, which was made at the University of Ottawa. Batches 3 and 5 were made with siliceous aggregate, while the remaining batches were made with carbonate aggregate.
Batch quantities and measured properties of the concrete mix are given in Tables 3 and 4. The 28-day cylinder compressive strengths of the batches ranged from 75 MPa (11 ksi) to 107 MPa (15.5 ksi).
Fabrication
The columns were cast in specially designed forms. The reinforcement cage, in Columns HS1 to HS6 was assembled by welding the longitudinal bars to the steel end plates. Chromel-alumel thermocouples were secured to the reinforcing steel at specific locations before the cage was properly positioned in the form. In order to avoid any possible dislocation of the thermocouples during casting, a careful working plan was followed as described below. In Columns HS7 to HS10, the longitudinal bars were welded to a threaded rod which were bolted to the end plates.
Reinforcina Bars and Steel Plates
The column length was 3810 mm (12 ft 6 in.) measured from end plate to end plate. The longitudinal reinforcing bars, in Columns HS1 to HS6, were cut to 3790 mm (12 ft 5 in.) and machined at both ends to the diameters (measured by micrometer),
shown in Figures 1 and 3. In Columns HS7 to HSIO the longitudinal bards were cut to 3760 mm (12 ff 4 in.) and welded to threaded steel rods (Fig. 4).
The details of end plates, including dimensions, are shown in Figures 1 and 4. Holes, with a diameter 1.6 mm (1116 in.) greater than that of the machined ends, were drilled through the plates to accommodate longitudinal bars.
The main bars and ties were tied together to complete the steel cage. The cage was then placed vertically on a levelled end plate in such a way that the machined segments of the bars were positioned in the holes.
Welding
The provisions of AWS Designation D12.1-75 [9] were followed when welding plates and bars. Special attention was given to the centering and perpendicularity of the end plates during welding. Mild steel welding rods were used to fill the holes on the outer face of the plates and which were drilled to accommodate the reinforcing bars. The rough surface of the welded joints on the drilled outer face of the plate was ground to a smooth finish.
The welding of the top steel plate was performed before casting the columns. Before positioning the top plate, a layer of mortar was spread over the top of the column to ensure good contact between steel plate and concrete. Using a similar procedure for the bottom plate, the top plate was welded on the outer side to the bars and smoothed.
Forms were made of smooth plywood, with the front side lefl open for depositing fresh concrete.
Instrumentation
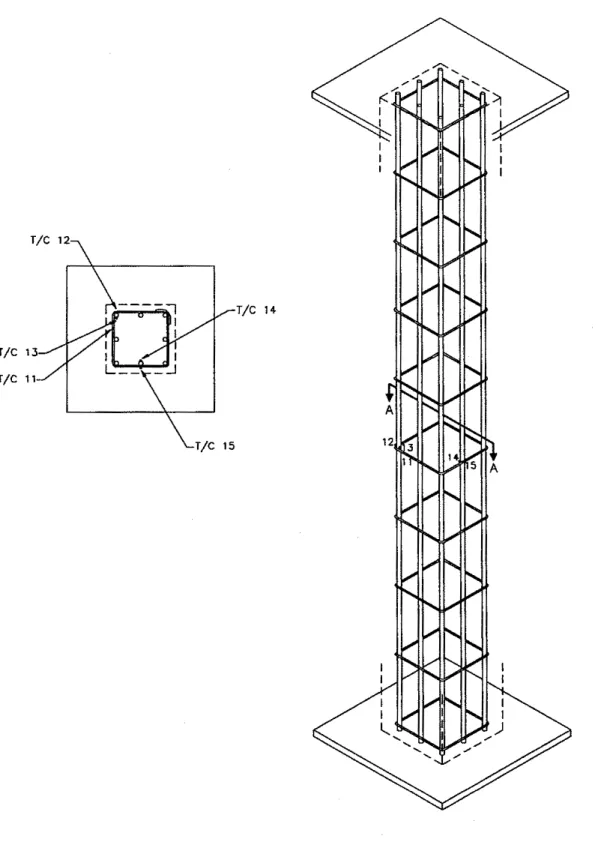
Type K chromel-alumel 0.91 mm (1128 in.) thick thermocouples were used for measuring concrete and steel temperatures at several locations. The thermocouples were tied to a steel rod that was secured to reinforcing bars of the column. The bar was fixed at both ends of the column, as shown in Figures 3 and 6.
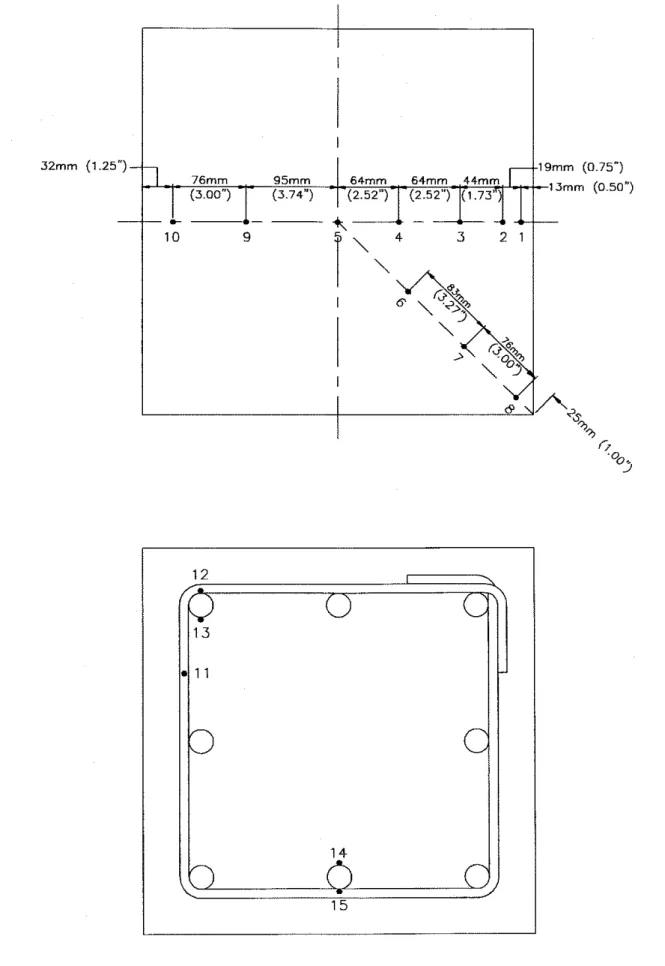
To measure the concrete temperatures, thermocouples were mounted on supplemental support, while steel temperatures were measured by mounting the thermocouples on rebars and ties. In Columns HS1 to HS6 and HSIO, a total of 15 thermocouples, 10 on concrete and 5 on reinforcement, were installed at mid-height of each column. In Columns HS7, HS8 and HS9, a total of 11 thermocouples, 7 on concrete and 4 on steel, were used to measure the temperatures. Exact locations and numbering of thermocouples are shown in Figures 2, 3, 5 and 6.
Concrete Placement
The concrete was mixed in a truck mixer. The columns were cast by placing the form works in a horizontal position. A concrete placement bucket, shovels and scoops were used to deposit the concrete in the form work. An internal vibrator was used to consolidate the concrete inside the columns. As the casting progressed upward, the window pieces were successively closed and tightly bolted to the form to avoid possible mortar leaks. The top surface of the columns was screened and finished with a small trowel.
In general, a year or more elapsed between the time a column was cast and the time it was tested.
Curing
Columns HS1 to HS6, constructed at CTL, were moist cured in their forms for approximately seven days. After the forms were removed, the columns were transferred to a drying chamber in order to reduce the internal moisture content. These columns were dried until the internal relative humidity was 75% or less or until they had cured for a year. After that, the columns were shipped to NRC for conducting fire tests.
Columns HS7 to HS10, constructed at the University of Ottawa, were cured under damp burlap for 7 days at 21 to 24°C (70 to 75'F). Forms were then stripped and the columns were conditioned in an atmosphere controlled at the same temperature, with a relative humidity of 30 to 40%. Approximately 3 months later, the columns were shipped to NRC for conducting fire tests.
TEST APPARATUS
The tests were carried out by exposing the columns to heat in a furnace specially built for testing loaded columns. The test furnace was designed to produce conditions to which a member might be exposed during a fire, i.e., temperatures, structural loads and heat transfer. It consisted of a steel framework supported by four steel columns, with the furnace chamber inside the framework (Figure 7). The characteristics and instrumentation of the furnace are described in detail in Reference 10. Only a brief description of the furnace and the main components are given here.
Loading Device
A hydraulic jack with a capacity of 9778 kN (1000 tonnes) produces a load along the axis of the test column. The jack is located at the bottom of the furnace chamber. The plate on the top of this jack can be used as a platform to which the column can be attached.
Eccentric loads can be applied by means of hydraulic jacks, one at the top and one at the bottom of the column, located at a distance of 508 mm (20 in.) from the axis of the column. The capacity of the top jack is 587 kN (133 kips) and the bottom jack is 489 kN (1 10 kips).
Furnace Chamber
The furnace chamber has a floor area of 2642 x 2642 mm (8 ft 8 in. x 8 ft 8 in.) and is 3048 mm (10 ft) high. The interior of the chamber is lined with insulating materials that efficiently transfer heat to the specimen. The ceiling and the floor insulation protects the column end plates from fire. It should be noted that only 3200 mm (10 ft 6 in.) of the column is exposed to fire.
There are 32 propane gas burners in the furnace chamber arranged in eight columns containing four burners each. The total capacity of the burners is 4700 kW (16 million Btulh). Each burner can be adjusted ind~vidually, which allows for a high degree of temperature uniformity in the furnace chamber. The pressure in the furnace chamber is also adjustable and was set somewhat lower than atmospheric pressure.
Instrumentation
The furnace temperatures were measured with the aid of eight Type K chromel- alumel thermocouples. The thermocouple junctions were located 305 mm (1 ft) away from the test specimen, at various heights. Two thermocouples were placed opposite each other at intervals of 610 mm (2 ft) along the height of the furnace chamber. The locations of their junctions and their numbering are shown in Figure 8. Thermocouples 4 and 6 were located at a height of 610 mm (2 ft) from the floor, Thermocouples 2 and 8 at 1220 mm (4 ft), Thermocouples 3 and 5 at 1830 mm (6 ft) and Thermocouples 1 and 7 at 2440 mm (8 ft). The temperatures measured by the thermocouples were averaged automatically and the average temperature was used to control the furnace temperature.
The loads were controlled by servocontrollers and measured with pressure transducers. The accuracy of controlling and measuring loads is about 4 kN (1 kip) at lower load levels and relatively better at higher loads.
The axial deformation of the test columns was determined by measuring the displacement of the jack that supported each column. The rotation of the end plates of the columns were determined by measuring the displacement of the plates at a distance
of 500 mm (20 in.) from the centre of the hinge, at the top and bottom respectively. The displacements were measured using transducers with an accuracy of 0.002-mm (1180- in.).
TEST CONDITIONS AND PROCEDURES
The columns, with fixed ends, were installed in the furnace by bolting their end plates to the loading head at the top and the hydraulic jack at the bottom. Before testing, the moisture condition at the centre of a column was measured by inserting a Vaisala' moisture sensor into a hole drilled in the concrete. In general, a moisture content, corresponding to approximately 50 to 86% relative humidity, was measured. The relative humidity of each column is given in Table 1.
In the case of columns with pinned ends, they were installed by bolting the top plate to the loading head and by securing the bottom plate to the hydraulic jack using carbide teeth.
End Conditions
Seven columns were tested with both ends fixed, i.e., restrained against rotation and horizontal translation. For this purpose, 8 19 mm (314 in.) diameter bolts, spaced regularly around the column, were used at each end to bolt the end plate to the loading head at the top and to the hydraulic jack at the bottom. Columns HS2, HS4 and HSlO were tested under hinged end conditions, i.e., with restraint against horizontal translation only. The hinged condition was obtained by bolting the end plates to the receiving plates with roller bearings at each end.
Loading
All columns were tested under a concentric load, except Column HS10, where the load was eccentric by 25 mrn (1 in.). The applied load on the columns ranged from
54% to 183% of full service load (factored compressive resistance of the column)
determined according to CSA Standard CSA-A23.3-M94 [7]. The factored compressive resistance of each column, as well as the applied loads, are given in Table 1. The factored compressive resistance of the columns were calculated using the effective length factor, K (0.65 for fixed ends and 1 for pinned ends). The factored resistance, computed using the PCACOL computer program [ I I] , together with applied loads on the column, are given in Table 1.
Certain commercial products are identified in this paper in order to adequately specify the experimental procedure. In no case does such identification imply recommendations or endorsement by the National Research Council, nor does it imply that the product or material identified is the best available for the purpose.
Column HS1 was tested with only a token load of 44.5 kN (10 kips). After reaching the 4 hour mark, the load on the column was increased at 445 kN (100 kips) increments every minute. Failure occurred at 248 min when the load level was 3279 kN (738 kips). Throughout the test, all the other columns were subjected to applied loads, as given in Table 1.
All loads were applied approximately 45 min before the start of the fire endurance test and were maintained until a condition was reached at which no further increase of the axial and rotational deformations could be measured. This condition was selected as the initial condition of the column deformations. The load was constant throughout the fire endurance test.
Fire Exposure
The ambient temperature at the start of each test was approximately 20%. During the test, each column was exposed to heating controlled in such a way that the average temperature in the furnace followed, as closely as possible, the CANIULC-S101 [I21 or ASTM-El19 [I31 standard temperature-time curve. This curve can approximately be expressed using the following equation:
where: t
=
time in hoursT,
=
temperature of furnace in "CRecording o f Results
The furnace, concrete and steel temperatures, as well as axial deformations of the columns were recorded at two-minute intervals. In the case of the eccentrically loaded columns, the rotation of the end plates of the column were also measured with varying frequencies, depending on the rate of change of the measured quantities.
Failure Criterion
The columns were considered to have failed, and the tests were terminated, when the axial hydraulic jack, which has a maximum speed of 76 mmlmin (3 in.lmin), could no longer maintain the load.
RESULTS AND DISCUSSION
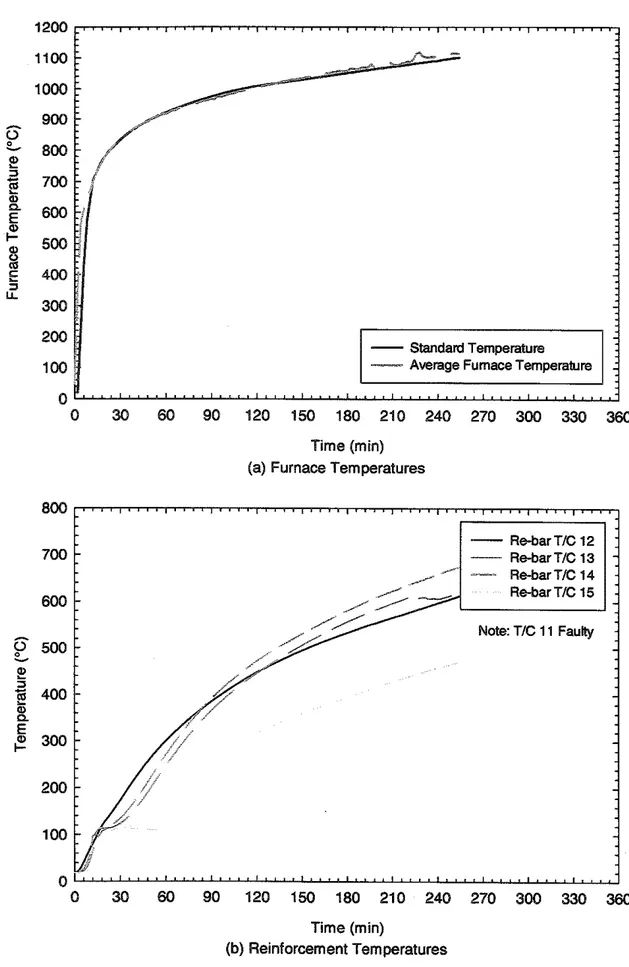
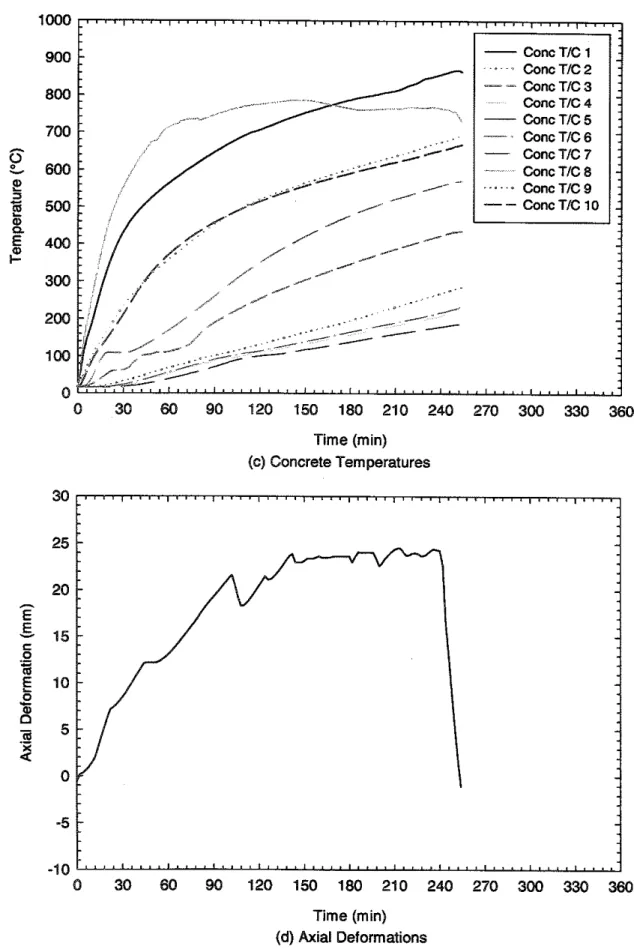
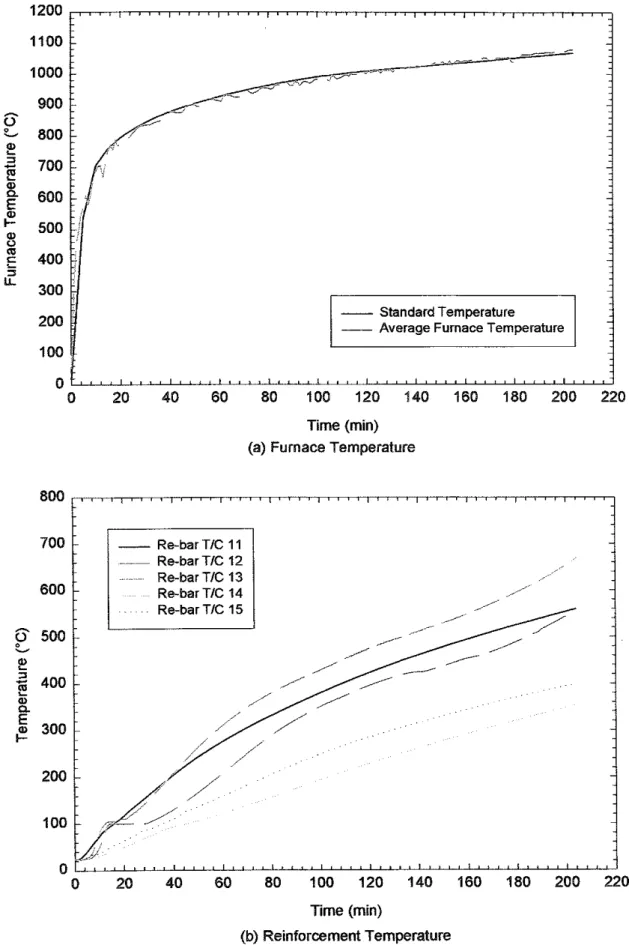
The results of the 10 column tests are summarized in Table 1, in which the column characteristics, test conditions, fire endurance and failure modes are given for each column. The furnace, concrete and steel temperatures recorded during the tests, as well as the axial deformations of the column specimens, are given in Tables A . l to A.10 in Appendix A. The temperatures and the axial deformations are also plotted in Figures A . l to A.10 in Appendix A, where positive axial deformation values indicate expansion of the column. For Columns HS2, HS4 and HS10, which had pinned ends, the rotation at the ends are also given in relevant tables. Figures B . l to B.10 in Appendix B show photographs of the column specimens after the fire tests.
The temperature plots for Column HS3 show some erratic trends after approximately 120 rnin of fire exposure. This was due to the shutting-off of the furnace which occurred because of exhaust damper controller problems in the furnace. As a result of furnace shut-off, the temperatures in the furnace dropped. This problem was rectified and the furnace was turned on immediately to complete the test. The temperature drop did not significantly alter the test since the duration of the furnace shut-off was short (approximately 3-5 min) and also, the effect of the drop in furnace temperature on the temperature of the inner layers of the steel and concrete was not significant (see Figures A.3 and A.4).
General Observations
During the fire tests, visual observations were made to record spalling, as well as crack propagation, in the columns. Also, after the completion of fire tests, post-test 0bse~ations were made to analyze the failure pattern, extent and nature of spalling and condition of rebars and ties. The following are some of the observations that were recorded.
Crackinq and Failure
The cracks in the columns progressed with time, at the corners of the cross- section, and led to spalling of chunks of concrete. While minute hairline cracks could be noticed at corners at approximately 20 to 30 min, the widening of these cracks occurred after approximately 60 min. These cracks would widen with time and run diagonally across the corner of the column section, reflecting on the adjacent face. Though these cracks widened to approximately 15 mm at the 1 hr 30 min mark, they did not intersect the reinforced core of the column.
The failure time, referred to as fire endurance, of each column, is given in Table 1. All columns failed in compression mode. In the case of HSC columns,
The early failure of Column HSlO was due to the application of a high load at an eccentricity of 25 mm (1 in.). The applied load was 1.83 times the full service load. The failure time would have been much higher if the load, calculated based on eccentricity and hinged end conditions, was less than or equal to the full service load.
The failure of this column occurred in compression mode with huge cracks developing in the longitudinal direction and closest to the face of the application of eccentric load.
The fire endurance from Column HS1 may not indicate the true performance of a loaded HSC column as this column was loaded with only a token load of 44.5 kN (10 kips). The load was increased after 4 hours at 445 kN (100 kips) increments every minute until the column failed. Failure occurred at 248 min, when the load level was 3279 kN (738 kips).
The lower fire endurance in Column HS6, as compared to Columns HS2 to HS4, is mainly due to high load intensity defined as the ratio of applied load to full service load.
Rebar and Ties
In most columns, the rebars and ties yielded before failure occurred. This can be seen by looking at the measured temperatures in rebars and ties given in Tables A.1- A.10. In some columns, such as Column HS6, yielding of reinforcement occurred earlier than failure as a result of the early loss in concrete cover due to spalling.
A post-failure examination of ties showed that the ties in Columns HS7 to HSlO performed better than those in Columns HS1 to HS6. In Columns HS1 to HS6, some ties opened up at the corners where they were lapped with 90" bent ends. However, in Columns HS7 to HS10, the opening up of ties was not evident mainly due to the fact that the ties were bent 135" back into the core of the column. In addition, the rebars in Columns HSI-HS6 had buckled significantly, as compared to those in Columns HS7 to HS10.
In HSC structural members, spalling is one of the main concerns which occurs due to the lower porosity of an HSC mix. During the tests, special attention was paid to making visual observations and to recording spalling, as well as crack propagation in the columns.
Generally, there was no significant spalling in the first few minutes. In the column with high relative humidity (Column HS5), some spalling was observed approximately 10-20 min into the fire endurance test. In columns where there were wider cracks, significant spalling at the corners was observed as the test progressed (after approximately 1 hour). Most of this spailing occurred towards the end of the test.
spalling was noticed in most columns. The spalling of chunks of concrete occurred when the large cracks progressed at the corners. This spalling was significant at about mid-height.
In Columns HS3 and HS5, the extent of spalling, before the failure of the column, was quite high and this could be attributed to the high relative humidity of these columns and the use of siliceous aggregate in the concrete mix [14]. Generally, the extent of spalling in Columns HS7 to HSlO was relatively less compared to that in Columns HS1 to HS6. This could be attributed to the tie configuration (bent 135' at the corners) and also to closer tie spacing in these columns.
Compared to the other columns tested, the spalling in Column HS6 was more extensive and of an explosive nature. This could be attributed to the high load intensity on this column (90% of the full service load), compared to similar Columns HSI-HS6.
In many of the HSC columns, cracking at the corners of the cross-section progressed with time, leading to spalling of chunks of concrete. This spalling was significant at about mid-height. While hairline cracks could be noticed at the 20 to 30 min mark, the widening of these cracks occurred after approximately 60 min or so. Factors Influencing Performance
Based on the analysis of test data and the visual observations made during and after the fire tests, some of the factors that influence the fire performance of HSC columns are briefly discussed below.
Effect of Concrete Strenqth
Data from the above tests, indicate that good fire endurance can be obtained for HSC columns. However, a comparison of the fire endurance in Table 1 with that of normal strength concrete columns [6,14] indicates that HSC columns have the lower fire endurance of the two. A fire endurance of 4 hours was obtained for high-strength concrete columns while, for similar NSC columns [15], it was approximately 6 hours. Data from the table shows that high fire endurance (3 hours or more) can be obtained for HSC columns even under full service loads. However, HSC columns must be reinforced with increased levels of confinement reinforcement over that used in normal strength concrete columns if the same fire endurance ratings are to be achieved by both types of columns.
Effect of Eccentricity
The fire test on Column HSlO was conducted by applying the load at an eccentricity of 25 mm (1 in.) to study the effect of eccentricity on the fire performance of an HSC column. While the standard test method does not require a fire endurance test to be conducted under an eccentric load, this test was nevertheless conducted. As can
be seen in Table 1, the decrease in fire resistance is significant and can be attributed to the high load that was applied at an eccentricity of 25 mm (1 in.). A load of 2954 kN (664 kips) which is 1.83 times the full service load for this column, was applied. The fire endurance would have been much higher if the applied load level was within the service load limit. The failure of this column was in compression mode with large longitudinal cracks developing in the compression face.
Effect of Lateral Reinforcement
Test results from Columns HS7 and HSlO can be used to study the influence of confinement on the fire performance of HSC columns. The higher fire endurance in Columns HS7, HS8 and HS9, as compared to Columns HS1 to HS6, can be attributed to the closer spacing and better detailing of the column ties (ties were bent 135" back into the core of the column and had increased lateral reinforcement). It should be noted that for Column HS9, where additional confinement was provided through cross ties and the bending of ties at 135" back into the core of the column, fire endurance as high as 266 min was obtained even under full service load.
Effect of Load Intensity
The influence of load on the fire endurance of HSC columns can be gauged approximately by comparing the performance of Columns HS8 and HS9. The fire endurance of a column increases with decreasing load. The fire endurance of Column HS9 with a load intensity of 1.23 was 266 min as compared to 290 min for Column HS8 with a load intensity of 0.8. This lower fire endurance occurred in spite of Column HS9 having a higher confinement (additional cross-ties) than Column HS8. Effect of Aaareaate T V D ~
The effect of the aggregate type on the fire endurance of HSC columns is illustrated by comparing the performance of Columns HS3 and HS7. While there are other differences in the configuration of these two columns, such as the concrete strength and load level, one of the major variables is the type of aggregate. The fire endurance of Column HS7 (made with carbonate aggregate concrete) is 10% higher than Column HS3 (made with siliceous aggregate concrete). This occurs mainly because carbonate aggregate has a substantially higher heat capacity (specific heat) than siliceous aggregate due to an endothermic reaction that takes place in carbonate aggregate at about 700°C (1300°F) 1141. It could be argued that the contribution to higher fire endurance in Column HS7 is mainly due to carbonate aggregate as any positive contribution from better tie configuration goes towards counteracting the effects from a higher load level and higher concrete strength (compared to that for Column HS3).
The aggregate type also influences the spalling phenomenon. In Columns HS3 and HS5, the extent of spalling, before the failure of the column, was quite high as compared to other columns. This could be partly attributed to the effect of aggregate
type used in the concrete mix. Of the two concrete types, carbonate aggregate concrete provides better spalling resistance than siliceous aggregate concrete [5,6,14]. The higher specific heat and lower thermal expansion of carbonate aggregate concrete at higher temperatures contributes to this spalling resistance.
Columns HS3 and HS5 were made with siliceous aggregate concrete while the remaining columns were made with carbonate aggregate concrete. The specific heat of carbonate aggregate concrete, above a temperature of 600°C, is generally much higher than that of siliceous aggregate concrete. This heat is approximately 10 times the heat needed to produce the same temperature rise in siliceous aggregate concrete. The increase in specific heat is likely caused by the dissociation of the dolomite in the carbonate concrete and is beneficial in preventing the spalling of the concrete [14].
SUMMARY
Based on the fire tests conducted in this study, the behaviour of HSC columns at high temperatures is different from that of NSC columns. The fire endurance of HSC columns with equivalent levels of confinement is lower than that of NSC columns. However, fire endurance up to 4 hours can be obtained with HSC columns if sufficient confinement is provided.
Type of aggregate, load intensity, eccentricity, detailing and spacing of ties, all have an influence on the fire resistance performance of HSC columns.
No significant spalling was observed in the initial stages of fire exposure. Generally, the spalling in HSC columns was significant only towards the end of the tests. The type of aggregate, relative humidity, load intensity, detailing and spacing of ties have an influence on spalling.
These fire tests were carried out in order to develop design guidelines for predicting the fire endurance of HSC columns. However, further data is needed to quantify the influence of various parameters on the fire performance of HSC columns. In the interim, the test results given in this report can be used for assessing the fire endurance of HSC columns that lie within the range of the variables examined in this study. The studies currently in progress at NRC, with the collaboration of PCA, will generate additional data on the fire endurance of HSC columns and will identify the conditions under which these columns can be safely used.
REFERENCES
1. National Building Code of Canada, National Research Council of Canada, Ottawa, ON, 1995.
2. Phan, L.T. "Fire Performance of High-Strength Concrete: A Report of the State- of-the-Art", National Institute of Standards and Technology, Gaithersburg, MD, 1996.
3. Diederichs, U., Jumppanen, U.M. and Schneider, U., "High Temperature Properties and Spalling Behaviour of High-strength Concrete", Proceedings of Fourth Weimar Workshop on High Performance Concrete, HAB Weimar, Germany, 1995., pp.219-235.
4. Kodur, V.K.R., "Performance of High Strength Concrete-Filled Steel Columns Exposed to Fire", Canadian Journal of Civil Engineering, 26 (6), 1998, pp.975- 981.
5. Kodur, V.K.R. and Sultan, Mohamed, "Thermal Properties of High-strength Concrete at Elevated Temperatures", CANMET-ACI-JCI International Conference, Tokushima, Japan, June 1998.
6. Kodur, V.K.R. and Sultan, Mohamed, "Behaviour of High-strength Concrete Columns Exposed to Fire", Concrete Canada International Conference Symposium, Sherbrooke, QC, Vol. 4, pp. 217-232, 1998.
7. Canadian Standards Association, "Code for the Design of Concrete Structures for Buildings", CAN3-A23.3-M94, Rexdale, ON, 1994.
8. American Society for Testing and Materials, "Standard Specification for Deformed and Plain Bullet-Steel Bars for Concrete Reinforcement", ASTM A61 5-80.
9. American Welding Society, "Reinforcing Steel Welding Code", AWS- D12.1-75. 10. Lie, T.T., "New Facility to Determine Fire Resistance of Columns", Canadian
Journal of Civil Engineering, 7(3), 1980, pp. 552-558.
11. Canadian Porland Cement Association, "Strength Design of Reinforced Concrete Column Sections", PCACOL, Ottawa, ON, Canada, 1994.
12. Underwriters' Laboratories of Canada, "Standard Methods of Fire Endurance Tests of Building Construction and Materials", CANIULC-S101-M89,
Scarborough, ON, 1989,49 pp.
13. American Society for Testing and Materials, "Standard Methods of Fire Endurance Tests of Building Construction and Materials", ASTM E l 19-88, Philadelphia, PA, 1990.
14. Lie, T.T., Editor, "Structural Fire Protection: Manual of Practice", ASCE Manual and Reports on Engineering Practice, No. 78, American Society of Civil
Engineers, New York, NY, 1993.
15. Lie, T.T., and Woollerton, J. L., "Fire Resistance of Reinforced Concrete Columns: Test Results", Institute for Research in Construction Internal Report No. 569, National Research Council of Canada, Ottawa, ON, 1998, 302 pp.
LIST OF TABLES
Table 1. Summary of test parameters and results
Table 2. End plate and reinforcement details for Columns Table 3. Concrete mix batch quantities for Columns HS1 to HS6 Table 4. Concrete mix batch quantities for Columns HS7 to HSlO
LIST OF FIGURES Fig. 1 Fig. 2 Fig. 3 Fig. 4 Fig. 5 Fig. 6 Fig. 7 Fig. 8
Elevation and Cross-Sectional Details of Columns HS1 to HS6 Location of Thermocouples on Frame in Columns HS1 to HS6
Location of Thermocouples on Reinforcing Bars in Columns HS1 to HS6 Elevation and Cross-Sectional Details of Columns HS7 to HSlO
Location of Thermocouples on Frame in Columns HS7 to HSlO
Location of Thermocouples on Reinforcing Bars in Columns HS7 to HSlO Column Test Furnace
Fig. A . l Temperatures and Axial Deformation for Column HS1 (a) Furnace Temperatures
(b) Temperatures in Reinforcement (c) Temperatures in Concrete (d) Axial Deformations Fig. A.2 Fig. A.3 Fig. A.4 Fig. A.5 Fig. A.6 Fig. A.7 Fig. A.8 Fig. A.9 Fig. A.10
Temperatures and Axial Deformation for Column HS2 Temperatures and Axial Deformation for Column HS3 Temperatures and Axial Deformation for Column HS4 Temperatures and Axial Deformation for Column HS5 Temperatures and Axial Deformation for Column HS6 Temperatures and Axial Deformation for Column HS7 Temperatures and Axial Deformation for Column HS8 Temperatures and Axial Deformation for Column HS9 Temperatures and Axial Deformation for Column HSlO
Fig. B . l View of Column HS1 after Fire Test Fig. 8.2 View of Column HS2 after Fire Test Fig. 8.3 View of Column HS3 after Fire Test Fig. B.4 View of Column HS4 after Fire Test Fig. 8.5 View of Column HS5 after Fire Test Fig. 8.6 View of Column HS6 after Fire Test Fig. B.7 View of Column HS7 after Fire Test Fig. B.8 View of Column HS8 after Fire Test Fig. B.9 View of Column HS9 after Fire Test Fig. B.10 View of Column HSlO after Fire Test
Table 1: Summary of test parameters and results
At 240 min the load on the column was increased at a rate of 445 KN (100 kips)/min. Failure occurred at 248 min when the load was 3,279.1 KN (737.8 kips)
" P
-
Load intensityC Carbonate aggregate
S Siliceous aggregate CF Compression failure
Table 3 Concrete mD: batch quanbbes for Columns HS1 to HS6
arse Aggregate (SSD)
ater:Cement Ratio ater:Cementifious
Day Compressive Strength
Day Compressive Sbngth
[ l ] Dry weight
[Z] Weight of total water in mix including admixtures
131 Tested at 54 days
141 Tested at 55 days
C Carbanate aggregate
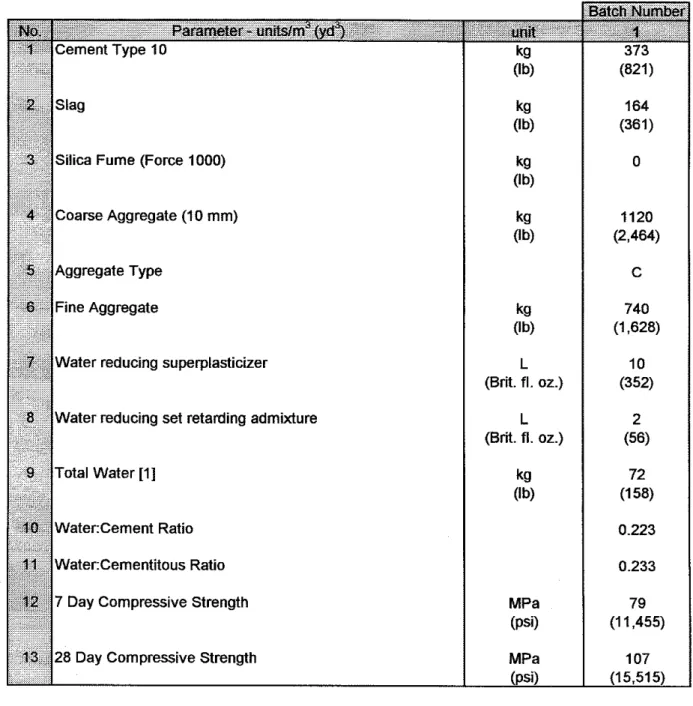
Table 4: Concrete mix batch quantities for Columns HS7 to HSlO
Silica Fume (Force 1000)
Coarse Aggregate (10 mm)
Water reducing superplasticizer
Water reducing set retarding admixture
Water:Cement Ratio Water:Cementitous Ratio
7 Day Compressive Strength
28 Day Compressive Strength
[ I ] Weight of total water in mix including moisture and drum wash C Carbonate aggregate
REINFORCING BARS
nE - #3 BAR
Note: 1 " = 25.4 mm
Fig. 3 Location of Thermocouples on Reinforcing Bars
TIE - 6mm BAR
L8 I S M BARS
REINFORCING BARS TIE - 6mm BAR ' 8 15M BARS I THREADED ROD NUT SECURED TO THREADED ROO DETAIL A
,
, ,,
, 2 , /---__---
Note. 1" = 25.4 m m1 ~ 5 mm 48mm (1.89") COVER TO MAIN
-
REINFORCING BARS>6mm CROSS TIES
TIES - fimm BAR
,'
THREADED ROD1 WELDED TO RE-BAR 6mm TIES
',
,
,
I I I,
,
I I t I I I I I I I I I I I I I \ \,
NUT SECURED TO_/
THREAOEO ROO Note: 1" = 25.4 mrnI
305 mm ('-a'') OVER TO MAIN -, ('2.00'1 , REINFORCING BARS E c- 6mm CROSS TIES E 0 9 "7 0 0-
I1 Y TIES-
6mm BAR 8 15M EARST/C 4
1
SECTION A-ASECTION A-A
SECTION A-A
T I
C 4J
SECTION A-A
Columns HS7 t o 9
Typical Thermocouple Configuration (Tie Configuration Varies)
Note: 1'' = 25.4 mm
c o l u m n HSlO
Fig. 6 Location o f Thermocouples o n Reinforcing Bars in Columns HS7 t o HSlO
(EAST
SIDE)
TOP
VlEW
SIDE VlEW
APPENDIX A
Table A.l(a): Furnace temperatures for Column HS1 Note: "F
=
("C x 915)+
32Table A.l(a): Furnace temperatures for Column HS1 (cont'd) Note: "F
=
("C x 915) +32
Table A.l(b): Temperatures in reinforcement for Column HS1
Table A.l(b): Temperatures in reinforcement for Column H S 1 (cont'd) Note: "F = ("C x 915) + 32, '-' denotes faulty thermocouple
Table A.l(c): Temperatures in concrete for Column HS1
Table A.l(c) Temperatures in concrete for Column HS1 (cont'd) Note: "F
=
("C x 91.5)+
32Table A.
I
(d): Axial deformations for Column H S 1Table A.l(d): Axial deformations for Column HS1 (cont'd) Note: 1"
=
25.4 mmTable A.2(a): Furnace temperatures for Column HS2 Note: "F = ("C x 915) + 32
Table A.2(a): Furnace temperatures for Column HS2 (cont'd) Note: "F
=
("C x 915)+
32 Time[min)
200 204 T a d . Temp.) 1066 1068 T(Furn. Temp.)Yc)
1077 1080Table A.2(b): Temperatures in reinforcement for Column HS2 Note: "F
=
("C x 915) +32
Table A.2(b): Temperatures in reinforcement for Column HS2 (cont'd) Note: "F
=
("C x 915) +32
Table A 2(c) Temperatures in concrete for Column HS2 Note "F
=
("C x 915) +32
Table A.2(c): Temperatures in concrete for Column HS2 (cont'd) Note. "F
=
("C x9/5)
+ 32
Table A.2(d): Axial deformations and bearing rotations for Column
HS2
Table A.2(d): Axial deformations and bearing rotations for Column HS2 (cont'd) Note: 1" = 25.4 rnrn
Table A.3(a): Furnace temperatures for Column HS3
Table A.3(a): Furnace temperatures for Column HS3 (cont'd) Note: "F
=
("C x 915) +32
Table A.3(b): Temperatures in reinforcement for Column HS3 Note: "F
=
("C
x 915) + 32Table A.3(b): Temperatures in reinforcement for Column HS3 (conrd)
Table A.3(c): Temperatures in concrete for Column HS3 Note: "F
=
("C x 915)+
32Table A.3(c): Temperatures in concrete for Column HS3 (cont'd) Note: "F
=
("C x 915) +32
Table A.3(d): Axial deformations for Column HS3 Note: 1"
=
25.4 mmTable A.3(d): Axial deformations for Column HS3 (cont'd) Note: 1" = 25.4 mrn
Table A.4(a): Furnace temperatures for Column
HS4
Table A.4(b): Temperatures in reinforcement for Column HS4 Note:
"F =
("C x 915) + 32, '-' denotes faulty thermocoupleTable A.4(b): Temperatures in reinforcement for Column HS4 (cont'd) Note:
"F
=
("C x 915) + 32, '-' denotes faulty thermocoupleTable A.4(c) Temperatures in concrete for Column HS4 Note. "F
=
("C x 915) + 32,'-'
denotes faulty thermocoupleTable A.4(c): Temperatures in concrete for Column HS4 (cont'd) Note: "F
=
("C x 915)+
32,'-'
denotes faulty thermocoupleTable A.4(d): Axial deformations and bearing rotations for Column
HS4
Table A.5(a): Furnace temperatures for Column HS5 Note: "F
=
("C x 915) + 32Table A.5(a): Furnace temperatures for Column HS5 Note: "F
=
("C x 915) + 32Table A.5(b): Temperatures in reinforcement for Column HS5 Note: "F
=
("Cx
915) + 32Table A.5(b): Temperatures in reinforcement for Column HS5 Note: "F
=
("C x 915) + 32Table A.5(c): Temperatures in concrete for Column HS5 Note: "F
=
("C x 915) + 32,'-'
denotes faulty thermocoupleTable A.5(c): Temperatures in concrete for Column HS5 (cont'd) Note. "F
= ("C
x 915)+
32, '-' denotes faulty thermocoupleTable A.5(d): Axial deformations for Column HS5 Note: 1"
=
25.4 mmTable A.5(d): Axial deformations for Column HS5 (cont'd) Note: 1"
=
25.4 mmTable A.6(a): Furnace temperatures for Column HS6 Note: "F = ('C x 915)
+
32
Table A.6(b): Temperatures in reinforcement for Column HS6 Note: "F = ("C x 915) +
32
Table A.6(c): Temperatures in concrete for Column HS6 Note: "F = ("C x 915) + 32, '-' denotes faulty thermocouple
Table A.6(d): Axial deformations for Column HS6 Note: 1"
=
25.4 mmTable A.7(a): Furnace temperatures for Column HS7 Note: "F
=
("C x 91.5) +32
Table A.7(a): Furnace temperatures for Column HS7 (cont'd) Note: "F
=
("C x 915) + 32Table A.7(b): Temperatures in reinforcement for Column HS7 Note: "F
=
("C x 915) +32
Table A.7(b): Temperatures in reinforcement for Column HS7 (cont'd) Note: "F
=
("C x 915) +32
Table A.7(c): Temperatures in concrete for Column HS7 Note: "F
=
("C x 915)+
32
Table A.7(c): Temperatures in concrete for Column HS7 (cont'd) Note: "F
=
("C x9/51)
+
32Table A.7(d): Axial deformations for Column HS7 Note: 1"
=
25.4 mmTable A.7(d): Axial deformations for Column HS7 (cont'd) Note: 1" = 25.4 mm
Table A.8(a): Furnace temperatures for Column HS8 Note: "F
=
("C x 915)+
32
Table A.S(a): Furnace temperatures for Column HS8 (cont'd) Note:
"F
=
("C x 915)+
32
Table A.8(b): Temperatures in reinforcement for Column HS8 Note: "F
=
("Cx
915) +32
Table A.8(b): Temperatures in reinforcement for Column HS8 (cont'd) Note: "F
=
("C x915)
+
32
Table A.8(c): Temperatures in concrete for Column HS8 Note: "F
=
("C x 915) + 32, '-' denotes faulty thermocoupleTable A.8(c): Temperatures in concrete for Column HS8 (cont'd) Note: "F
=
("C x 915) + 32,'-'
denotes faulty thermocoupleTable A.8(d): Axial deformations for Column HS8 Note: 1" = 25.4 mm
Table A.8(d): Axial deformations for Column HS8 (cont'd)
Table A.9(a): Furnace temperatures for Column HS9 Note: "F
=
("C x 915) +32
Table A.9(a): Furnace temperatures for Column HS9 (cont'd) Note: "F
=
("C x 915) +32
Table A.9(b): Temperatures in reinforcement for Column HS9 Note: "F
=
("C x 915) + 32, '-' denotes faulty thermocoupleTable A.9(b): Temperatures in reinforcement for Column
HS9
(cont'd) Note: "F = ("C x 915)+
32, '-' denotes faulty thermocoupleTable A.Q(c): Temperatures in concrete for Column HS9 Note:
"F
=
("C x 915) + 32Table A.9(c): Temperatures in concrete for Column HS9 (cont'd) Note:
"F
=
("C x 915) +32
Table A.9(d): Axial deformations for Column HS9 Note:
1" =
25.4rnrn
Table A.9(d): Axial deformations for Column HS9 (cont'd) Note: 1"
=
25.4 mmTable A.lO(a): Furnace temperatures for Column HSlO Note: "F = ("C x 915) +
32
Table A.lO(b): Temperatures in reinforcement for Column HS10 Note: "F
=
("C x 915) +32
Table A.lO(c): Temperatures in concrete for Column HS10 Note: "F
=
("C x 915)+
32
Table A.lO(d): Axial deformations and bearing rotations for Column HSlO Note: 1"
=
25.4 mmTime (min) (a) Furnace Temperatures
Time (min)
(b) Reinforcement Temperatures
Time (min) (c) Concrete Temperatures
Time (min) (d) Axial Deformations
800 , , , , , , , , , , , , , , , , , , , , ~ , 7 . , 7 7 7 7 , s , . 8 , 3 , , , , 7 , . , , , , , , , . , , , - - - Re-bar TIC 12 Re-bar TIC 13 Re-bar TIC 14 - Re-bar TIC 15 . - - - - 0
~
~
~
~
'
~
~
~
~
'
~
~
~
~
'
~
~
~
~
'
~
~
~
~
'
~
~
~
~
'
~
~
~
~
'
~
~
~
~
~
~
~
"
'
~
~
~
~
~
~
'
~
'
0 20 40 60 80 100 120 140 160 180 200 220 1200 , . , , , , 8 , x , , , . , , , , , , , , , , , , , , , . , , . . . 3 . . , . , , , , , 8 , , , , , , , , , Time (min) (b) Reinforcement Temperature 1100 1000 900Fig. A.2 Temperatures, axial Deformations and Bearing Rotations for Column HS2
- /
--
> ".~
-cc-
- /- -
- 800 / / = = - - 0 400 - 3 U. 300 200 100 1 1 1 1 1 1 1 ~ ~ ' ~ ~ ~ ~ ' 9 ~ ~ ~ 1 1 ~ 1 ~ ~ ~ ~ ~ ~ ' ~ ~ ~ ~ ' ~ ~ ~ 1 ' 1 1 1 1 1 1 ~ 1 1 1 1 1 1 ~ -0 20 40 60 80 100 120 140 160 180 200 220 Time (min)(a) Furnace Temperature
+
i
-
. - ConcTIC2
-
Conc TIC 5 Time (min) (c) Concrete Temperatures Time (min) (d) Axial DeformationsTime (min)
(e) Top Bearing Rotation
Time (min)
(f) Bottom Bearing Rotation
1200 1100 loo0 900
-
a
800e
a-
2
700 m P 600E
500 400 3 U. 300 200 100 0 0 30 60 90 120 150 180 210 240 270 300 330 360 Time (min)(a) Furnace Temperature
Re-bar TIC 11 Re-bar TIC 12 Re-bar TIC 13 Re-bar TIC 14 0 0 30 60 90 120 150 180 210 240 270 300
330
360 Time (min) (b) Reinforcement TemperaturesConc TIC 1
-
ConcTlC 2 Conc TIC 3 Conc TIC 4 Conc TIC 5 Conc TIC 6 Conc TIC 7 Cow TIC 8-
CowTlC9--
Cow TIC 10 030
60 90 120 150 180 210 240 270300
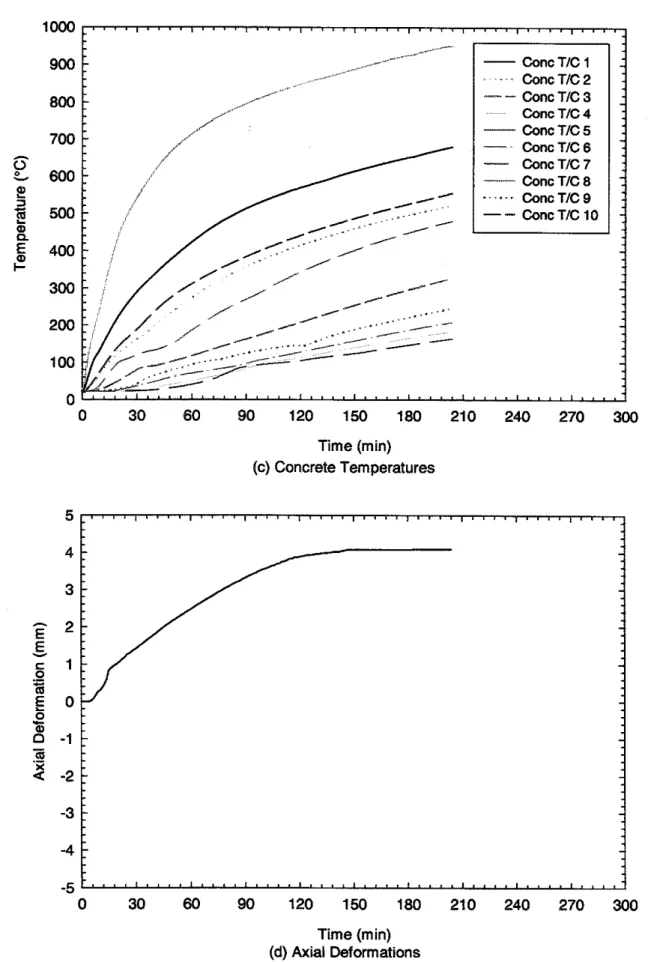
330 360 Time (min) (c) Concrete Temperatures Time (min) (d) Axial DeformationsTime (min) (a) Furnace Temperatures
Rebar TIC 14
Note: TIC 13 Faulty
Time (min)
(b) Reinforcement Temperatures
Conc TIC 1 Conc TIC 2 Conc TIC 3 Conc TIC 4 Conc TIC 5 Conc TIC 6 Conc TIC 7 Conc TIC 8 Conc TIC 10 Time (min) (c) Concrete Temperatures Time (min) (d) Axial Deformations
Time (min) (e) Top Bearing Rotation
0.10 0.08 0.06 0.04
-
0.02 0.00z
-
c -0.02 0'=
-
6 -0.04;
-0.06 m r -0.08 .- L8
-0.10 m -0.12 -0.14 -0.16 -0.18 -0.20 0 30 60 90 120 150 Time (min) (f) Bottom Bearing RotationTime (min) (a) Furnace Temperatures
Rebar TIC 11 Re-bar TIC 12 Rebar TIC 13 Re-bar TIC 14 Re-bar TIC 15 Time (min) (b) Reinforcement Temperatures
Conc TIC 1 Conc TIC 2 Conc TIC 3 Conc TIC 4 Conc TIC 5 Conc TIC 8 Cmc TIC 7
- -
Cmc TIC 8 Conc TIC 9--
Cmc TIC 10 Time (min) (c) Concrete Temperatures Time (min) (d) Axial DeformationsStandard Temperature
Time (min)
(a) Furnace Temperatures
Re-bar TIC 1 1 Re-bar TIC 12 Re-bar TIC 13 Re-bar TIC 14
.
. - . ~ Re-bar TIC 15 800 700 600p
500-
$
5
400 a,E
8
300 200 100 0 0 30 60 90 120 150 180 Time (min) (b) Reinforcement TemperaturesConc TIC 1 ~ . . . . ~ Conc TIC 2 Conc TIC 3 Conc TIC 5 Conc TIC 6 Conc TIC 7 . . . Conc TIC 8
~...
Conc TIC 9--
Cone TIC 10 Time (min) (c) Concrete Temperatures Time (min) (d) Axial Deformations1200 1100 1000 900
P
-
800 9! a 700s
m 600E3
500$
5 400 3 !L 300 200 100 0 0 30 60 90 120 150 180 210 240 270 300 330 360 390 Time (min) (a) Furnace TemperaturesRe-bar TIC 1 Re-bar TIC 2 Re-bar TIC 3 Re-bar TIC 4 Time (min) (b) Reinforcement Temperatures
1000 900 800 Conc TIC 8 700
-
Conc TIC 99
600 e! 3-
500$
9. 400 I- 300 200 100 0 0 30 60 90 120 150 180 210 240 270 300 330 360 390 Time (min) (c) Concrete Temperatures Time (min) (d) Axial DeformationsStandard Temperature
Time (min) (a) Furnace Temperatures
Time (min)
(b) Reinforcement Temperatures
- - - ConcTIC6
-
Conc TIC 9 0 30 60 90 120 150 180 210 240 270300
330 360 390 420 Time (min) (c) Concrete Temperatures Time (min) (d) Axial DeformationsTime (min)
(a) Furnace Temperatures
Note: TIC 3 Faulty
Time (min)
(b) Reinforcement Temperatures
Conc TIC 5 Conc TIC 6 Conc TIC 7 Conc TIC 8 Conc TIC 9 Conc TIC 10 Cone TIC 11 0 0 30 60 90 120 150 180 210 240 270 300 330 360 390 Time (min) (c) Concrete Temperatures Time (min) (d) Axial Deformations
Time (min)
(a) Fumace Temperatues
Re-bar TIC 1 Re-bar TIC 2 Re-bar TIC 3 Re-bar TIC 4 20 40 60 80 Time (min) (b) Reinforcement Temperatures
Conc TIC 5
-
ConcTlC6 Conc TIC 7 Conc TIC 8 Conc TIC 9 Conc TIC 10 Conc TIC 11 Conc TIC 12-
.
Conc TIC 13 Conc TIC 14 Conc TIC 15 Time (min) (c) Concrete Temperatures Time (min) (d) Axial DeformationsTime (min) (f) Bottom Bearing Rotation 1 0
-
-
g
-1-
-
D
6
.--
g
- 2 --
a:
m s.-
5
- 3 :-
mFig. A.10 Temperatures, Axial Deformations and Bearing Rotations for Column HSlO (cont'd)
-4
-
-
-5
0 20 40
60
80Time (min) (e) Top Bearing Rotation
APPENDIX