READ THESE TERMS AND CONDITIONS CAREFULLY BEFORE USING THIS WEBSITE.
https://nrc-publications.canada.ca/eng/copyright
Vous avez des questions? Nous pouvons vous aider. Pour communiquer directement avec un auteur, consultez la première page de la revue dans laquelle son article a été publié afin de trouver ses coordonnées. Si vous n’arrivez pas à les repérer, communiquez avec nous à [email protected].
Questions? Contact the NRC Publications Archive team at
[email protected]. If you wish to email the authors directly, please see the first page of the publication for their contact information.
NRC Publications Archive
Archives des publications du CNRC
This publication could be one of several versions: author’s original, accepted manuscript or the publisher’s version. / La version de cette publication peut être l’une des suivantes : la version prépublication de l’auteur, la version acceptée du manuscrit ou la version de l’éditeur.
Access and use of this website and the material on it are subject to the Terms and Conditions set forth at
Automated Pavement Distress Data Collection and Analysis: A 3-D
Approach
Bursanescu, L.; Blais, François
https://publications-cnrc.canada.ca/fra/droits
L’accès à ce site Web et l’utilisation de son contenu sont assujettis aux conditions présentées dans le site LISEZ CES CONDITIONS ATTENTIVEMENT AVANT D’UTILISER CE SITE WEB.
NRC Publications Record / Notice d'Archives des publications de CNRC:
https://nrc-publications.canada.ca/eng/view/object/?id=4543892c-f811-407b-abb7-b58398f4de5c https://publications-cnrc.canada.ca/fra/voir/objet/?id=4543892c-f811-407b-abb7-b58398f4de5cNational Research Council Canada Institute for Information Technology Conseil national de recherches Canada Institut de technologie de l'information
Automated Pavement Distress Data Collection
and Analysis: A 3-D Approach *
Bursanescu, L., and Blais, F.
May 1997
* published in the Proceedings of International Conference on Recent Advances in 3-D Digital Imaging and Modeling. Ottawa, Ontario, Canada. May 12-15, 1997. pp. 311-317. NRC 41574.
Copyright 1997 by
National Research Council of Canada
Permission is granted to quote short excerpts and to reproduce figures and tables from this report, provided that the source of such material is fully acknowledged.
Automated Pavement Distress Data Collection and Analysis:
a 3-D Approach
Liviu Bursanescu
G.I.E. Technologies, Montréal, Québec, Canada, H2Y 1L5.
François Blais
National Research Council of Canada
Institute for Information Technology, Ottawa, Ontario, Canada, K1A 0R6
Abstract
This paper describes a 3-D automated pavement distress data collection and analysis system based on NRC’s Biris sensor technology. The paper introduces the problem to be solved, the selected design criteria, and the adopted solution to monitor the quality of road surfaces. The system geometry for the acquisition of the three-dimensional coordinates of pavement surface distresses is presented. Multiple feature extraction and system integration concepts are given with emphasis placed on the real-time processing of the raw data by a parallel array of processors. Advantages and disadvantages of this technology will be discussed. System performances and experimental results are provided.
1. Introduction
Throughout the end of this century, roads will continue to be one of the most important and valuable asset to preserve. At a time when speed of communication and mobility are important factors, maintaining roads in good shape is of national interest. As governments try hard to balance public finances and to reduce deficits by restraining budgets, maintaining the road network has become a high target challenge. Doing more with less requires good management that needs to be kept informed, quickly and accurately. Gathering reliable information within a reduced time frame allows budget optimization, taking the right decision at the right time.
Current pavement data collection still necessitates several heterogeneous data acquisition technologies integrated more or less together in a mix difficult to operate. Even tough some of these technologies perform real-time pre-processing, most of the data analysis is still done by tedious and time consuming post-processing procedures. The main parameters of interest for pavement management are the cracks pattern, ruts depth, and the roughness of the surface. Until now, measurement of each of these parameters required a different technology and procedure making data registration a very difficult task. As an example, the roughness is characterized by the International Roughness Index (IRI) which is calculated from the longitudinal profile of the road in the wheel path.
Semi-automated systems currently in use for distress data collection are equipped with video cameras, strobe lights, and video recorders to collect video images, and occasionally lasers for measurements of the pavement surface [1]. The laser data is used to measure rut depth and longitudinal profiles with resolutions limited by the number of laser probes. For example the RST (Road Surface Tester) is equipped with 11 single point triangulation range sensors [2]. With a lateral resolution of several cm, single point sensors are certainly not sufficient for crack detection.
2. Challenge
Being aware of the actual difficulties of existing pavement data acquisition and interpretation systems, the
problem to solve is the identification and the development of a technology capable of providing rapid, accurate, and reliable information about the main parameters of interest that describe the status of the road. The solution must be unique to all main parameters and must allow an easy and fast access to results.
It is obvious that, whatever the solution, it must operate in real-time to reduce the gathering and post-processing of the data to a minimum. In terms of real-time implementation, the duration of data analysis must not dramatically exceed the duration of data acquisition. Another important established criteria is the capability to use the same technology for most surface distress parameters in a single pass data collection. With these constraints, the choices are very limited and optical 3-D sensors were the answer. The key features provided by such a technology are high resolution and high accuracy for both range and photometric data. The selection of the sensor was pinpointed on an enhanced version of the Biris 3-D sensor. Previously developed by the NRC for general applications, the Biris sensor was redesigned to meet the specific requirements of the pavement inspection application. A description of the Biris operating principle and main features can be found in [3].
There are several arguments that are pleading in favor of the Biris technology [4] [5]:
1. it is a rugged non contact optical sensor,
2. it uses a combination of two techniques for range calculation (triangulation and defocusing) that improves the signal-to-noise ratio and reduces false measurements,
3. several laser beams or profiles can be simultaneously projected on the surface under inspection, increasing the number of 3-D measurements,
4. range and intensity data are perfectly registered. The availability of photometric information is a major advantage, providing complementary data in specific cases when the 3-D information is useless (detection of sealed cracks, patching, etc.).
5. the sensor is solid-state without moving parts, providing a very rugged solution. This is of primary importance in this kind of application and environment.
3. Design and Implementation
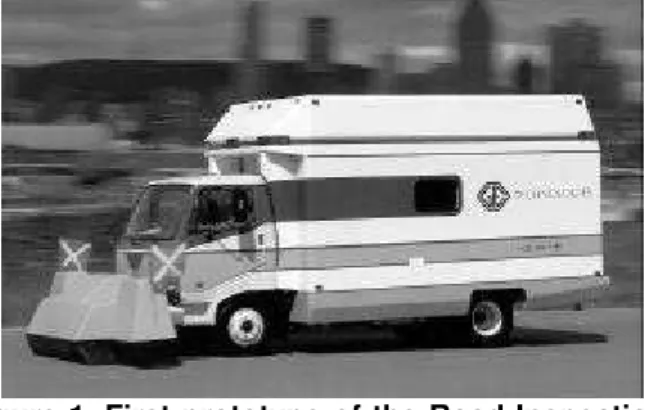
Figure 1 shows the vehicle which has been equipped with six Biris sensors and the necessary data acquisition and processing equipment to extract, at normal highway
speed, the parameters of interest describing the road conditions: cracks pattern, rut depth, and longitudinal profiles in the wheel paths. The design criteria for the data acquisition system were:
• a unique data collection technology for the surface distress parameters,
• 3-D (range) and 2-D (photometric) information provided by the same sensor array,
• high accuracy, dynamic range, and acquisition speed,
• solid state technology (no moving parts),
• multiple configuration capabilities,
• high speed data communication and processing capabilities.
Figure 1. First prototype of the Road Inspection Vehicle
A preliminary evaluation showed that road sampling at every 11 cm in the traveling direction and continuous sampling in the wheel paths should provide enough information for the parameters under investigation. This conclusion led to the development of an enhanced Biris sensor that incorporates three laser plane projectors (instead of only one) simultaneously projected on the inspected surface. The laser planes are stationary with respect to the camera/vehicle and are generated using infrared (λ=790 nm) laser diodes. The fan angle of each laser beam is 52° providing an intersection length with the inspected surface of approximately 90 cm at a nominal distance of 90 cm. Fine tuning of the fan angle of each laser beam permits the adjustment of the projection length on the inspected surface.
In the field of view of the detector, the three laser projections appear as three parallel lines spaced 11 cm at the nominal distance of 90 cm. The position and the spacing of the three laser lines in the field of view of the detector, at the inspected surface level, can be adjusted by modifying the orientation of the laser projectors with respect to the optical axis of the camera. Due to the Biris
mask, each of the three laser lines is seen by the CCD detector as a pair of lines whose separation and position vary with the relative distance between the Biris sensor and the inspected surface. These variations are measured and the optical distortions and sensor geometry calibrated, in real-time, to provide the range information. Photometric data is obtained by measuring the amount of laser light reflected by the road surface back on the CCD. A schematic layout of the sensor geometry is given in Figure 2. Figure 3 shows two of the six sensor heads mounted on the vehicle of Figure 1. Table 1 and 2 summarize the characteristics of the optical heads and system developed for this application.
Inspected surface Sensor field of view Laser planes Biris
Figure 2: Enhanced Biris sensor with three laser planes
Figure 3. Two of the sensor heads mounted on the vehicle of Figure 1
Because three laser beams are simultaneously projected on the surveyed surface, at a nominal speed of
72 km/h or 20 m/s and a sampling frequency of 60 Hz per video images, the collected pattern will be formed by parallel profiles of the road equally spaced by 11 cm. At higher speeds the relative distance between consecutive sets of three profiles increases and consequently a slightly lower density image will be collected. Even though the image sampling will not be perfectly uniform (regular) at higher vehicle speed, it is however not at all a problem for this type of application. At speeds lower than 72 km/h, real-time monitoring of the vehicle speed by the system controller removes the redundancy in the data collection and avoid an overlap of the profiles. This approach ensures there is no minimum speed for the data collection vehicle.
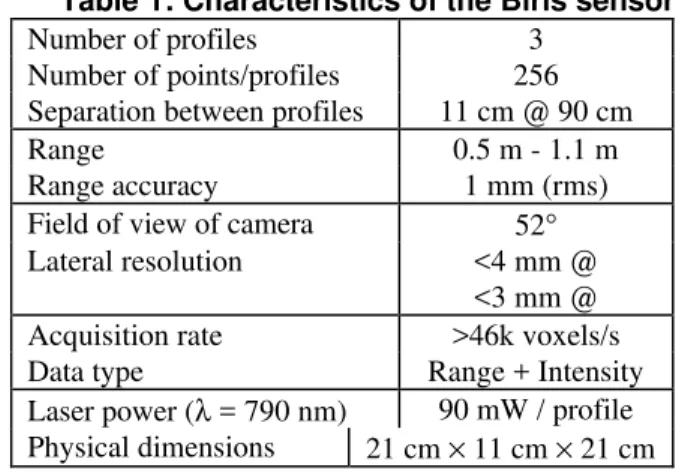
Table 1: Characteristics of the Biris sensor
Number of profiles 3
Number of points/profiles 256
Separation between profiles 11 cm @ 90 cm
Range 0.5 m - 1.1 m
Range accuracy 1 mm (rms)
Field of view of camera 52°
Lateral resolution <4 mm @
<3 mm @
Acquisition rate >46k voxels/s
Data type Range + Intensity
Laser power (λ = 790 nm) 90 mW / profile Physical dimensions 21 cm × 11 cm × 21 cm
Table 2: Characteristics of the system
Longitudinal Transversal
Number of cameras 2 4
Nominal range 60 cm 90 cm
Profile resolution < 3 mm < 4 mm
Range accuracy 1 mm 1 mm
Total data rate 1.6 MB / s
Vehicle speed 72 km / h
The blurring of the image of the inspected surface created by integrating the laser light on the CCD while the vehicle is in motion is minimized by controlling the Electronic Shutter Speed of the camera. The high speed electronic shutter control of the camera eliminates any potential overlap between successive 3-D profiles and reduces the blur created by the motion of the vehicle. The shutter speed of this first prototype varied between 1/500 to 1/1000 s depending on the surface under inspection. To increase the detection accuracy, a new generation of 3-D sensor is currently being designed. Shutter speeds between 1/4000 to 1/10000 s should be obtained providing <5 mm of blurring at 72 km/h. The main
improvements were the increase of the laser power as well as a more uniform laser power distribution along the projected line, as opposed to a Gaussian distribution.
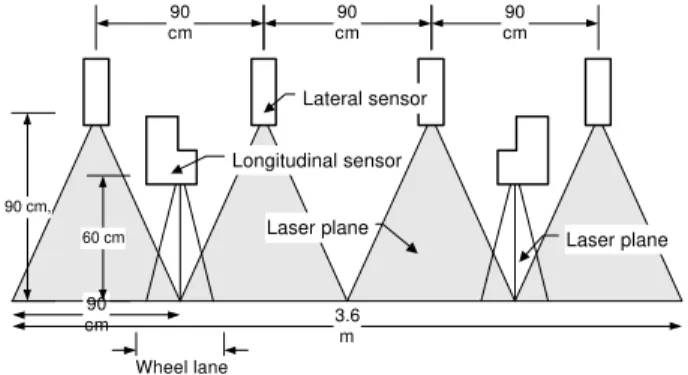
The full transversal profiles for a lane width of 3.6 m are collected by four sensors. These four sensors are currently positioned at a height of 90 cm and are used for longitudinal crack detection, rut depth measurement and cross section analysis of the road. Each lane profile is acquired with a total resolution of 1024 points (256 points per sensor-profile) which corresponds to 3.5 mm of transversal resolution. The longitudinal profiles are collected in both wheel paths by two sensors closer to the road surface (60 cm) providing a total of six profiles of 256 points each with a resolution better than 3 mm. They are used for transverse crack detection and longitudinal profile retrieving. Range resolution (elevation) better than 1 mm are obtained. The configuration of the sensors on the vehicle and the foot prints of the laser profiles on the surface under inspection are shown in Figures 4 and 5 respectively. This acquisition geometry and the number of sensors can be adapted to meet various specific requirements. 90 cm 90 cm 90 cm 90 cm 3.6m Wheel lane 90 cm, 60 cm Lateral sensor Longitudinal sensor Laser plane Laser plane
Figure 4. Positioning of the sensors on the vehicle 170 cm 90 cm 3.6 m 49 cm 33 cm Lateral fields of view
Longitudinal fields of view
Figure 5. Configuration of the sensors/laser profiles on the surface of the road (top view)
A global spatial reference information is provided that includes the distance traveled and the geographic coordinates in perfect registration with the surface distress data. An optical encoder mounted on the vehicle's drive shaft coupled with a plug-in digital card gives the distance measurements, and a Global Positioning System (GPS) receiver card provides the geographic coordinates of the vehicle. Direct links with the computer allows real-time fast information exchange between the different data gathering modules. The same principle is adopted to integrate the road geometry data collection module which consists of inclinometers that monitor the road gradient and crossfall. All these parameters are continuously monitored and stored along the spatial reference information and the surface distress data.
4. Automation and real-time signal
processing
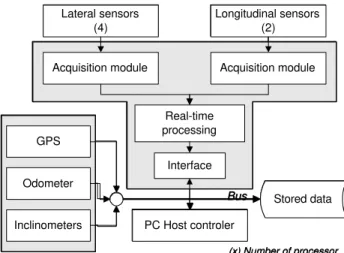
Complete automation of data acquisition and analysis is one of the key features of this system. Due to the huge amount of data collected (1.6 MB/s), real-time processing becomes a necessity in order to avoid problems of storage, speed, and data retrieval. Both automation and real-time processing require important computing resources, so the adopted solution was a parallel processing architecture array of Digital Signal Processors (DSP). This approach ensures the flexibility of an open architecture as well as the real-time processing capabilities and the possibility of expansion to meet new processing requirements. Obviously the DSP array configuration has evolved along with the application. The possibility to add processing modules and communication links as the application demands increase has proven to be very helpful. Figure 6 shows a simplified description of the parallel processing array. The host computer (PC) is used for storage purposes and for acquiring additional information such as the traveled distance, global positioning of the vehicle, inertial data, etc.
Lateral sensors (4) Interface Acquisition module (2) Event detection (?) Acquisition module (1) PC Host controler Longitudinal sensors (2) GPS Odometer Inclinometer s Stored data Bus (x) Number of processor Lateral sensors (4) Interface Acquisition module Real-time processing Acquisition module PC Host controler Longitudinal sensors (2) GPS Odometer Inclinometers Stored data Bus (x) Number of processor
Figure 6. Processing architecture
The 3-D pavement inspection application is running on the DSP array. The profiles from different sensors are sewed, filtered and corrected for roll and pitch of the vehicle. Each acquired road profile is processed in real-time and every event detected (e.g. cracks) is stored with its characteristics: position, width, and depth. A variable amount of data is archived depending on the distress level of the inspected surface. Filtered profiles are averaged, based on the vehicle speed and stored for further analysis of the rutting profile for sections of the road specified by the user.
At post processing level, the stored events are analyzed to extract and classify each type of defect according to pre-established criteria [6]. This procedure allows event detection, crack pattern classification, and rut amplitude monitoring in a standard recognized format. Both crack and rut data also allow a graphical reconstruction of 3-D images of specified road sections.
The acquired longitudinal profiles are corrected for the vehicle attitude. The overlap between successive acquisitions permits fine auto-correction of the vibrations induced by the vehicle and the creation of accurate pseudo-profiles. Based on these pseudo-profiles the roughness index IRI of the road is computed.
The acquired photometric data are only compressed and stored because there is no actual need for a real-time correction of acquired intensity profiles. During post processing, the stored profiles are pasted together in large images of user specified sizes and automatically processed for shape recognition of large defects such as alligator cracks, fatigue cracks, etc. The same images are
also used to detect sealed cracks, patching, and reflectivity of pavement markings.
Calibration of the sensor array relatives to the vehicle is of primary importance. Because the position of each sensor can be independently adjusted and the vehicle itself has a random attitude that depends on characteristics such as load, suspension system, tire pressure, etc., it is obvious that it is impossible to precisely predict the position of each camera. The whole system must therefore be calibrated and consequently taught of the position of an horizontal reference surface. The procedure employs a water plane in a single recipient positioned in the field of view of all sensors. Some fine grind powder is spread over the water to provide a Lambertian diffusing surface. The water plane being obviously horizontal, the angular positions of each sensor are computed and subsequently used in the real-time processing DSP array for vehicle attitude correction.
5. Results
Several experiments were conducted to validate the concept and its implementation. The efforts were concentrated on the main parameters of interest: crack pattern, rut depth, and surface roughness. With a range resolution of 1 mm and a transverse resolution of 3 mm, the aimed levels of distress severity were medium and high. Even if some low severity defects were detected, repeatability for this category was poor due to resolution.
Assessing the performances of a multiple feature extraction technology is a difficult task. Each investigated parameter has its definitions and measurement methods. A calibrated section of a road of 100 m was chosen to ensure the highest possible level of accuracy for the human ratters. Even between the best experts, there are differences of up-to 15% of the surface distress surveyed by two different experts. These differences tend to be more important when long road sections are evaluated.
On the calibrated road section of 100 m, the level of detected defaults was 95% for transverse cracks and 93% for the longitudinal ones. Because the transverse cracks are counted and stored with their severity level, the detection percentage refers to the number of detected cracks compared to the existing one. For the longitudinal cracks, the evaluation criteria is the detected length of the defect. The measured level of 93% shows that only 7% of the length of the crack was undetected.
The repeatability tests provide almost identical results. The differences observed were due mainly to the errors in the positioning of the vehicle rather than the acquisition system itself.
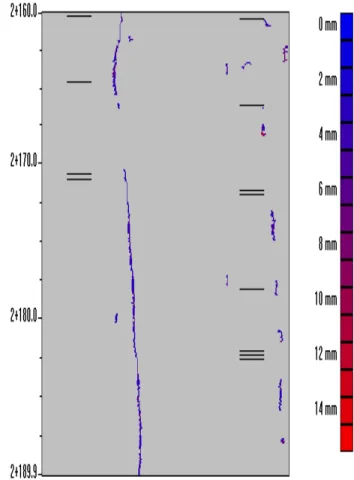
Figure 7 shows a cracks pattern as retrieved by the system. The image represents a 30 m road section. A longitudinal crack is identified along with several transversal cracks. The transverse cracks are represented by transversal segments on the image. A transversal crack, as opposed to local defects, is assumed to cover the whole lane width only when it is detected by both longitudinal sensors.
The tests conducted for rut depth measurements gave the same values as manual measurements. It was found that in this case the sampling frequency was larger than was actually needed and therefore can be reduced without affecting the accuracy.
Measurements of the roughness have provided a correlation factor of 85% when compared with a manual method. This correlation can be explained from the fact that the IRI index applies to a particular wheel path along the road and is therefore very subjective to the person (or driver) responsible for measuring the profile who must have a clear idea of where the wheel path is located in the lane.
Figure 7. Results of road defects detection
6. Discussion
The lack of accurate and reliable standard evaluation procedures and the huge gap between the high technology data acquisition systems and the one currently in use tend to make very difficult the assessment process. Therefore the success rate of 93-95% for cracks and 85% for roughness (IRI) compares very advantageously to current practice (variations of 15%).
The main advantage of this 3-D technology lies in the multiple feature extraction method. The introduction of 3-D surveying in pavement management has opened new possibilities. With such an approach, one can compute the quantities of material needed to correct road rutting or to repair cracked pavements. Another important advantage is due to the time savings provided by the real-time processing of the data. Because the duration of the data interpretation is about the same as the acquisition,
there is no need for road specialists or managers to wait days or even weeks before obtaining the results.
The use of photometric information has extended the multiple feature extraction goal beyond expectations with pavement markings reflectivity measurements. Further developments should enlarge the sensor capabilities to other parameters such as deflection and texture.
The current system still has some limitations. One of the most important is linked to the fact that 3-D measurement technology is "blind" when surface defects are filled (sand, mud, water, etc.), although in some situations this can be partially compensated by the photometric information stored by the system. A second limitation is introduced, at the detection level, by the current resolution of the sensors array which is currently limited to 1024 points per cross-section profile of the road. This reduces the system efficiency to detect low distress level (defects opening <3 mm). Although the actual resolution is far ahead of competitive systems (usually limited to resolution of several cm), we are studying different scenarios to improve the overall system performances, from increasing the number of heads to new configurations.
7. Conclusion
In this paper, an automated 3-D range sensor array based data acquisition and analysis system for pavement inspection was presented. The Biris sensors array along with the parallel processing system architecture developed for this application provide reliable range and photometric data that are processed in real-time and stored as events to minimize the storage requirements. Post-processing events retrieval and automatic analysis of the information allow defects recognition and classification. Both acquisition and interpretation of the data are fully automated and objective
It has been demonstrated that the use of multiple features data extraction methods based on a single technology is of major importance in terms of reliability, versatility, data registration and analysis, and costs. The high resolution of the system ensures detection and identification of most major types of pavement defects.
8. Acknowledgments
The complete and continuous support from Jacques Domey and Mario Lecavalier from the NRC, and Charles Abikhzer, Fawzi Hassaine, Alain Lardique, and Mihaela Bursanescu from GIE, has made possible the design of this new generation of rugged sensors and the development of the data acquisition processing system.
9. References
1. F.Blais, J.-A. Beraldin, L.Cournoyer, J.Domey, M.Rioux, D.Gingras, J.Laurent, “Three-dimensional Pavement Inspection using a Laser Range Sensor”, 1992 TAC Annual Conference, Quebec City, Canada, p. A93-A104
2. Laser RST Road Surface Tester, Technical literature, Swedish Road and Traffic Research Institute, Sweden.
3. Blais F., Rioux M., Biris: a Simple 3-D Sensor, SPIE Vol. 728, 235-242 (1986).
4. Blais, F., M.Lecavalier, J. Bisson, “Real-time Processing and Validation of Optical Ranging in a Cluttered Environment”, ICSPAT 1996, Oct. 7-10, Boston MA, p.1066-1070.
5. Blais F., Rioux M., Beraldin J.A., Practical considerations for a design of a high precision 3-D laser scanner system, SPIE Vol. 959, 225-246, (1988).
6. Durand, J.M., Manuel d'identification des dégradations des chaussées flexibles, MTQ, (1993).