HAL Id: hal-03004368
https://hal.archives-ouvertes.fr/hal-03004368
Preprint submitted on 13 Nov 2020
HAL is a multi-disciplinary open access archive for the deposit and dissemination of sci-entific research documents, whether they are pub-lished or not. The documents may come from teaching and research institutions in France or abroad, or from public or private research centers.
L’archive ouverte pluridisciplinaire HAL, est destinée au dépôt et à la diffusion de documents scientifiques de niveau recherche, publiés ou non, émanant des établissements d’enseignement et de recherche français ou étrangers, des laboratoires publics ou privés.
A Dashboard for Trade Policy Diagnostics
Jaime de Melo
To cite this version:
fondation pour les études et recherches sur le développement international
LA FERDI EST UNE FOND
ATION REC ONNUE D ’UTILITÉ PUBLIQUE . ELLE ME T EN ŒUVRE A VEC L ’IDDRI L ’INITIA TIVE POUR LE DÉ VEL OPPEMENT E
T LA GOUVERNANCE MONDIALE (IDGM).
ELLE C
OORDONNE LE LABEX IDGM+ QUI L
’ASSOCIE A U CERDI E T À L ’IDDRI. CE TTE PUBLIC ATION A BÉNÉFICIÉ D ’UNE AIDE DE L ’É TA T FR ANC AIS GÉRÉE P AR L ’ANR A U TITRE DU PR OGR A MME «INVESTISSEMENT S D ’A VENIR» POR
TANT LA RÉFÉRENCE «ANR-10-LABX
-14-01».
Abstract
The set of measures that affect international trade in goods and services defines trade policy. Trade policies affect trade costs. “Good” trade policy seeks to minimize trade costs. Traditionally trade policy was restricted to measures imposed at the border (tariffs, import quotas, export taxes, subsidies). It is now recognized that trade costs extend beyond border measures to include “behind-the-border” measures (logistics, regulations). Trade costs also depend on the quality of the institutional environment (completeness of contracts and enforcement). This primer proposes elements of a “good trade policy” for an African country where the context is country-specific but where common geographical characteristics, common policies, and common market failures often prevail.
… /…
* Updated version of a paper commissioned by and prepared for the Africa Development Bank. I thank Ferdinand Bakoup, Olivier Cadot and Laurent
Wagner for comments on a draft.
A Dashboard for Trade Policy
Diagnostics*
Jaime de Melo
Jaime de Melo, University of Geneva and FERDI
De
velop
ment P
oli
cie
s
Wo
rking Paper
275
October“Sur quoi la fondera-t-il l’économie du monde qu’il veut
gouverner? Sera-ce sur le caprice de chaque particulier? Quelle
confusion! Sera-ce sur la justice? Il l’ignore.”
Based on the strong evidence that countries with more open trade policies have superior performance along several economic dimensions, it is assumed that the central objective of trade policy in Africa should be to reduce trade costs. For expository purposes, measures are classified into those aimed dismantling cost-raising policies--i.e. letting market work-- and those aiming at making markets work, i.e. those addressing ‘market failures’. The former policies (completing the negative agenda) release resources while the latter (the positive agenda) require expenditures and the allocation of scarce funds. Measures to be addressed at the level of the Regional Economic Communties (RECs) are listed separately.
A dashboard of indicators describing trade outcomes serves to identify policy measures. Elements for inclusion in trade policy packages will be country-specific, but likely to include:
Negative agenda:
(i) Raise the profitability of agricultural activities by reducing (and eventually removing) the bias against agriculture.
(ii) Widen the tax base by implementing an accompanying fiscal reform.
(iii) For renewable resources with ill-defined property rights, export controls can help conservation until improvements in the property-right regime.
(iv) To support emerging activities (i.e. infant-industry protection) design results-based measures (meeting market share targets in X years to benefit from support).
Positive Agenda:
(i) In the short-run, improving customs management as agreed by all WTO members in the TFA. (ii) Over the longer-run, improve the quality of domestic contracting institutions including the
activities and efficiency of TPOs
(iii) Evaluate, in view of developing, private trade institutions (fair-trade, voluntary standards, trading platforms)
Deepening integration along the RECs:
(i) Insure access to intermediate inputs at world prices by reducing external tariffs to 1-2-band tariff schedules), a sine qua non to participate in GVCs.
(ii) Emphasize deep integration by including services and other regulations in the negotiating agenda.
(iii) Carry out diagnostics at the REC level, an opportunity to monitor the application of decisions decided at the REC level.
Table of Contents
Glossary ... 3
1. The two trade policy agendas ... 4
2. Stylized setting and outcomes ... 5
3 A dashboard ... 6
4. Letting markets work: completing the ‘negative agenda’. ... 9
5. Tackling the ‘positive’ agenda. ... 12
6 Deepening integration along the Regional Economic Communities (RECs). ... 13
Annex 1: Main online data Sources ... 16
Annex 2 Sketch of trade Policy outcomes in an archetype African economy ... 18
Annex 3: Anatomy of bilateral Trade Costs... 22
Annex 4: Observations on Successful Growth ... 28
References ... 29
In support of claims ... 29
In support of outcome indicators and diagnostic tools... 37
List of Tables Table 1: Trade Outcomes indicators* ... 8
Table 2: Simulation tools for tariff analysis * ... 10
Table 3: Main Data sources for dashboard on Trade Outcomes * ... 16
Glossary
AFT Aid-for-Trade
AGOA American Growth Opportunity Act ((non-reciprocal preferences from the EU
to LDCs)
AVE Ad-valorem equivalent
BRICS Brazil, Russia, India, China, South Africa
BTB Behind-the-border (measures)
CGD Commission for Growth and Development
DB Doing Business (indicators of the World Bank)
EBA Everything-but-arms (non-reciprocal preferences from the EU to LDCs)
EPA Economic Partnership Agreement
ERP Effective Rate of Protection
EXPY Measure of the income content of a country’s export basket
GVC Global value chain
HS Harmonized System of tariff classification
ISO International Organization for Standardization
LPI Logistic Performance Index
MFN Most-favoured nation tariff
MRL Maximum residue limits (of pesticides in an agricultural product)
NTB Non-Tariff Barrier (e.g. a quota or quantitative restriction)
PRODY Outcome measure of a product’s technological sophistication
QR Quantitative restriction
REC Regional Economic Community
RFI Revealed Factor intensity
ROO Rule of origin (if met, gives access to market at a rate less than the MFN rate)
RTA Regional Trade Agreement (usually a preferential agreement)
S&D Special and Differential (Treatment)
SITC Standard international trade classification
SSA Sub-saharan Africa
STRI Services Trade Liberalization index
TPO Trade Promotion Organization
XHG High-sophistication exports
XLS Low-sophistication exports
Trade Policies for African countries: A Primer
The set of measures that affect international trade in goods and services defines trade policy. Trade policies affect trade costs. Until recently, trade policies were defined to include the array of measures imposed at the border (tariffs, import quotas, export taxes, subsidies). Trade costs extend beyond border measures to include ‘behind-the-border’ measures
(logistics, regulations). Trade costs also depend on the quality of the institutional
environment (completeness of contracts and enforcement). The primary objective of trade policy is to minimize trade costs. A ‘good’ trade policy is a configuration of policies, measures and institutional environment that results in low trade costs.
1. The two trade policy agendas
Countries with more open trade policies grow faster and it is increasingly accepted that the causality runs from trade to growth. Until recently, ‘good trade policy’ was largely about dismantling cost-raising policies sometimes called a ‘negative agenda’ because it releases resources towards higher productivity activities. The negative agenda is about letting markets work. Success at reducing these cost-raising policy-imposed barriers (tariffs, red tape, non-tariff barriers to trade) leaves us with the more difficult-to-implement ‘positive agenda’. In contrast to the negative agenda, the positive agenda is about making markets work, i.e. about addressing ‘market failures’. 1 The positive agenda requires expenditures and the allocation of scarce funds. Tackling both agendas contributes to reduce trade costs that are high across African countries 2
The audience for this ‘primer’ is primarily for economists and students working on trade policy diagnostics. It brings together elements of a ‘good trade policy’ for an African country where the context is country-specific but where common geographical characteristics, common policies, and common market failures often prevail. In considering these elements, one should keep in mind that successes have relied on different strategies. To cover
maximum ground while saving pace, recommendations are presented in the form of claims with an annotated bibliography summarizing evidence mentioned in the text and that support the claims.
Simplifying to the essentials, I take the position that the central objective for trade policy in Africa is to reduce these high trade costs (see the description in table 4). Reducing trade distortions will help exploit comparative advantage in agricultural products and
1 Sources of market failure are wide-ranging (provision of public goods like hard infrastructure, quality of governance for property rights and contract enforcement, setting up standards necessary for access to partners’ markets). See below for indicators of logistic markets and governance.
2 It is the increasing awareness that trade costs are high in developing countries that led to the Aid-for-Trade (AFT) initiative in 2005 and later to the Trade Facilitation Agreement (TFA) signed in 2013 and effective since early 2017.
manufactures but addressing market failures with the positive agenda is also essential to the success of a trade policy package. This positive agenda includes an improvement in the functioning of logistic markets and behind-the-border (BTB) policies. Two important
elements of a desirable trade policy package are not covered here. Tourism is not covered, neither is trade in services in spite of the rising complementarity of trade in services with trade in goods, especially in value chains. 3
Section 2 describes a ‘typical’ setting and a ‘typical’ outcome. Section 3 describes elements that would be included in a dashboard identifying the trade outcomes that would serve as a basis for a ‘typical’ trade policy diagnosis. Section 4 covers the negative agenda, i.e.
removing the policy-imposed barriers to trade, mostly measures at the border. Section 5 moves on to the positive agenda: identifying market failures and suggesting remedies, a much harder task than the negative agenda. Trade policy built around regional integration holds promise for Africa but it is still very much a work in progress. It deserves support: on political economy grounds (an exchange of market access is easier to sell than a unilateral reduction in trade barriers and efforts at regional integration is a way to build trust); and for dealing with cross border externalities. It is covered in section 6.
Annex 1 lists data sources for the trade outcome measures in the dashboard. Annex 2 sketches the setting in which trade policy takes place in Africa, distinguishing the effects of trade reforms in sectors that approximate perfect competition from those where market failures are prevalent. Annex 3 describes elements of trade costs in the home country at the border, behind-the-border (BTB) and abroad. Annex 4 lists general principles of successful growth from the Commission for Growth and Development and evidence on the channels through which increases in productivity take place. It serves as a reminder that there is no ‘one size fits all’ when it comes to designing a sound trade policy.
2. Stylized setting and outcomes Setting
• Cross-country estimates and case studies give considerable evidence in support of the view that trade liberalization raises average incomes but has context-specific effects on poverty[46],[34].
• Export baskets are concentrated in primary products and minerals. Narrow-base
export baskets (oil and minerals and some perennial crops) have been associated with weak governance [29].
• The tax base is narrow with a shortage of alternatives to trade taxes as a source of government revenue [9].
3 The development of tourism will be part of trade policy and potentially an important creator of jobs and foreign exchange earnings. It is not dealt with here, except indirectly as regulatory policies that reduce transport and communication costs for trade in goods and services also benefit tourism. Services are not covered because data sets on services, mostly from balance-of-payments statistics, are incomplete and do not cover the different categories of services. Indicators of the restrictiveness of trade in services are available on a cross-section basis from the World Bank (STRI index) and the OECD regulatory services index (also STRI index).
• Agriculture is still taxed more heavily in Africa than in other regions (directly through export taxes and indirectly through protection of manufacturing) [3].
• At the WTO, African countries still have policy space in formulating their tariff policy (when bound, tariffs are bound at levels well above applied levels) [15].
• African countries have high trade costs, on average several times higher than in highincome countries. (see annex 3 and [4])
• Access to markets in high-income countries is no longer about obtaining tariff preferences but about meeting the increasingly complex technical requirements resulting from Non-Tariff Measures (NTMs) in these markets (see annex 2 and [58]). Outcomes
• The trade regime is biased against exporting activities (trade policy incentives favour import-competing activities at the expense of export activities). Protection of
downstream industries through export taxes on upstream raw commodities and tariff protection of downstream industries is common. Effective rates of protection (ERPs) are still high. ERPs display high variance within and across countries, an indication of resource misallocation.4 This high dispersion in ERPS is a remnant of an
industrialization strategy based on import-substitution.5
• African countries have generally high trade costs according to several indicators from the World Bank Doing Business (DB) data base [D8,D9] and according to predictions from gravity model estimates (see figure 1 in annex 3).
• Progress at regional integration along the Abuja Road Map that established 8
Regional Economic Communities (RECs) has been slow. Integration has concentrated on an exchange of market access through preferential reductions in tariffs (at the expense of outsiders) with substantial other barriers to trade (formal, informal and BTB) still in place [39] [41].
3 A dashboard
In Zonga, the archetypical African economy described in Annex 1, the challenge facing trade policy is what levers to activate to increase export volumes and expand the narrow set of exportable goods (the intensive and extensive margins of trade). This requires reducing the components of trade costs:
a) Restrictive trade policies at home and in partner trade policies
4 The ERP recognizes that a tariff on an input is a tax on the output. If intermediate purchases of fiber is 20% of clothing costs, clothing has a 40% nominal tariff while fiber has a 20% tariff, and if the value-added in clothing is 30% evaluated at world prices, then the ERP for clothing is ERP=(40%-4%)/0.3=120%. Final processed goods with low value-added have high ERPs (if fiber were the only purchases of clothing, the ERP=45%). Likewise, an export tax on raw hides is a subsidy to downstream activities (tanneries and leather products).
5 The hallmark of the export-led growth of East Asian countries in the 1970s and 1980s was a trade regime favourable to all tradable activities that avoided a bias against exports as tariffs on selected industries were complemented with incentives to exports (direct subsidies, credit at preferential rates, tax holidays, etc…) all conditional on meeting sales targets in world markets.
b) other impediments at the border (red tape, lack of transparency customs management and operations);
c) A host of BTB measures (absence or poorly designed regulatory measures)
resulting in poorly functioning logistics markets.
d) Addressing market failures (information failures, hold-up problems) resulting in underinvesting in new products or new markets)
These components are interlinked (the efficacy of trade policies may be complementary with regulatory policies—see [16]) and their effects are context specific. Because there are many indicators of trade costs, a selection must be made—hence the ‘dashboard’ title to indicate these choices. Before embarking on building a dashboard recall that the success of a trade strategy depends on factors beyond trade policies (annex 4 lists elements of successful growth).
Table 1 lists indicators of trade outcomes to go in a dashboard (dashboards will have some country specificity). The first, and crucial, step is to decide on suitable comparators.
Comparisons can be bilateral (Burundi and Rwanda, Burkina Faso and Mali) or across a group of countries sharing characteristics along several dimensions (size, geography, endowments, belonging to a same Regional Trade Agreement (RTA)).6 Comparisons need not always be among African countries (Nigeria vs. Indonesia, Uruguay vs. Mauritius). Comparisons may focus on a case study (comparison of the copper or wood sectors across two or more countries) and may include an historical perspective. A convincing set of comparators provide support to the diagnosis.
The second step is to select outcome indicators, of which there is a plethora, many giving the same information. Table 1 takes a half-dozen indicators from two toolkits available online. Reis and Farole (2012) [D5] present an exhaustive manual to conduct what they call a Trade Competitiveness diagnostic. The approach is to use all available data. The toolkit is in three modules. Module 1 covers outcome analysis. Module 2 covers competiveness— here summarized as trade costs (annex 3). Module 3 present policy options and case studies. The toolkit is exhaustive with a plethora of indicators, often beyond data availabilities in Africa (and beyond the time to be allocated to a trade diagnostic).
The other toolkit is WTO (2011)[D12]. It focusses on quantifying aspects (especially tariffs) of the negative agenda. It presents tools to describe, synthesize and quantify the distortionary costs associated with tariffs (partial and general equilibrium simulations, distributional effects of trade policies from household surveys). This toolkit is the preferred reference to estimate the effects of changing trade policies at the border (tariffs, export taxes, NTMs). The guide also lists the STATA do files for the formulas used to estimate the distortionary costs of these policies. It describes in some detail how to use the simulation tools. 6 The comparator group may be readily available (low-income, landlocked, other exporters of a similar commodity/sector, e.g. coffee or textiles and apparel (T&A). In their appraisal of Nigeria’s trade performance, [30a] defined comparator groups along four criteria (each criterion giving rise to a different control group of several countries): (i) Endowments; (ii); population; (iii) oil; (iv) point-source natural resource exporters defined in [24].
Return to table 1. Except for item g) which requires some data manipulation, all indicators can be obtained and downloaded from the corresponding online data bases (see annex 1).
Table 1: Trade Outcomes indicators* STEP #1 Select Comparator countries
STEP #2 Select indicators a) Terms-of trade
b) Trend in exports and imports (aggregate and by broad categories) c) Export composition/concentration (share of top3 to 5 exports)
d) Revealed Comparative Advantage (RCA); trade complementarity index (TCI); unit values (indicator of quality); survival analysis
e) Product space analysis
f) Indicators of trade costs (tariffs and NTMs at the border and a selection from other indicators from those listed in annex 1)
g) Actual vs. predicted trade from regression analysis * Adapted from [D5,module 1] and [D10, chp.1]
Comments on the indicators below (numbering corresponds to the list in step#2) a) Evolution of an index of the terms-of-trade is an important indicator of the external
environment and of the purchasing power of the country’s export baskets. b) Time trends on exports and imports (semi-log scale). Broad categories of
sectors/products. Consider graphing shares of parts and components in manufacturing exports and imports. 7. Plots of export shares against destinations at the aggregate level and by main products. 8
c) Indices of concentration of exports and the change in rankings of the top 10 exports (say over a 10-year period) to see how much churning takes place [13 and D7].
d) RCAs measure competitiveness across products (reflects macro and trade policies as well as differences in technology and factor endowments). TCI measures the correlation between a country’s exports to the world and another country’s imports from the world. A high TCI value occurs when a country’ comparative advantage is in products in which the partner has a comparative disadvantage. Classifying exported goods by technological sophistication (see the Atlas of economic complexity in table 3) and by unit value within disaggregated HS categories (HS2 or HS4) have been used as a proxy for the ability to produce the goods produced by high-income countries. Survival analysis show systematically low survival rates.
7 The two main classifications are the Harmonized system (HS) and the Standard International Trade Classification (SITC). See [D5, module 1, annex A] for the mapping of products into 2-digit classifications. 8 The ITC TradeMap software has bubble graphs that depict the evolution of market shares for a country’s main products.
e) The objective is to figure out which products are likely to be the next to move up on the ladder of comparative advantage [see 24, 28].8 Goods are classified according to their technological complexity or their proximity in product space [28]. This is a daunting task and it is not clear how to interpret the results (China exporting the i-pod). 9
f) UNCTAD, WTO and World Bank outcome indicators of trade costs (Doing Business(DB) , Logistics Performance Index (LPI), World Governance Indicators (WGI) are available for almost all African countries. Significant changes in indicator values over a 5-year interval could signal further scrutiny.
g) Actual and predicted trade openness from a regression of trade T/GDP over GDP per capita and geographical characteristics (remoteness, landlocked, etc..). Actual vs.
predicted bilateral trade from a gravity model. Both estimates serve as a benchmark of a country’ trade patterns.
The toolkits give examples of the use of these outcome indicators to infer the performance of a country’s trade policy. For example, in g), having controlled for geographical
characteristics, a country with a low trade openness ratio is likely to have high trade costs. The next steps involve completing the negative agenda and tackling the positive agenda. For the negative agenda, the main challenges are the political-economy constraints that limit the options to remove the policy-imposed barriers to trade since this involves taking away rents (see annex 2). For the positive agenda, the challenge is deciding where to spend money to reduce trade costs (i.e. on which component of trade costs the payoff to expenditures are likely to be highest (annex 3 figure 1 gives a classification of these costs).
4. Letting markets work: completing the ‘negative agenda’.
Completing the negative agenda involves tariff reforms and the streamlining of NTMs that create distortions (i.e. removing non-tariff barriers (NTBs). 10 Annex 2 describes the effects of measures of protection in a typical African setting. Detecting when NTMs are NTBs and quantifying their effects is far more difficult than dealing with tariffs because NTMs are opaque making their intent difficult to detect. More information on NTBs must be high on the agenda for data collection across Africa.11
8 [D7, table 3.1] shows the fragility of the EXPY (an indicator of the sophistication of a country’s export basket) as a predictor of future growth.
9 Measures of the export sophistication of a country’s export basket are available from the atlas of complexity (see the link in annex 1), a user-friendly visual tool to classify exports according to their RCAs and to identify paths to diversification. See [25] for an application to Rwanda and [26] for an application to Uganda and [D7] for a critique of the predictive power of future export baskets. See [50] for a theory-based alternative to complexity-based measures to those proposed in [28].
10 Non-tariff measures (NTMs) is now the preferred name given to what was previously called NTBs. This is because often these measures are addressing a market failure (i.e. a lack of information on the characteristics of a product) in which case they are helping markets function better. See [D3] and [57].
11 An annual report of the Observatoire des pratiques anormales of WAEMU gives information on NTBs (number of controls, illicit payments) along the main road corridors. Similar information is gathered by the EAC.
Evidence on the outcomes of trade policies summarized in annex 2 supports the following measures. Importantly it also notes the difficulty of implementing these measures in the African context (political economy of trade policy formulation heavily biased towards the urban elite and at the regional level across the RECs towards the economically more powerful countries that are more protectionist):
(i) As emphasized in the AfDB agenda, the highest priority should be given to make
agriculture-based activities more profitable. This calls for reducing (and eventually removing) the bias against agriculture by eliminating export taxes and by reducing protection for manufactures.
(ii) Widen the tax base by implementing an accompanying fiscal reform.
(iii) For renewable resources with ill-defined property rights, export controls can help conservation until improvements in the property-right regime.
(iv) Weak governance makes it difficult to support emerging activities (i.e. infantindustry protection). Look for implementation of results-based measures (meeting market share targets in X years).
Several freely available tools are available to describe and track the evolution of trade volumes and tariffs at the HS-6 product level. Detailed comparative tables of applied and bound tariffs are available from the WTO and the ITC websites (see annex 1 ).
Table 2 lists the tools to quantify the effects of tariff reform (unilateral, regional or
multilateral) on trade flows, government revenue and welfare. All are partial equilibrium models of supply-demand under perfect competition. The focus is on changes in the demand side following from a tariff reform. Domestically produced goods and competing imports are assumed to be imperfect substitutes in consumption (bananas from Cameroon are different from bananas Costa Rica) and they do not account for supply response. This assumption is convenient because it allows for two-way trade and prevents extreme specialization, but it under-estimates effects at the micro level (if there are only two shoe factories in the country, a reduction in tariffs on shoe imports could lead to a shutdown of the shoe industry).
Table 2: Simulation tools for tariff analysis * TRADESIFT: A tool to analyse trade policy issues with user supplied data. SMART: Two-step bilateral partial equilibrium simulation
GSIM (Global Simulation Analysis of industry-level trade policy): Market clearing for industry is at the world level
TRIST: (Tariff Reform Impact Simulation Tool) Uses customs data for tariffs rather than statutory tariffs to estimate the effects of tariff reform on government revenue. * Chapter 4 in the WTO toolkit [D10] describes the assumptions across these tools Estimates of tariff reforms using the tools listed in table 2 capture the important
the variance of tariffs across sectors. 12. TRADESIFT works with user-supplied data. TRIST works with customs data. Tariff rates are calculated directly from transactions in customs so they take into account tariff exceptions. TRIST gives a more accurate estimate of the effects of tariff reform on government revenue. These tools deliver orders of magnitude of tariff reforms to be included in a toolkit. See the section in support of outcome indicators and diagnostic tools in the references for details.
The tools listed in table 2 give ex-ante ‘first-order’ estimates of changes in applied tariffs. Because they rely on few elasticities provided by the user, they are easily implementable across countries for many sectors. The supply side adjusts to changes in demand resulting from changes in tariffs. These tools do not take into account input-output linkages when estimating the effects of a change in tariffs. For example, consider the EAC that is currently considering a change in its Common External Tariff (CET) regime for 2018. In the case of the leather industry, options under consideration include changing the current tax of 35% on exports of raw hides and skins and the tariff (25%) on accessories used in leather products. Taking into input-output linkages along the leather industry is necessary to get a first-order estimate of the proposed changes. 13
Since tariff reforms typically involve a significant portion of the tariff structure, a first-order estimate should take into account inter-industry linkages. For supply chains that increasingly involve two-way trade in parts and components, full-fledged case studies would be
necessary to get a first-order estimate of the effects of proposed tariff reforms. 14. The likely outcome is a recommendation that tariffs on all intermediates should be removed.
Importantly, these tools do not recognize that market structure is endogenous to changes in trade policy (protection may induce scale-efficiency gains if firm entry is controlled, but protection also gives market power to domestic firms). These second-order effects of tariff reforms on market structure discussed in annex 2 are important to keep in mind when discussing estimates of the efficiency effects of tariff reforms and other barriers in the negative agenda.
12 See [D10] chapter 4 for a detailed presentation of the models and applications..
13 Currently, the incentive system in the leather industry in Ghana is tilted towards tanneries (ERP =28%, NRP=10%) and especially towards leather products (ERP= 58%, NRP=25%). Removing the export tax (35%) on raw hides and skins would penalize the tannery and leather products segments, an effect that would not be captured by the simulation tools in table 2. See the estimates in the annex to Shepherd, Melo and Sen (2017)
Reform of the EAC Common External Tariff: Evidence from Trade Costs”
https://www.theigc.org/wpcontent/uploads/2017/11/Sheperd-et-al-2017-policy-paper1.pdf.
14 [12] documents that, over the past two decades, Africa is the region that has participated the least in GVCs. See [20] for African case studies.
5. Tackling the ‘positive’ agenda.
Reducing distortions at the border caused by high and variable tariffs and the more-difficultto-measure NTBs is the first pillar of a sound trade policy. It is also the most visible component of trade costs. Other elements of a comprehensive list of trade costs are described in annex 3, figure 1. Some elements like ‘soft infrastructure (1) (the numbers in parenthesis refer to trade cost items in figure 1) belong to the negative agenda, but are covered here because they are not directly part of barriers at the border.
Accept the list in figure 1 as covering the main categories of trade costs that have been subject to some quantification and ask the question: how should one tackle reducing trade costs beyond those covered in the border measures in the negative agenda (tariffs and NTBs)? Paraphrasing the introduction to a recent evaluation of Aid-for-Trade [D2 ,p. 2], should resources be spent on customs management (7) or on transport (2)? In customs reforms should the emphasis be on computerizing processes or on setting up incentives for integrity? In transport, should the effort go towards containerising ports or on improving inland links? If enhancing the ability of firms to export is the objective, should the effort go towards financing TPO activities (4), or should the effort go towards improving the business environment by improving the ‘soft infrastructure (1) or domestic contracting institutions (3)?
Answers to these questions have relied on impact evaluation studies where the trade-off has been between ‘external validity’ (i.e. the ability to draw general policy propositions from evaluation results) and ‘internal validity’ (i.e. the ability to identify impact effects net of confounding influences). Two examples summarize (and simplify), the more detailed discussion in annex 3.
Take first external validity. The typical estimate of trade costs to be reduced by trade (and other) reforms come gravity models estimated on aggregate bilateral trade flows often in cross-section (but preferably in panel where omitted variables are better accounted for). For example, data on transit times for 20’containers, suggest that a one-day reduction in inland travel times increases exports by 7 percent (equivalent to a 2 percentage point decrease in all importing-country tariffs) [17]. But which elements of travel time account for this estimate? Hard infrastructure (the quality of roads), road blocks and illicit payments, or regulations and if so which type? Another example with aggregate bilateral trade are the estimated benefits from improving the value of composite indices of trade costs from LPI and DB data. [47] estimate that cutting Ethiopia’s trade costs halfway to the level of Mauritius would be equivalent to a 7.6% cut in tariffs across all importers. But since all countries enter symmetrically in the estimated equation, no account is taken of the
characteristics of the bundle of exported goods across countries (e.g. the importance of XHS, XLS, and XNR goods in figure 1). How should one interpret a survey respondent’s score of 2 out of 5 on the ‘quality of trade and transport infrastructure’ when it comes to improving regulations?
Consider next internal validity. Take three often-cited anecdotal conjectures: that countries with better ‘institutions’ and countries that trade more grow faster; and that countries with better institutions also tend to trade more. We still lack convincing evidence from macro studies. By providing high ‘internal validity’, randomized experiments can help address the nexus. As an example, [5] offered randomly to a group of non-exporting rug firms in Egypt, the opportunity to export. Randomization coupled with good quantity-based productivity data allowed the authors to causally establish that exporting firms had higher profits and that they raised their productivity through exporting. But do these results generalize beyond the rug industry in Egypt and would results carry over from a similar experiment under a different institutional environment, or a different activity?
This trade-off between internal and external validity is inevitable for all the aspects of the positive agenda that require funding. This makes it difficult to draw lists of concrete, specific, measures to tackle this `positive’ agenda which are very context-specific. Annex 3
summarizes results from a few impact evaluation studies. Among those measures to be explored:
(iv) In the short-run, improving customs management as agreed by all WTO
members in the TFA.
(v) Over the longer-run, improve the quality of domestic contracting institutions including the activities and efficiency of TPOs
(vi) Evaluate, in view of developing, private trade institutions (fair-trade, voluntary standards, trading platforms)
6. Deepening integration along the Regional Economic Communities (RECs).
Deeper integration is on the AfDB’s list of top priorities. Since 1994, African countries have been engaged in regional integration along eight RECs with the objective of reaching an African Union through variable geometry. The potential gains from closer integration are large because of the great diversity across partners but policy coordination and scarce financial resources necessary for compensation among very heterogeneous partners have been lacking [39]. Lack of trust has impeded the establishment of supranational entities needed to carry out this integration. Integration along the RECs have followed the European ‘linear integration’ model: goods markets, labour and capital markets, and eventually monetary and fiscal integration. Behind-the-border measures aiming to reduce trade costs were largely ignored across the RECs until recently. While this is probably due to the difficulty in gaining the confidence necessary to get collection action started, many behindthe-border measures could still have been undertaken unilaterally. Integration under the RECs so far:
• Negotiations on the Tripartite FTA (TFTA) involving 26 countries are stuck raising the issue of breadth (large membership with shallow integration to break the tyranny of small markets) versus depth (small group-e.g. the EAC—to tackle the positive agenda and provide public goods15).
• Progress at integration has been slow. Eliminating tariffs and nontariff barriers has been—and often continues to be--particularly difficult [52]. Ten years on, intraregional trade among REC members has barely increased, an indication that regional trade costs have not fallen, at least relative to non-regional trade costs. (see annex 3 and [42]).
• Overly ambitious objectives to accommodate the heterogeneity of interests across members, political motives, and the uneven distribution of gains in the absence of compensation funds have trumped any quest for efficiency gains.
• The Common external tariff (CET) negotiated for the EAC and ECOWAS has favoured
the larger members (Kenya and Nigeria) and raised significantly the cost of living for poor households [38].
• These outcomes suggest the possibility of an implementation capability trap [42] Regional integration along the RECs has so far fallen short of expectations but has the potential to help African countries integrate the world economy. First by building trust that will help increase regional trade. Second, by participation in ‘value chains’ if there is a change in trade policies at the REC level.
The RECs continue to be built around an exchange of market access seeking to develop vertically integrated production chains on a regional basis rather than participating in the growth of trade in tasks where integration takes place on a horizontal basis, i.e. to
participate in GVCs. This old approach to regional integration should be discarded in favour of an open regionalism (as in ASEAN) where the exchange is of domestic reforms to attract FDI.
Among recommendations for trade policies to be adopted at the regional level:
(i) First, and foremost, a change in tariff policy at the regional level to insure access to intermediate inputs at world prices. This will require a reduction in regional tariffs (1-2-band tariff schedules), a very difficult reform to carry out among highly heterogeneous countries in the RECs but necessary to participate in GVC and participation in what has been dubbed the fourth industrial revolution (smart automation and the internet of things, Advanced robotics and 3-D printing).
(ii) Emphasize deep integration by tackling services markets. Access to services (transportation, accounting, ICT, consulting, financial) that are essential in the production of intermediate and final goods and participation in GVCs. Integration must be pushed beyond goods markets to include services and other regulations (including those not under negotiation at the WTO) (see [42]).
(iii) Carry out (on an occasional basis) trade policy diagnostics at the REC level rather than at the country level since so many trade-related policies are no longer
decided at the country level. These diagnostics would be an opportunity to monitor the application of decisions decided at the REC level.16
16 [10] construct an index of implementation of texts actually signed by WAEMU members to show the diversity in implementation across members.
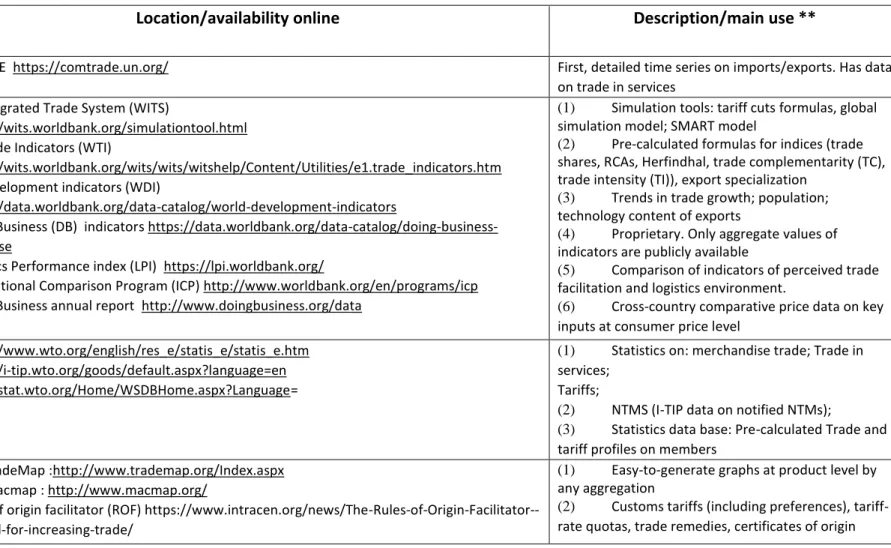
Annex 1: Main online data Sources
Table 3: Main Data sources for dashboard on Trade Outcomes *
Source Location/availability online Description/main use **
UN COMTRADE https://comtrade.un.org/ First, detailed time series on imports/exports. Has data
on trade in services World Bank World Integrated Trade System (WITS)
(1)https://wits.worldbank.org/simulationtool.html World Trade Indicators (WTI)
(2)https://wits.worldbank.org/wits/wits/witshelp/Content/Utilities/e1.trade_indicators.htm World Development indicators (WDI)
(3)https://data.worldbank.org/data-catalog/world-development-indicators
(4)Doing Business (DB) indicators https://data.worldbank.org/data-catalog/doing-business-database
(5)Logistics Performance index (LPI) https://lpi.worldbank.org/
(6)International Comparison Program (ICP) http://www.worldbank.org/en/programs/icp (7)Doing Business annual report http://www.doingbusiness.org/data
(1) Simulation tools: tariff cuts formulas, global simulation model; SMART model
(2) Pre-calculated formulas for indices (trade shares, RCAs, Herfindhal, trade complementarity (TC), trade intensity (TI)), export specialization
(3) Trends in trade growth; population; technology content of exports
(4) Proprietary. Only aggregate values of indicators are publicly available
(5) Comparison of indicators of perceived trade facilitation and logistics environment.
(6) Cross-country comparative price data on key inputs at consumer price level
World Trade Organization (WTO) (1)https://www.wto.org/english/res_e/statis_e/statis_e.htm (2)https://i-tip.wto.org/goods/default.aspx?language=en (3)http://stat.wto.org/Home/WSDBHome.aspx?Language=
(1) Statistics on: merchandise trade; Trade in services;
Tariffs;
(2) NTMS (I-TIP data on notified NTMs);
(3) Statistics data base: Pre-calculated Trade and tariff profiles on members
Int’nl. Trade Center (ITC)
(1) ITC TradeMap :http://www.trademap.org/Index.aspx (2) ITC-Macmap : http://www.macmap.org/
(3) Rules of origin facilitator (ROF) https://www.intracen.org/news/The-Rules-of-Origin-Facilitator--a-new-tool-for-increasing-trade/
(1) Easy-to-generate graphs at product level by any aggregation
(2) Customs tariffs (including preferences), tariff-rate quotas, trade remedies, certificates of origin
UNCTAD (1) Key statistics and Trends http://unctad.org/en/Pages/DITC/Trade-Analysis/TAB-Data-andStatistics.aspx
(2) NTM hub http://unctad.org/en/Pages/DITC/Trade-Analysis/Non-Tariff-Measures.aspx (3) LSCI http://unctadstat.unctad.org/wds/TableViewer/tableView.aspx?ReportId=92
(1) Maintains TRAINS (trade analysis and information system and world tariff profiles (also on ITC and WTO websites). FDI data base.
(2) Non-tariff Measures (NTM). Cross-sectional (3) Maritime connectivity index (LSCI).
Other: Texts on trade agreements. Regulatory distance index
CEPII (1)http://www.cepii.fr/CEPII/en/bdd_modele/bdd_modele.asp
(2)http://www.cepii.fr/CEPII/en/publications/wp/abstract.asp?NoDoc=2726
(1) GEODIST, GRAVITY, LANGUAGE, provide data (1948-2015) for gravity models.
(2) Cleaned trade data at product level (1997-2014).
Good for countries with data of poor quality International
Telecomunicat ions Union (ITU)
http://www.itu.int/en/ITU-D/Statistics/Pages/stat/default.aspx
Time series data for 150 different telecommunications and ICT statistics
International Labor Office (ILO)
http://www.ilo.org/global/statistics-and-databases/lang--en/index.htm Time series on 20 indicators of national labor markets
Harvard http://atlas.cid.harvard.edu Atlas of Economic Complexity
IMF (DOTS) Direction of Trade Statistics (DOTS) https://data.world/imf/direction-of-trade-statistics-dots. Aggregated bilateral merchandise trade WAEMU Observatoire des Pratique anormales Annual Report
http://patronat.bf/wp-content/uploads/2016/07/Rapport-annuel-OPA_2015.pdf
Annual report on illicit barriers along 9 corridors in West Africa (number of controls, illicit payments)
* For links to other data bases see Trade Data Day” events organized regularly by the WTO. Has links to data bases from OECD, UNCTAD, WB, IMF, WTO. See https://www.wto.org/english/res_e/statis_e/data_day15_e/data_day15_e.htm.
** Many indices are available on several portals. Organization with the main responsibility for updating the index is cited. Emphasis is on data and indices available on a time series basis. Indices of restrictiveness to trade in services are available, but not mentioned as they are cross-sectional. See the World Bank STRI index
(https://data.worldbank.org/data-catalog/services-trade-restrictions ) or the OECD restrictiveness index (http://www.oecd.org/tad/services-trade/services-trade-restrictivenessindex.htm) 6
Annex 2 Sketch of trade Policy outcomes in an archetype African economy Zonga, a low-income African country, has
• A very small domestic market where a few firms dominate the market
• Abundant natural resources (non-renewable (extractive industries) and renewable
(natural capital, e.g. forests). [55]. Exports of these resources give rise to rents and to rent-seeking activities. The ‘natural resource curse’ hypothesis has proven elusive [D7, chp.7 reviews the evidence].
• A low-to-medium skill workforce.
• Weak governance. This limits the ability of the government to:
o Enforce contracts and property rights [see WGI indicators in D9]. o Raise revenue to provide public goods (e.g. transport infrastructure and other public goods like, health, education and security).
• For landlocked countries, the physical geography is a barrier to trade acting as an extra protection for import-competing industries and as a tax on exports.
• Ethnolinguistic fragmentation and artificial borders present an additional barrier to trade [1], [2].
In this setting, as elsewhere, firms and individuals trade for a gain. According to the textbook exposé, producers of clothing can fetch a higher price abroad than on the home market. Consumers will pay less for a bike that is imported than they would if it were homemade at a higher cost (mostly from the assembly of imported components).
Trade leads to higher prices for clothing and to lower prices for bikes. These activities, that require no intervention, lead to potential “gains from trade” often called gains from arbitrage (exploiting differences in prices across space). These gains are potential because trade enlarges the size of the pie (the gains from specialization and exchange) but losses to consumers of clothing in Zonga must be balanced against the greater gains for producers and vice-versa for bike producers whose losses must be balanced against the greater gains to consumers for all to win from trade. The larger the gains from price arbitrage and the larger the set of goods that can be traded, the more disruptive trade will be and the larger the potential gains from trade. Very rarely is this compensation carried out even in
highincome economies with a well-functioning State so the inevitable conclusion is that trade results in gains for some and losses for others.
The gains are also potential at a deeper level. Information on foreign markets may be lacking, high uncertainty, informal barriers along the road to export and import, may all reduce the magnitude of these potential gains, irrespective of trade policy.
Enter trade policy. Four key effects
(i) tariffs are a tax on exporting activities;
(ii) QRs are more restrictive than tariffs that reduce imports by the same amount because they give market power to domestic firms;
(iii) Only when industrial policy is implementable (i.e. prevents firm entry while pushing incumbent firms to price at average costs and allow firms to fail) can protection help emerging activities realize economies of scale;
(iv) If enforceable, restrictions on exports of common-pool natural resources (especially those with slow rates of renewal) can help resource preservation. A. A tariff. By changing incentives, some sectors will become more profitable at the expense of others. If markets are close to conditions of perfect competition—as assumed implicitly in the above example—a tariff policy that protects producers of bikes has the following effects:
1. Protecting bike production is taxing production of clothing. So protecting manufacturing activities is, in effect, taxing exporting activities---a fundamental consequence of the change in relative profitability-- that is too often forgotten 2. By raising the price of bikes on the home market, producers of bikes gain while consumers lose. Resources are pulled out of high-productivity-low cost clothing towards low-productivity high cost bike production. Valuing revenue to the government equally to income accruing to the private sector, protection reduces GDP. The efficiency costs of protection increases more than proportionately with the height of the tariff and, for a given average tariff, efficiency costs increase with the variance in tariffs.17
3. The high transport costs associated with a low-quality ‘hard infrastructure’ provide natural protection for import-competing activities (see estimates in [17] and [32]). These transport costs are a further source of protection for import-competing activities and a further tax on exporting activities that have to absorb the transport costs to destination markets.
4. Trade policy is exploitation of the many (rural population) by the few (urban elite). Producers in urban areas lobby and obtain policies favourable to them while consumers are more passive (they stand to gain less from spending resources to obtain favourable policies than producers because their expenditures are spread while the incomes of owners of bike factories are more concentrated.
5. Because the government has limited alternatives to border taxes as a source of government revenue, fiscal reform to broaden the tax base is a necessary complement to reduction in tariffs (revenue neutral reform may be the only alternative).
B. A quota. Tariffs are rarely the only instrument of protection. Quotas and other non-tariff measures are also used. In a setting of perfect competition, one can show that there is a limited (i.e. a static) equivalence between a tariff and a quota that is one can choose a tariff that restricts imports of bikes by, say 20 percent as a quota that allows only 80 percent
17 [D10, chp. 3] explains these costs and gives illustrative numerical examples. In addition to lower efficiency costs, a uniform tariff has an additional gain: less resource waste into lobbying activities. The success of Chile’s trade policy liberalization of the late 1970s has been attributed to the application of a uniform across-the-board tariff of 10%, then later on of 5%.
of the import demand from their free trade level. This equivalence is, however limited because if there is an increase in import demand, under a tariff, imports increase while under a quota, the quota premium increases as imports do not increase.
Most importantly, in many instances, quotas are imposed in markets that are not operating under perfect competition (few producers with market power when protected from foreign competition). In that case, a quota gives market power to domestic firms (they are then facing a residual demand as there is no threat from imports). If there are only a few bike producers, a quota then allows domestic bike producers to produce less and sell at a higher price in the captive market.
Markets failures are numerous in Zonga.
I. A few firms dominate the market (Less than a handful of producers account for 90%
or more of production and exports (see [9]).
II. Exploiting economies of scale where even the largest firms are far from minimum
efficient scale (even with upcoming 3-D printing) provides a rationale for protection. III. Product differentiation implies that trade policy will affect the extent of product
varieties available to producers and consumers. For producers, a greater variety of intermediate inputs (when there are no restrictions on imports of intermediates) lowers production costs (see [21]). For consumers, more varieties increase their welfare.
IV. Industrial policy to prevent firm entry in activities with unrealized economies of scale accompanied by control on pricing to prevent the exploitation of market power is necessary.
V. Perennial crops like coffee, cocoa, vanilla, often grown by small-holders are subject to capture by intermediaries who have monopsony power. Governments will also attempt to extract profits from small-holders by not honouring commitments (the farmer invests in coffee trees to see the government change its policies and announce a tax on exports after costs are sunk before maturity). See [33] and [35] VI. For common-pool resources like timber and fish or slow replenishing resources (big
game), the opportunity to trade in weak governance environments will lead to overexploitation and resource depletion as beneficiaries that have not contributed to the growth of the resource are difficult to exclude. 18
Takeaway from this list of effects of trade policies
• The government faces a dilemma between efficiency (low trade taxes) and raising revenue needed for the provision of government services (defence, justice, education). A complementary fiscal reform to broaden the tax base is necessary. • Revenue-neutral tariff reform that reduces dispersion in tariffs across sectors may be
the only way to tariff reform with high tariffs for luxury goods not produced at home.
18 Opening to trade could lead to better enforcement of property rights and hence to an improvement in governance, but this is unlikely [see 55].
• A low and fairly uniform tariff policy will bring benefits. First, close to uniform tariff will discourage rent-seeking activities. Second, distortionary costs will be reduced. Third, competition from imports will exert discipline on domestic firms resulting in a more competitive industry structure (trade policy then serves as a substitute for competition policy).
• Any protection for emerging industrial activities should be temporary (say 5 to 10 years), a difficult feat to realize under any circumstance, but particularly so under weak governance. An industrial policy that prevents firm entry should accompany temporary protection. In the weak governance environment of Africa, the
government cannot commit to a time table for protection of infant industries. 19 • For slow-reproducing common-pool resources like forests, a tax or quota on exports
cans serve as a very imperfect substitute for establishing/enforcing property rights. If enforced, this will help slow down resource depletion20.
19 Industrial policy that prevented entry was an essential ingredient in the success of export-led growth across Asian countries.
20 Two useful checks (available from the World Bank) are total natural resource rents as a share of GDP and GDP national accounts that take into account the depreciation of natural capital See
Annex 3: Anatomy of bilateral Trade Costs
The aid-for-trade (AfT) initiative of 2005, and the Trade facilitation Agreement (TFA) of 2017 are directed at providing assistance—financial and technical—to help developing countries, particularly LDCs build the needed supply-side capacity to implement and benefit from WTO agreements (see the contributions in [D4] for a review of accomplishments and
shortcomings). Reducing trade costs is the mandate of these initiatives. Since trade is bilateral, taking a tally of bilateral trade costs is a convenient way of describing the range of trade costs that the positive agenda should tackle.
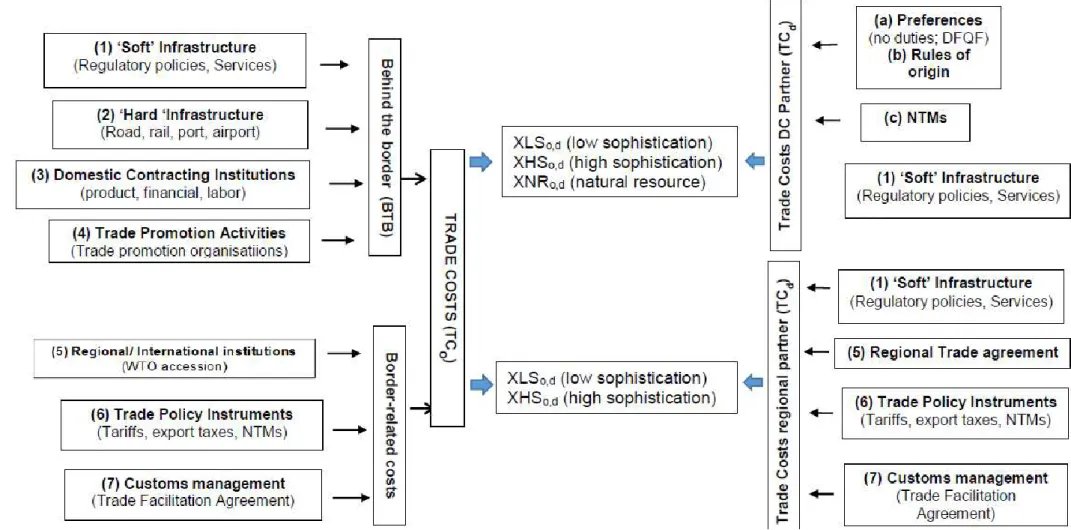
At the most general level, bilateral trade depends on ‘capabilities’ in origin and in
destination countries and on bilateral trade costs [27]. Figure 1 translates this observation by showing how bilateral trade volumes between origin (o) and destination (d) partners, as captured in gravity models, depend on trade costs in origin (LHS) and destination partners (RHS). 21 Together, these costs make up bilateral trade costs, decomposed into trade costs in the origin country on the LHS and on the destination country on the RHS. Here the origin country is an African country. The RHS distinguishes between high-income trade partners and other partners, here summarized by regional partners. Bilateral trade costs depend on all the costs listed in figure 1, but to a different extent according to the type of product traded and according to the destination partner. Important, but largely exogenous
determinants of trade costs like geography, population density, are not discussed here but are usually controlled for in estimates of bilateral trade costs. Neither is the value of the real exchange rate, a very important determinant of competitiveness in the short-to-medium term.23
Three categories of export goods are distinguished with a distinction between those
exported (or aspiring to be exported) mainly to high-income countries on the top and those exported to other African countries, at the bottom. The abbreviated names of categories only capture roughly differences in product characteristics, which, in turn, call for a different mix of measures:
• XLS(low-sophistication): Goods with few upstream links/little complexity (flour milling)22
• XHS(high-sophistication): Goods with linkages/complexity (agribusiness, electronic equipment)
• XNR: Non-renewable or slowly renewable natural resource goods with high rents
and/or weak property rights (minerals, perennials)
21 In the theory based structural gravity model, these costs in the origin and destination countries are captured by the so-called ‘multilateral resistance’ terms. While useful to generate theory-consistent estimates of bilateral trade flows (at the intensive margin, i.e. for existing trade flows), coefficient estimates are of little help in a trade policy diagnostic where the interest is in identifying which trade costs are the most binding in the origin and destination countries rather than in identifying the aggregate effects of these trade costs. See [6] and [D12] 23 [38] and [18] give evidence that sustained devaluations of the real exchange rate are accompanied by lasting export surges and higher growth.
22 Indicators of the technological complexity of individual goods and export baskets are available at the product and country level in the atlas of economic complexity website (see table 2). See [31] for a comparison of different indicators of technological complexity.
Trade costs for all three categories of goods depend on both behind-the-border (BTB) costs (often abbreviated under the rubric ‘logistics markets’) and on border-related costs. To avoid cluttering the figure, the breakdown of trade costs between border-related costs and BTB cost in destination markets is not shown. Rather the most important costs facing exports in destination markets are directly shown next to the destination partner. Thus, NTMs and soft infrastructure (i.e. regulatory policies) can be important obstacles in highincome destinations, but less so when the destination is a regional partner.23
For XHS goods, soft infrastructure (1) lack of knowledge of foreign markets (a rationale for trade promotion activities (captured by Trade Promoting Organizations (TPOs) (4)) and the quality of domestic contracting institutions (3) weigh heavily in overall trade costs. The competitiveness of XHS goods hinges heavily on the functioning of logistics markets.
Competitiveness includes tariff exemptions on imported intermediates embodied in exports and efficient customs management (7).26
For XLS goods, adequate hard-infrastructure and removing direct and indirect cost-raising policies (tariffs and export taxes) is important. A reduction of tariffs on manufactures will indirectly raise the profitability of agricultural goods.
For XNR goods, hard infrastructure (2) and trade restrictions (6) are likely to be an important component of trade costs.24
A summary of selected evidence on the importance of these trade costs components is given below (see [D4] for further description of the studies).
LHS: Trade costs at origin (TCo) For BTB measures, there is debate on the relative importance of ‘soft’ (1) and ‘hard’ (2) trade costs. Magnitudes depend on the evaluation approach (e.g. gravity models where DB and WGI indicators serve as proxies to capture costs [47 and 48] or synthetic control methods based on building a synthetic counterfactual from a small control group of entities). Results also depend on the context. 25 Regulatory policies (standards and the accompanying NTMs), services (professional, transport, financial, communication)) make up the logistics markets. Improvements in regulatory policies is an area on the trade agenda where reforms can often be carried out at relatively low financial costs. The problem here is that the estimates of their relative importance come from models where the proxies for policy indicators are outcomes (often composite subjective evaluation indicators or ‘objective’ indicators of ambiguous interpretation) and not policies in the hands of policy 23 In the discussion on trading across borders, Doing Business discusses the expected gains and the difficulties in implementing a single window at customs [(D8, pp-79-84]. 26 Numbers in parenthesis refer to the trade costs identified in figure 1.
24 . Trade affects natural resources through several channels (depletion, a vector of invasive species that may threaten ecosystems). See [14] and [55].
25 See [19] for an application of the synthetic control method. [32] was the first study to show high transport costs inland in Africa. [40] decomposes the differences in road transport costs across regions. Costs associated with poor soft infrastructure (i.e. regulations) are high in West Africa and costs associated with hard
makers. 26Then one cannot know which lever in say the rule of law or the logistics chain needs to be improved.27
Domestic contracting institutions (3) are part of the complementary capacity building
initiatives necessary for African countries to diversify their export basket, i.e. a pre-condition to move from an XLS towards on an XHS basket.28 Controlling for other determinants
comparative advantage (endowments and factor productivity), countries with stronger domestic institutions (as captured by the World Bank’s WGI indicators) have been shown to have a revealed comparative advantage in contract intensive goods.29 Private trade
institutions (fair-trade, voluntary standards, trading platforms as promotion of reputation mechanism) are could be promising for low-income countries, but little is known on their importance (see [34] for a survey).
Trade Promotion Organizations (TPOs-(4)) can help reduce the externalities facing small firms and pioneer exporters. Both incur heavy costs associated with the gathering of foreign market information (consumer preferences, business opportunities, quality and technical requirements). Firms may also be wary to invest to discover what works in foreign markets, because these can be directly or indirectly be used by their rivals. TPOs can then provide this information without each firm having to pay the cost of acquiring the necessary
information. Even with the sharp fall in trade, transport and communication costs and the process of digitalization which has disrupted the established ways of doing business reducing search costs, in the mostly small African countries where small firms are
creditconstrained, TPOs can help establish the conditions needed to penetrate successfully foreign markets. However, evidence on the efficacy of TPOs is inconclusive. 30
Border-related costs complete the tableau of trade costs and are now the focus of the TFA.31 Note that membership in regional trade agreements and in the WTO constrains the use of these border instruments through non-discrimination obligations even though LDCs, when they bound their tariffs at the WTO, chosen binding above the applied levels [10] In the African RTAs (but also in other RTAs), a non-negligible list of goods is excluded from the
26 Does a reduction in corporate taxes which eases firm activities a good policy when tax revenues are very low and alternatives sources are scarce?
27 [47] and 48] are examples where the estimates of trade costs broken down between ‘soft’ and ‘hard’ relate to an improvement in the LPI index, itself an average of an international component (6 subcomponents) and a national component (4 subcomponents). The components are obtained through online surveys where respondents are asked to rank the quality of the components of logistics on a 1-5 scale.
28 [24] gives evidence that countries with more diversified export baskets grow faster subsequently. [D7] challenge these results.
29 [44] New evidence that strengthens the importance of domestic institutions in accounting for patters of comparative advantage for manufactures, i.e for contract-intensive goods.
30 The mixed evidence on TPO programs is surveyed in [34]. Based on a sample where low-income countries are under-represented, [45] estimate high returns in terms of increased exports of expenditures on TPOs. In a case study that addresses the issue of ‘internal validity’, [8] Finds that the export promotion program in Tunisia only had a temporary effect, spillovers to the control group were not important, and the program did not lead to enhancements in product quality. Private benefits via additional corporate revenue just covered the public cost of the program.
31 See [D6] for a discussion of rationale and the coverage of the articles in the TFA and [40] for illustrative estimates of efficiency gains from implementation.
Common External Tariff. While this gives flexibility, it also creates uncertainty for traders and is suggestive of the success of lobbying activities and/or the lack of commitment by governments.
RHS: Trade costs at destination (TCd). For export to high-income partners, African countries, are recipients of Special and differential (S&D) treatment through AGOA in the US market and EBA in the European market.. The resulting average preference margins in (a) are very low (1-2% according to [56]). Even following the recent relaxation of Rules of origin (RoO) requirements for LDCs agreed at the Nairobi ministerial in 2015 (up to 75% of nonoriginating materials are allowed to confer origin), RoO in (b) are still a barrier to entry for non-LDCs as these requirements are typically more stringent for the few goods that have non-negligible preference margins. Preferential margins from the BRICs could be significant if preferences were applied on a wide range of goods, but little is known about these margins and about the accompanying RoO. In sum, there is very little to expect from improvements in S&D from high-income partners and should not be the focus of trade policy agenda for African countries.32
The main--but difficult to quantify--obstacle to market access in high-income partners comes from the growing spread of NTMs in middle and high-income countries (c). This spread is largely a reflection of the demand for safety and quality (import unit values rise with per capita incomes). This is why often it is said that NTMs are moving from a
protectionist towards a precautionary motive [57]. African countries then are faced with the choice of upgrading their regulatory standards to those in high-income countries, or at least to those of the ISO but at the risk of being shut off from the more-rapidly expanding
markets in middle-income markets.
Most estimates of the effects of NTMs are based on NTMs being captured only by a binary indicator and where it is difficult to control for the presence of multiple NTMs on a product. These estimates find that NTMs restrict trade more than tariffs, i.e. they have a higher welfare cost than ‘equivalent’ tariffs, and this relatively more so for low-income countries [30]. For plant products of great interest to African countries, Sanitary and Phyto-Sanitary (SPS) measures are in the form of Maximum Residue Levels (MRLs) that vary in intensity across countries opening the door to more accurate estimates. Again, estimates of MRLs on imports of plant products in OECD countries constrain more exporters of LDCs than of their competitors. 33. Harmonization of national standards to international norms should
contribute to expand exports of African manufactures [7b]
For destinations in regional markets, reductions in tariffs and formal (e.g. proof of origin and other certifications) and informal (e.g. road blocks) are still important in overall trade costs
32 [37] argues that the EPAs with the EU will have minimal revenue effects for the African partners and will bring limited gains (lower cost intermediates). The exclusion of services will limit the magnitude of the gains. 33 [58] show that MRLs jointly enhance demand by reducing information asymmetry for a 4-year panel of 60 exporting countries for 109 plant products. Case studies of African exports reported in {43] also find that NTMs (as captured by binary variables) reduce imports from African countries in OECD countries.
even though many countries are involved in RTAs.34 . Improvements in customs management (7) could reduce trade costs significantly [40]. As the importance of regulatory policies develop, mutual recognition agreements, if enforced, and efforts at harmonizing national standards with international standards should boost exports of manufactures [11]. Cooperation to ensure closer monitoring of NTBs across regional partners would reduce trade costs.
34 [42] show no increase in the intensity of intra-regional trade (captured by the average distance of trade) ten years after signature across the eight African RECs.
![[PDF] Support de Cours Ajax gratuit | Cours informatique](data:image/gif;base64,R0lGODlhAQABAIAAAP///wAAACH5BAEAAAAALAAAAAABAAEAAAICRAEAOw==)