Publisher’s version / Version de l'éditeur:
Vous avez des questions? Nous pouvons vous aider. Pour communiquer directement avec un auteur, consultez la première page de la revue dans laquelle son article a été publié afin de trouver ses coordonnées. Si vous n’arrivez pas à les repérer, communiquez avec nous à PublicationsArchive-ArchivesPublications@nrc-cnrc.gc.ca.
Questions? Contact the NRC Publications Archive team at
PublicationsArchive-ArchivesPublications@nrc-cnrc.gc.ca. If you wish to email the authors directly, please see the first page of the publication for their contact information.
https://publications-cnrc.canada.ca/fra/droits
L’accès à ce site Web et l’utilisation de son contenu sont assujettis aux conditions présentées dans le site LISEZ CES CONDITIONS ATTENTIVEMENT AVANT D’UTILISER CE SITE WEB.
Proceedings of the Fourth International Conference on 3-D Digital Imaging and
Modeling (3DIM), 2003
READ THESE TERMS AND CONDITIONS CAREFULLY BEFORE USING THIS WEBSITE. https://nrc-publications.canada.ca/eng/copyright
NRC Publications Archive Record / Notice des Archives des publications du CNRC :
https://nrc-publications.canada.ca/eng/view/object/?id=cb9f00ff-e780-4121-a1cf-dea80cdb8cb8 https://publications-cnrc.canada.ca/fra/voir/objet/?id=cb9f00ff-e780-4121-a1cf-dea80cdb8cb8
NRC Publications Archive
Archives des publications du CNRC
This publication could be one of several versions: author’s original, accepted manuscript or the publisher’s version. / La version de cette publication peut être l’une des suivantes : la version prépublication de l’auteur, la version acceptée du manuscrit ou la version de l’éditeur.
Access and use of this website and the material on it are subject to the Terms and Conditions set forth at
Accuracy Verification and Enhancement in 3D Modeling: Application to
Donatello's Maddelena
National Research Council Canada Institute for Information Technology Conseil national de recherches Canada Institut de technologie de l'information
Accuracy Verification and Enhancement in 3D
Modeling: Application to Donatello's Maddelena *
Guidi, J.-A., Cioci, G., Atzeni, A., Beraldin, J.-A.
October 2003
* published in Proceedings of the Fourth International Conference on 3-D Digital Imaging and Modeling (3DIM). Banff, Alberta, Canada. October 6-10, 2003. pp 334-341. NRC 47082.
Copyright 2003 by
National Research Council of Canada
Permission is granted to quote short excerpts and to reproduce figures and tables from this report, provided that the source of such material is fully acknowledged.
Accuracy Verification and Enhancement in 3D Modeling:
Application to Donatello’s Maddalena
Gabriele Guidi, Andrea Cioci, Carlo Atzeni
Università degli Studi di Firenze, DET Florence, Italy
g.guidi@ieee.org
J.-Angelo Beraldin
National Research Council Canada, IIT Ottawa, Ontario, Canada
angelo.beraldin@nrc-cnrc.gc.ca Abstract
The three-dimensional acquisition and modeling of Donatello's Maddalena was started in order to create a methodology that aims at monitoring fragile wooden sculptures over the years. Hence a set of new approaches in 3D modeling was needed for obtaining the necessary metric reliability. The main focus of the work is modeling accuracy, therefore quality control procedures based both of the self check of 3D data and the use of complementary 3D sensors were developed for testing the model. Sensor fusion was also extensively used in order to correct a few alignment errors after the ICP phase leading to a not negligible overall metric discrepancy. All the steps of the acquisition procedure, from the project planning to the solution of the various technical and logistical problems are reported. Although few commercial systems claim to use a similar approach, for the first time, the non-invasive integration of photogrammetry and 3D scanning, specifically designed for applications in Cultural Heritage, is here extensively documented.
1. Introduction
The object of this study has been the digitizing of the Maddalena, a wooden statue made by Donatello in 1455. It is characterized by a number of difficulty factors. The first and most obvious is a consequence of the extreme surface complexity. With triangulation based 3D sensors - as those used for this range of scales - such complexity involves range maps with large missing portions due to the unavoidable shadows. Another drawback related to the same factor is that such kind of range maps, when aligned with adjacent ones, might include only small common surfaces due to positioning constrains, leading to possible alignment errors. Since metric reliability of the final model is imperative for this project, appropriate acquisition strategies and complementary 3D measurement methods like photogrammetry were used. First, these allowed an evaluation metric errors and afterwards, a reduction of these possible errors. Finally, aspects related to nonuniform surfaces reflectivity have been taken into account. The original material
constituting the sculpture used to be gold coated wood but was subjected to several deterioration factors over the centuries, as for instance the 1966 flood of Florence. Such factors deteriorated the sculpture taking away most of the golden layer. As a result the surface is mostly dark, with areas markedly non-Lambertian due some gold residuals. This fact tends to worsen the performance of 3D sensors in term of geometrical noise superimposed over the real surface behavior.
The need to face all these problems required to develop a specific acquisition and modeling protocol together with some verification criteria, which are here described and proposed as a possible standard approach for generating 3D models of Cultural Heritage.
2. Equipment
A range camera flexible enough to cover a wide variety of applications was employed. It is capable of measuring from wide surfaces with few details, up to the small cracks in the wood, typical of some portion of the statue. The range camera used for this project employs the projection of special patterns over the area of interest. The images of the patterns deformed by the surface to be measured are acquired by a video camera and digitized through a frame grabber. The patterns represent a set of vertical stripes alternatively black and white, usually called fringe patterns. Each black-white interface can be considered as a blade of light (or light plane) similar to those produced by a triangulation-based laser scanner. Our system combines two complementary pattern projection strategies: the Gray Code Method (GCM), and the Phase Shift Method (PSM).
In order to project the maximum number of light planes that the projector can handle over the surface, the pattern should be the finest possible (i.e. the one formed by the maximum number of vertical lines). By acquiring it through a camera that not necessarily frames all the projected lines, it would be easy to detect uncoded stripes, but problematic to identify each single light plane within the N generated ones. Therefore, a proper sequence of patterns is created rather than a single pattern. The sequence is made by n pattern starting from the simplest,
made with an area half black and half white, followed by one made by a black-white-black-white sequence, and so on progressively, splitting each stripe in two black and white areas up to the maximum level of light planes. In our system n=7, leading to a maximum number of light planes equal to 27=128. If any image acquired is thresholded in order to discriminate black and white areas, the composition of the 7 images gives a 7 bit gray code for each pixel, ranging from 0000000 (pixel black in all the images) to 1111111 (pixel white in all images). The spatial coordinates are generated projecting the same pattern sequence in two different situations, first with a reference plane, then with the object. Two gray codes matrices are therefore originated and corresponding gray codes are searched in each matrix for calculating the displacement of each light plane due to the object. From such displacement the 3D coordinates are evaluated through triangulation.
With the Phase Shift Method, a fine pattern of vertical stripes with smooth intensity variation (defocused) is used, rather than a pattern with steep black-white transitions. Therefore no reference to specific light planes is done. This sinusoidal pattern is first projected over a reference plane, then, it is projected again over the investigated surface. The presence of such surface involves a phase deviation of the pattern that is proportional to the surface displacement with respect to the reference. Hence this method evaluates phase changes on any image pixel and from these calculates the corresponding displacements in 3D. By translating iteratively the pattern of a period fraction along the horizontal direction, all of the sinusoidal period can be covered. In our system, the whole period is divided into four steps. Precision and accuracy of this measurement approach are better than GCM, but a major limitation occurs. The phase of a signal is periodic and a phase change of ∆ϕ might involve a real change of ∆ϕ plus an integer number of cycles. Although software procedures have been conceived for reconstructing the real phase behavior (“phase unwrapping”), an abrupt displacement variation can easily involve a failure of the unwrapping algorithm leading to a wrong 3D estimate. Such phase ambiguity makes this approach suitable for measurement of displacements small enough to produce phase changes smaller than one cycle.
In this system, the evaluation of 3D coordinates is obtained first by projecting a sequence of Gray coded light patterns over the inspected surface in order to evaluate its approximate coordinates, and then on phase shifting the finest pattern for a refinement of each 3D point estimation, according to a method described in the literature [1]. In this way, the capability of measuring large distance variations on the surface, typical of the Gray Code Method is combined with the finer resolution
of the Phase Shift Method that is here employed with no unwrapping thanks to the integration with GCM. Furthermore, this makes the method very computationally robust. Our pattern projection system, whose opto-geometrical setup and the calibration are easily definable by the end user, is manufactured by Optonet Srl, Brescia, Italy. It is made with a C-mount video-camera and a liquid crystal pattern projector, fixed together on a metallic bar. Both the video camera and the projector are controlled by a PC that activates a pattern and correspondingly acquires the resulting image from the video-camera through a frame grabber.
The range camera is usually oriented toward the object to be modeled in order to acquire in the best way all portions of its surface with different takes. The reference system of each range map is local to the camera. In order to transpose all the range maps into a global coordinate system, an Iterative Closest Point (ICP) alignment technique was used for re-positioning all of the range maps in the same coordinate system [2]. This step is followed by the merging of all the range maps into a single polygonal mesh. 3D model editing was performed to correct possible topological errors. Of these modeling steps were achieved through the commercial software package Polyworks ModelerTM. Due to the large amount
of data, the software was run on a dual CPU PC, equipped with 2 GByte of RAM, in order to minimize the possible memory swapping during large data sets processing.
Photogrammetry was also used as a complementary 3D sensing technique [3]. Starting from a calibrated camera whose internal parameters are known (focal length, lens distortion, and sensor distortion), two or more images framing the same targets from different angles are taken. On such images some key points, representing the position on the sensor plane of corresponding targets, are selected. The equations describing the geometrical projection of the scene on the sensor lead to a nonlinear system that can be solved through a minimization process (Bundle Adjustment). If some absolute coordinates or some distances measured on the scene are known, such minimization gives the metrically correct camera position and orientation of each image. This process, known as “image registration”, allows the generation, through triangulation, of the 3D coordinates of each target present on different images.
Due to its high intrinsic accuracy on large fields when using large baselines (one part on some thousands), the technique was exploited for a dimensional verification on the 3D model produced by the ICP based alignment. Although a single range map is known to have a level of accuracy comparable to photogrammetry (or even better), what is unknown is the level of accuracy of a set of range maps after the alignment process. As a matter of fact alignment can be influenced by several factors
independently of the accuracy of each single range map, such as the amount of superposition between adjacent images or the presence of 3D features over the surface, that can give an error several times larger with respect to a single raw scan. In this specific project, we found a ratio larger than 1:10 between the error associated to photogrammetry and the one associated with a merged model. Photogrammetry was therefore used as a reference of superior accuracy for testing the model.
The stereoscopic pairs were generated with a 150 mm focal length metric camera employing a 130x180 mm format. The baseline used is approximately 0.8 m. Image registration and 3D coordinates estimation were obtained with a mechanical stereo collimator for cartography. For the following phase, involving the integration of 3D data coming from different sensors, a close-range digital photogrammetry system was employed, based on a 5.2 megapixel digital camera (Nikon Coolpix 5000) coupled with the ShapeCapture software (ShapeQuest, Ontario, Canada).A set of specific procedures implemented in the Matlab environment was also used for all the complementary processing involved, such as accurate 3D coordinates extraction of targets, rototranslation of range maps, evaluation of sensor uncertainty, averaging, etc.
Although few commercial systems claim to use a similar approach, the non-invasive integration of photogrammetry and 3D scanning, specifically designed for applications in Cultural Heritage, is here extensively documented. Non-invasive in the sense that no targets were glued on the surface of the sculpture as is the case with commercial solutions.
3. Project planning
The first step was to define an acquisition volume suitable to digitize the 180 cm tall statue Maddalena. The choice is a tradeoff between spatial resolution, that should be as high as possible, and the size of the data set produced by the digitization. It shouldn’t exceed the limits imposed by the hardware and by the post processing software. Thanks to the advice given by the experts of the Opera del Duomo Museum, a lateral resolution of 0.5 mm was considered sufficient for the areas less rich of details, 0.25 mm for the zones richer of formal details (the hands, the face and the feet), and 0.1 mm for areas with special features like cracks and defects due to aging.
The first coarse acquisition was completed in about 20 hours, producing 170 range maps approximately aligned in parallel with the acquisition phase. A much longer time frame (30 hours) was taken by the fine-alignment stage during which a global ICP was carried out. Once the first low-resolution model was completed, the missing areas, together with those richer of details, were re-acquired in a
second session. For this purpose, the range camera set-up was changed in order to increase the lateral resolution (smaller framed area), and to decrease the baseline for reducing the shadowing effects in the deeper sculpted areas.
4. Sensor optimization
During the preliminary stage, some critical points emerged. These were due in part to the intrinsic nature of the material and in part to the characteristics of the fringe projection system. The wood used the Maddalena is a material that is optically non-cooperative since it absorbs a good part of the lighting energy incident over its surface. This involved an increase of the noise superimposed over the geometrical information. However, considering several acquisitions taken with the range camera fixed in the same location, the noise involved resulted white ergodic and with a Gaussian distribution. Thanks to these properties, it was meaningful to operate an averaging of several shots taken with the camera in a fixed position. This was implemented with a specific piece of software we designed.
In order to experimentally estimate the optimal number of range maps to average, we acquired more times the same reference planar target. The displacement of each 3D point from the best-fitting plane allowed to evaluate the standard deviation in depth (σz) associated to the raw
range map and to the range maps generated from the averaging of a progressively growing number of acquisitions.
Figure 1. Decrease of σz (depth uncertainty) with
the number of averaged range maps (N)
The behavior of σz with the number of averaged range
maps is reported in Figure 1. It was found that a good tradeoff was to use four images which corresponds approximately to the curve knee in Figure 1. Here the decrease of σz is about 25-30% of the one associate with
the raw data, without an excessive amount of acquisitions needed. This process was used for all the critical range maps.
Another point for increasing the single range map quality was related to a key device in our system: a defocuser put in front of the pattern projector. This device allows a smoothing of each fringe boundary giving it a transition from black to white following a sinusoidal law. This is important for getting good results from the phase shifting stage of the range map evaluation. The defocusing level is determined by a manual rotation of a notched metal ring, usually set by the operator estimating approximately the proper defocusing level. Unfortunately, a wrong defocusing (too little or too much as well) produces systematic measurement errors similar to an oscillation superimposed onto the actual geometry of the acquired surface.
The effect of defocusing, was then experimentally studied by calibrating the system at different defocuser settings, defining the defocusing step as the distance between adjacent notches on the rotating ring (1.66° of rotation). Once again, a planar target located in the center of the measurement volume was acquired, and the related σz from the best-fitting plane was calculated for each
calibration.
Figure 2. Depth uncertainty (σz) vs. defocusing
level at three different f-numbers. Depending on the f-number, the minimum is located at 5, 6 or 7 respectively
As it is known, many parameters influence σz
(uncertainty). We took into account the camera-measurement volume distance (standoff or L), the camera-projector distance (baseline or D) and the ratio of the focal length of the lens to the effective diameter of its aperture (f-number). The full characterization is too long to be reported here. However, as an example, we report the results for a defocusing level N from 0 (no defocusing) to 10, on the configuration employed for the first acquisition (L=1200 mm, D=600 mm). In Figure 2, the trend on the curve σz vs. N for three different values
of f, is shown. It is evident, a minimum for each curve, corresponding to step 5, 6 and 7 respectively. Of course
for all the acquisitions the optimal defocusing level have been used.
5. Modeling
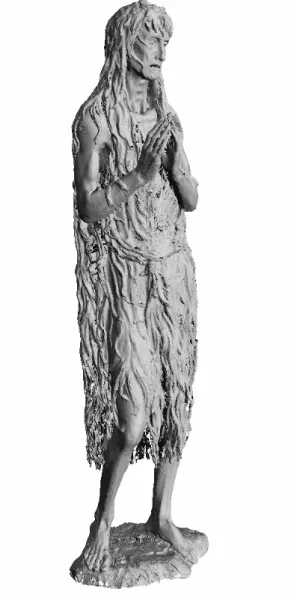
After the second high-resolution digitization for integrating the first rough model, a high resolution model of the whole figure was completed (Figure 3). A total of 374 range maps were merged together starting from a set of 405 initially acquired for generating a first high resolution polygonal mesh. The geometrical sampling step was then selectively reduced in order to keep the global size of the 3D model below 150 MB. The final model size, after reduction with the IMCompress tool in the Polyworks package, was 4.6 millions of triangles.
Figure 3. Complete model of the sculpture. lateral resolution: 0.25 mm and depth uncertainty: σz=70 µm
6. Accuracy verification A number of sub-models were then completed. Some
examples are shown in Figure 4. The head (Figure 4a) was the only model accurately edited in order to use it for multimedia presentations and demos, while the model of the face (Figure 4b), were made at the maximum level of resolution and left unedited for avoiding fake data to be added.
At this stage an acquisition work is usually considered complete. In our project, a quality control was arranged in order to check the metric reliability of the whole model. A complementary sensor was used in order to achieve such purpose: photogrammetry.
The photogrammetric survey was arranged for evaluating the correctness of the 3D model obtained after the integration stage. Photographs taken with the large format metric camera at a distance of 2.50 meters from the object allowed the framing of the entire statue in a single picture. Ten 2D shots were taken for each side, laterally displaced by 800 mm in order to maintain a base/distance ratio of circa 1:3, which is considered a good compromise between accuracy (better with larger bases) and stereovision (better with shorter bases).
a)
b)
Eight stereo models were derived. In every model, the vertical accuracy verification was achieved by measuring four targets over an aluminum stadia bar, consisting in four holes whose distance was measured in a mechanical laboratory with an accuracy better than 0.1 mm. The measurements in laboratory setting were made at a temperature approximately equal to the one found in the museum (18°). The stereo models obtained made it possible to measure the relative distances between fully identifiable key points visible in stereoscopy, such as for example wood-worm holes, which it was possible to compare with the values measured on the model obtained with three-dimensional scanning.
As the photogrammetric system used in this case is based on manual collimation, we tried to reduce the operator selection error employing 3D scans at a resolution high enough to obtain a scale level similar to the one of the metric images at the maximum optical zoom level. Since raw 3D images have their own reference system, unrelated to the one of the whole model, we aligned each high-resolution point cloud on the “skeleton” model through the “Polyworks” software, producing in this way a pose matrix for each aligned image. This process allows the mapping of the spatial coordinates of the raw image in a common reference system for the whole model.
We developed within Matlab a specific piece of software to operate a pixel selection on the bitmap image associated to the point cloud, which stores the 3D coordinates and transfer them in the reference system of the model, producing also a bitmap file with a well visible target superimposed on the gray levels image. Once a couple of raw points have been selected (even from different 3D acquisitions), the same software calculates the distance between them in the model reference system. A couple of marked images are then passed to the Figure 4. Partial models: a) head (lateral
resolution 0.25 mm, σz=70 µm); b) face (lateral
photogrammetry operator for helping him in the
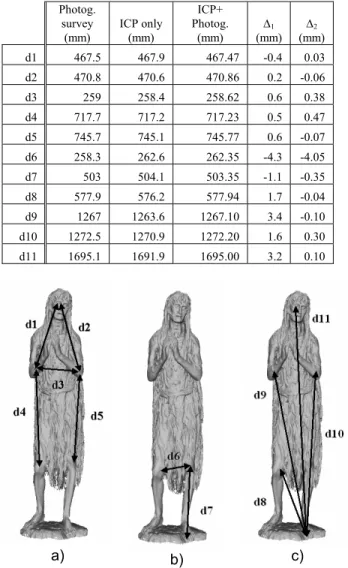
following manual selection of the corresponding points. to the bust, as the distance between the right eye and the It is evident that the distance between points belonging elbows, or the distance between arms (d1 to d5), have similar values with both measurement techniques. Such agreement is due to a good alignment on the upper part of the statue, where point clouds have no significant gaps. Some distances measured through the two systems are
described in Figure 5 and reported in the first part of Table 1. For the extended results of the survey see [4].
The deviations between photogrammetry and the 3D model reported in the fourth column of Table 1 (∆), have been ordered according to their value and shown in Figure 5.
Conversely, the typical discontinuous surface of the lower part of the statue, led to fragmented scans, whose alignment was more complex and involved wider errors although the portion of overlapping surface between adjacent images was of the same order of the other scans. This is confirmed by the measurements from the right eye and the knees to the left foot (d9 to d11), which emphasize a compression of the 3D model with respect to the photogrammetric survey.
Table 1. Test measurements on the Maddalena’s 3D model, summarized in Figure 5, before and after photogrammetry integration
Photog. survey (mm) ICP only (mm) ICP+ Photog. (mm) ∆1 (mm) ∆2 (mm) d1 467.5 467.9 467.47 -0.4 0.03 d2 470.8 470.6 470.86 0.2 -0.06 d3 259 258.4 258.62 0.6 0.38 d4 717.7 717.2 717.23 0.5 0.47 d5 745.7 745.1 745.77 0.6 -0.07 d6 258.3 262.6 262.35 -4.3 -4.05 d7 503 504.1 503.35 -1.1 -0.35 d8 577.9 576.2 577.94 1.7 -0.04 d9 1267 1263.6 1267.10 3.4 -0.10 d10 1272.5 1270.9 1272.20 1.6 0.30 d11 1695.1 1691.9 1695.00 3.2 0.10
Another interesting data is represented by the distance between the knees (d6), and the knee-foot distance on the left side (d7), that on the 3D model is wider than in the reference, probably due to the lack of locking surfaces in that part of the statue, where the two thin legs are independently aligned starting from the upper unique block. A 3D system with a larger depth of field could have helped in this area of the statue. Usually, well-designed laser-based systems can achieve larger depth of fields compared to fringe projection-based systems. 7. Sensor fusion
The error detection on our first model stimulated the research of an improved alignment method, integrating the high density and high accuracy data coming out of the range camera for a little volume, with few selected points at high accuracy over the whole sculpture’s height. It was specially designed for delicate objects that cannot be touched as any ancient statue, which differs from other techniques involving markers attached on the object surface. This was first developed in the lab with a mannequin [6], and afterwards applied to the Maddalena’s data with some integrating acquisitions. This laboratory set-up also allowed our team to practice safety precautions in order work later around a precious work of art.
a) b) c)
Four targeting plates were located around the statue with tripods. Care was taken in order to avoid any contact between the plates and the sculpture. The plates positions, shown in Figure 6, were determined by choosing surface portions at the two far ends of the object (near the neck and at the bottom), in order to fix the final model height, and in a couple of central areas near the knees, where major errors reported in Table 2 were found.
Figure 5. Dimensional monitoring on the 3D model through photogrammetry: a) model measurements in agreement with
photogrammetry; b) model measurements longer than photogrammetry; c) model measurements shorter than photogrammetry
The targeting plates were acquired with the range camera, framing in each image most of the plate together with an object surface portion large enough to be properly aligned with previously acquired range maps. From these
acquisitions a redundant number of target centroids (i.e. more than 3) was obtained in the range camera coordinate system.
Because of the high target redundancy, a set of target-to-target measurements were performed on the four targeting plates placed around the sculpture. By collecting horizontal and vertical distances of adjacent targets, a complete statistics of the photogrammetry performances locally to each targeting plate, was carried out.
One horizontal and one vertical stadia rods, 1 m and 1.6 m long respectively, were then added to the scenario in order to give a metric reference. With the digital camera described in section 3, properly calibrated in the lab, 9 images were taken from different locations towards the front side, 3 of which were used for photogrammetry. The camera object distance was approximately 1.5 m, as well as the displacement between adjacent shots. Since with our digital photogrammetry system the target selection is made separately on each image, there is no need for stereovision, and a base/distance ratio of 1:1 was used in order to increase accuracy.
The average of all such distances gave a value whose deviation from 40 mm was listed in Table 2 as accuracy error. This is in the order of few tens of microns for all plates except 400, whose orientation resulted suboptimal respect to an appropriate target selection. Correspondingly, a standard deviation from 0.1 to 0.3 mm was found.
Table 2. Local accuracy and uncertainty tests over the photogrammetry output through highly redundant targets
Plate Accuracy error (mm) Standard Deviation (mm) 200 0.025 0.217 300 0.018 0.120 400 0.152 0.307 500 0.035 0.320
After the 3D scanning and photogrammetry sessions, a set of target centroids for each of the four range maps framing both plates and sculpture surface was available in two reference systems: the first one local to the range camera, the second one, global to the whole statue. Four rigid pose matrices (from the local to the global reference) were therefore calculated with high accuracy thanks to redundancy, through the Quaternion method [8]. Further details about the procedure are available in [6].
Starting from these pre-aligned range maps, all the remaining 374 were then aligned through the Polyworks package, generating a second version of the model apparently equal to the first one but more accurate. 8. Summary of results
The comparison between the two models aligned through ICP only and photogrammetry enhanced ICP was obtained by evaluating exactly the same sample distances considered for the first photogrammetric survey, considered as reference values.
Figure 6. One of the images employed for close range digital photogrammetry. The four targeting plates are highlighted
In Table 1 a summary of the test measurements made on the Maddalena 3D model before (second column) and after (third column) the photogrammetry integration are compared with the first photogrammetry (first column), making evident the improved accuracy.
These highly convergent images, as the one shown in Figure 6, were then processed with the ShapeCapture program that allowed to locate the points corresponding to the different targets centroids but this time in a global
coordinate system for the whole sculpture. reduced their discrepancy from some millimeters (column Distances farther from the reference values (d7 to d11) ∆1) to tens of microns (column ∆2), as well as most
distances already in good agreement (d1 to d5), containing the maximum overall disagreement below 0.5 mm (d4). In general all the vertical values resulted properly corrected, while a similar improvement wasn’t obtained on the only horizontal disagreement (d6). This was due to positioning of plate 400 that resulted not near enough to the left knee to lock properly the related range maps.
9. Conclusions
In this paper, the acquisition and 3D model at high accuracy of Donatello’s Maddalena has been described. Modeling such a sculpture has represented a severe test for the performance of 3D digital acquisition techniques.
A photogrammetric survey compared with the 3D model, initially produced, demonstrated that the usual approach for creating 3D models of extremely complex three-dimensional objects from small range images may involve a loss of metric accuracy even when the single images are highly accurate. For overcoming such problems, a combination of range camera and photogrammetry was developed, in order to merge the good local accuracy and point density of the former, with the extraordinary overall accuracy of the latter. Furthermore, the methodology does not endanger the work of art (i.e. non invasive).
The subsequent steps of the acquisition procedure have been reported, describing the method required to re-orient all the photogrammetric and range data in a unique reference system. As a result, the overall dimension of the artwork, whose major size measures 1.80 meters, was modeled with a maximum vertical deviation of the order of few tenths of millimeter.
As a general criterion 3D scanning should always be coupled to a complementary measurement method at least for checking global accuracy. This can represent a significant progress towards a repeatable and reliable 3D digitization of Cultural Heritage.
10. Acknowledgment
The authors wish to thank the President of the Opera del Duomo in Florence Dr. Anna Mitrano, for permitting the access to the Donatello’s Maddalena in the Opera’s Museum. The photogrammetric measurements would have not been possible without the valuable support of Grazia Tucci, Daniele Ostuni and Fabrizio Costantino. Sabry El- Hakim from NRC Canada gave also precious suggestions for carrying out the final digital photogrammetry. Finally, the authors acknowledge the valuable collaboration of Stefano Ciofi and Valentina Damato during the stay at the University of Florence within their PhD fellowship.
11. References
[1] G. Sansoni, M. Carocci, R. Rodella, “3D vision based on the combination of Gray code and phase shift light projection”, Applied Optics, vol. 38, 1999, pp. 6565-6573. [2] M. Soucy, D. Laurendeau, “A general surface approach to
the integration of a set of range views”, IEEE Trans. On Pattern Analysis and Machine Intelligence, vol 4, n. 17, 1995, pp. 344-358.
[3] K.B. Atkinson, Close Range Photogrammetry and machine vision, Whittles Publishing, Cathness, Scotland UK, 1996, ISBN:1-870325-73-7.
[4] G. Guidi, D. Ostuni, F. Costantino, M. Pieraccini, G. Tucci, J.-A. Beraldin, “Photogrammetry and 3D scanning: assessment of metric accuracy for the digital model of Donatello's Maddalena”, Italy-Canada Workshop on 3D Digital Imaging and Modeling Applications of: Heritage, Industry, Medicine & Land, Padova, 2001.
[5] G. Guidi, M. Pieraccini, S. Ciofi, V. Damato, J.-A. Beraldin, C. Atzeni, “Tridimensional digitizing of Donatello's Maddalena”, IEEE International Conference on Image Processing, Thessaloniki, 2001, vol. 1, pp. 578-581.
[6] G. Guidi, J.-A. Beraldin, S. Ciofi, C. Atzeni, “Fusion of range camera and photogrammetry: a systematic procedure for improving 3D models metric accuracy”, accepted for publication on the IEEE Trans. on Systems, Man, and Cybernetics.
[7] J.-A. Beraldin, G. Guidi, S. Ciofi, C. Atzeni, “Improvement of metric accuracy of digital 3D models through digital photogrammetry. a case study: Donatello's Maddalena”, Intl. Symposium on 3D Data Processing Visualization and Transmission, Padova, 2002, vol. 1, pp. 758 -761.
[8] B.K.P. Horn, Closed-form solution of absolute orientation using unit quaternions, J. Opt. Soc. Am. A, vol. 4, n. 4, p. 629-642, 1987.