Can Shippers and Carriers Benefit from More Robust
Transportation Planning Methodologies?
by
Matthew James Harding Bachelor of Industrial Engineering
Georgia Institute of Technology
Submitted to the Engineering Systems Division in Partial Fulfillment of the Requirements for the Degree of
Master of Engineering in Logistics
at the MASACHUSES INS
OF TECHNOLOGY
Massachusetts Institute of Technology
J
j5 ]
June 2005
C 2005 Matthew Harding
LIBRARIES
All rights reserved
The author hereby grants to MIT permission to reproduce and to
distribute publicly paper and electronic copies of this thesis document in whole or in part.
Signature of A uthor ...
S
ineering Systems Div' ion / , 2005C ertified by ...
\f ,)r. Christopher G. Caplice Executive Director - Master of Engineering in Logistics Thes Supervisor
A ccep ted b y ... ... / / Yossi Sheffi
Professor of Civil anJEnvironmental Engineering Professor of Engineering Systems Director, MIT Center for Transportation and Logistics
Can Shippers and Carriers Benefit from More Robust
Transportation Planning Methodologies?
by
Matthew James Harding
Submitted to the Engineering Systems Division on June 3, 2005 in Partial Fulfillment of the Requirements for the Degree of Master of Engineering in
Logistics
Abstract
The analysis of transportation contracts using optimization software may yield higher actual freight expenditures due to unplanned events during execution. This thesis explores new methods for developing robust transportation plans leading to lower total cost by developing a transportation plan minimizing unplanned events and quantifying a cost of service for use in existing optimization models.
Robust transportation planning methodology requires the analysis of a variety of transactional related data, the application of analytical tools and performance measurement techniques. This thesis explores analytical techniques utilizing shipment, accept-reject, bid, and planning data. This analysis is then used to augment optimization software capabilities, develop simulation models and provide performance management frameworks by making assessments of
shipper-carrier interactions as they occur within the design of an optimized plan.
The results of this thesis include analysis and methods focused on quantification of carrier performance considering various classes of transactional data, bid data, and market data.
Methods to determine the amount of additional freight expenditures as a result of the frequency and severity of unplanned freight are provided and supported with simulation output.
Thesis Supervisor: Dr. Christopher G. Caplice
Acknowledgements
Yossi Sheffi for providing me an opportunity to be a part of the MLOG experience and the wonderful time I had learning about the world, myself and the special people that have entered my life as a result of his generosity. I am gratefully indebted.
My advisor, Chris Caplice for his faith in my abilities regardless of my confidence in them.
Chris leads by example and the opportunity to work with him over the past 6 years has shaped my understanding of life and career on many dimensions. His work ethic is remarkable and there are few people I have had the pleasure of knowing who are so focused and energetic. I have always valued coming down to Cambridge for a chat about transportation (and other worldly things), and I look forward to continuing them long into the future wherever they occur.
Unnamed sources who provided data. When two companies provide data, naming the people who helped you out is almost a breach of confidentiality. You know who you are and I thank you very much for your time and more important, your DATA! Without your help, none of this would be possible.
Professional colleagues: Matt Menner for being a friend and a champion in many ways. Your support is greatly appreciated. Kevin Zweier for teaching me how to run a bid, he is without question the most talented individual I know when it comes to the heavy lifting of making a bid successful. Kevin's people skills and quantitative ability were the secret behind all the sales presentations and hand-waving. I am fortunate to have crossed paths with such talent. Jeff Mitchell for his support and teaching me about the power of blast emails.
Gary Whicker and Woody Richardson for spending time with me and sharing perspectives from the side of the carrier. Trucking is so ubiquitous and so important, yet most do not see it for the valuable role it has in our daily lives. I appreciate your insights and your help.
Dedication
Sufficient words do not exist for the feeling of being part of a family that demands your time for the very essence of their well being.
Likewise, sufficient words do not exist for the feeling that strikes your core when a 5-year old asks, knowing the answer in advance, if you have "the MIT" today as he is planning his adventures and needs a fellow superhero. All in good time, Scotton - you will understand.
My thesis is dedicated to my family, Jen and Scotton, for their love and support. I adore you both...
Biographical Note
From 1998 to 2004, Matthew Harding has managed and lead optimization-based transportation procurement services on behalf of major shippers including Wal-Mart, Clorox, Hewlett-Packard, and others totaling over $3B (USD) in annually freight expenditures for U.S. and European transportation operations. For all projects, optimization-based bidding
methodologies were used in analyzing bid results with expected value delivered as a result of these efforts estimated in the range of 3-10% of yearly transportation freight expense. Projects focused primarily on truckload/intermodal transportation networks averaging roughly between $100MM-$500MM dollars per year. Experience in establishing contracts for other modes include: Ocean, LTL, Air, and European Surface.
During his tenure with transportation software companies, Mr. Harding has also
implemented and developed processes supported by transportation execution software focusing on dynamic routing optimization, continuous move analysis, rate variability analysis, backhaul analysis, carrier management analysis, business process analysis and various mode and service level studies.
From 1988-1997 Mr. Harding was employed by Ford/Loral Aerospace and Delta Airlines in the field of flight and weapons system simulation and obtained a Bachelor of Industrial
Table of Contents
Abstract ... 2 Acknowledgem ents ... 3 Dedication ... 4 Biographical Note... 4 Table of Contents ... 6 List of Tables... 7 List of Figures ... 8 1 Introduction ... 91.1 M otivation - Lim itations In Practice... 10
1.2 Literature Review - Transportation Sourcing and Carrier Economics ... 12
1.3 M ethodological N ote... 13
2 Industry O verview ... 15
2.1 Shippers... 16
2.2 Carriers... 21
2.3 Optim ization Solutions for Shippers and Carriers... 25
3 Shipm ent Data and Robustness... 35
3.1 Carrier Perform ance M easurem ent ... 38
3.2 Shipm ent Based Perform ance M etrics ... 40
3.3 Shipment-Based Performance Metrics and Multi-Level Aggregation ... 41
3.3.1 Relative Cost Index... 42
3.3.2 Price-based Coefficient of Variation... 43
3.3.3 Correlation to Total Volum e ... 44
3.4 Designing a Fram ew ork U sing Shipm ent-based M etrics ... 47
4 Acc pt Data and Robustness ... 52
4.1 Accept-Reject Processes ... 52
4.2 Accept-Reject and Opportunity... 54
4.3 Evaluating Accept & Reject Data ... 57
4.4 Accept-Reject Based Perform ance M etrics... 63
4.5 Planned versus Unplanned Accept-Rejects... 65
4.6 Com bining Accept-Reject M etrics w ith Contracted Volum e ... 71
5 O ptim ization Techniques for Robustness ... 74
5.1 Rate Adjustm ents ... 74
5.2 Capacity Adjustm ents ... 77
6 Sim ulating Planned and Unplanned Events... 81
6. 1 Sim ulation Design ... 85
6.2 Replicating Planned and Unplanned Freight Flows ... 87
6.3 Designing Em pirical and Theoretical Distributions ... 89
6.4 Application of Input Probability Distributions to M odel Design ... 91
6.5 Sim ulation Results ... 100
6.6 Linking Sim ulation to Optim ization... 113
7 Conclusion... 116
List of Tables
Table 2.1 Size of Transportation Auctions 1997-2001... 26
Table 3.1 Applying Categories for a General Framework ... 47
Table 3.2 Example of System Level Framework... 49
Table 4.1 Reject Summary Statistics for CPG-Co and IND-Co for Shipments ... 62
Table 4.2 Scope of Network and Carrier Level Accept Ratios... 65
Table 4.3 Planned/Unplanned Accept-Reject Matrix... 66
Table 4.4 Planned-Unplanned Accept Ratio Statistics for a Carrier... 69
Table 4.5 C arrier R esponse M atrix... 70
Table 4.6 Combining Accept-Reject with Contracted Volume ... 71
Table 5.1 Calculating Expected Cost Using Service Criteria... 75
Table 5.2 Limiting Capacity at the Facility Level Based on Service Parameters ... 78
Table 6.6.1 Example of mapping input probability distributions to simulation processes. ... 91
Table 6.2 Creating Simulated Demand and Estimating Planned Volume Percentages ... 100
Table 6.3 Determining Expected Increase Over Total Expected Planned Cost ... 101
Table 6.4 Simulation Scenarios with Adjusted Accept Ratios ... 102
Table 6.5 Ratio of Unplanned to Planned Model Input... 104
List of Figures
Figure 2.1. Conceptual Difference Between Planned and Actual Costs ... 32
Figure 3.1 Scope of Shipment Data in Execution ... 37
Figure 3.2 Example of Carrier-Lane Correlation to Total Volume - CTV=0.94... 46
Figure 3.3 Example of Carrier-Lane Correlation to Total Volume - CTV=0.76... 46
Figure 4.1 Efficient Frontier of Transportation: Frequency and Severity of Unplanned Freight ... 55
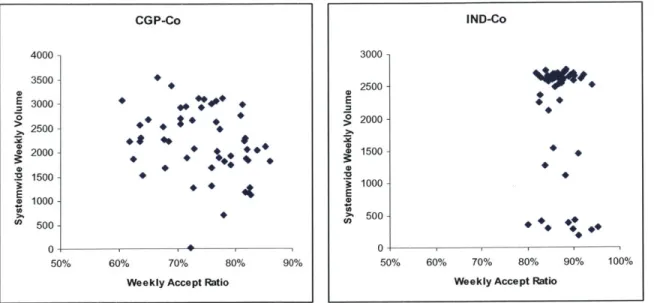
Figure 4.2 System Level Accept Ratio versus Volume Scatter Plots. ... 58
Figure 4.3 CPG-Co -US Domestic Network: 170K Shipments per Year, 2,338 Destinations ... 59
Figure 4.4 Accept Ratio & Volume - CPG-Co... 59
Figure 4.5 IND-Co - US Domestic Network: 1 10K Shipments per Year, 2,474 Destinations ... 60
Figure 4.6 Accept Ratio & Volume - IND-Co ... 61
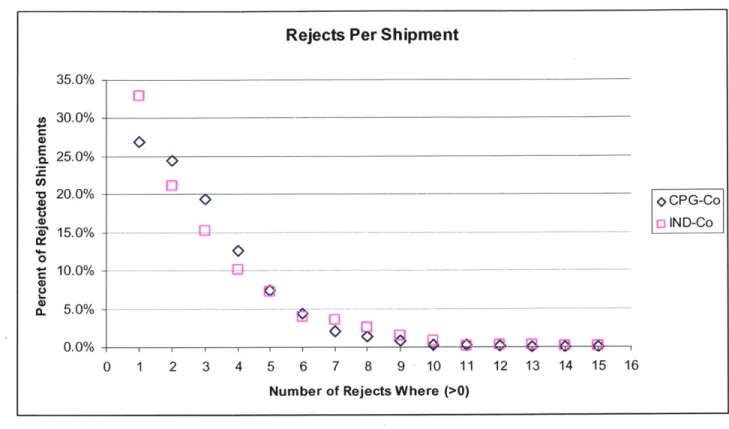
Figure 4.7 Rejects per Rejected Shipment -- CPG-Co and IND-Co ... 62
Figure 4.8 Shipper-Carrier Interaction and Scope of Accept-Reject Data... 63
Figure 4.9 Planned Accept and Reject Messages for Carrier at System Level ... 67
Figure 4.10 Unplanned Accept and Reject Messages for Carrier at System Level ... 68
Figure 6.1 IND-Co Variability of Lane Demand ... 82
Figure 6.2 CPG-Co Variability of Lane Demand ... 82
Figure 6.3 CPG-Co System Level Accept-Ratio for Planned and Unplanned Freight by Carrier ... 83
Figure 6.4 Robust Transportation Simulation Processes... 85
Figure 6.5 Aggregating by Level and Time Period... 90
Figure 6.6 Application of Empirical Distributions to Unplanned Cost Using Monte-Carlo Techniques... 97
Figure 6.7 Lane Adjusted Accept Ratios for Planned Freight ... 103
Figure 6.8 Ratio of Empirical Estimates to Weighted Bid Rates... 105
Figure 6. .9 Calculating Average Unplanned to Planned Cost Ratio... 107
Figure 6.10 Simulation Results for Various Planned Accept Ratios ... 108
Figure 6.11 Accept Ratio and Variability of Results ... 109
Figure 6.12 Percent Over Planned Freight Expenditure: Comparing Theoretical and Simulated ... 110
Introduction
This thesis explores analytical approaches that minimize freight expenditure for shippers by focusing on the uncertainty of the supply of capacity from the domestic truckload motor carrier market. Strategic planning is frequently performed by shippers using optimization software that aligns carrier capacity and rates to a shipper's forecasted freight volume. Shippers have freight to haul, and carriers haul the freight for a fee. The optimization software achieves this alignment by determining the lowest cost solution subject to business constraints provided by both the shipper and carrier. Although the formulations used within the software provide many benefits, there are inherent
weaknesses due to the limitations in addressing uncertainty. Formulations of mathematical modeling used in these software tools are designed to only reduce direct costs, an approach limited in addressing the dual objective faced by shippers of also maximizing service. The models are also rigidly designed using fixed parameters including demand values for anticipated freight volume, and fixed supply values for carrier capacity as input data. By design, these tools cannot consider variable supply and demand which can be expected as a result of business cycles, seasonal demand or other random disruptions in the supply chain. Since unplanned events associated with uncertainty are not modeled well in the current software tools, the burden of designing a robust transportation plan currently resides with the qualitative experiences of the transportation managers who establish contracts. This thesis addresses the gap between planned and unplanned events as they apply to the
strategic planning process and suggest approaches to mitigate the effects on increased freight expense.
1.1 Motivation - Limitations In Practice
In the early 1990's, the convergence of advanced, low cost computing power, improved optimization techniques, and a rapidly consolidating truckload market spawned a fertile ground for using mathematical methods in establishing transportation contracts. Over the past decade, shippers, carriers and software service providers have developed techniques to establish transportation contracts supported by optimization software and data intensive contracting processes. Shippers with sufficient freight expense to cost justify the use optimization software have adopted these processes as standard practice and will "optimize" their freight contracts roughly every one to two years with a network bid.
Sourcing transportation is a unique process when compared to other corporate sourcing functions. The quantity and characteristics of capacity required at a point in time materialize within a short timeframe prior to consumption. In addition, strategies for sourcing carrier capacity are counter intuitive to cost-focused sourcing strategies because an aggressive position on cost reduction with transportation services will likely lead to poor carrier responsiveness. Transportation providers that promise a lower rate cannot always guarantee capacity at the contracted level, and lower than market rates will always be challenged by more profitable alternatives within a carrier's own network.
This condition is further complicated by the technology employed to optimize transportation contracts because fluctuations in demand are generally ignored when
optimization technology is used. To a large extent, more robust planning approaches are limited by the availability of data. However, as transportation management software proliferates, the data necessary to make more informed decisions about carrier capabilities becomes more available to shippers. This is made possible though integrating technologies
such as EDI and XML which provides a better view of cost and service trade-offs by supporting quantitative techniques. The goal of this thesis is to determine if the
combination of statistical methods and optimization techniques can be established to yield better strategic planning for shippers.
The motivation for this thesis stems from observed limitations of using optimization within the current practices of transportation procurement. Currently, assessing the
robustness of a transportation plan is generally an informal process; however, shippers should be thinking ahead to better approaches for aligning their need for capacity with the financial and operational needs of carriers. The obvious goal for the shipper is to reduce transportation costs, but it is limited in its effectiveness when focusing purely on rates provided by carriers in a bid. Saving transportation costs should be in the context of creating a robust transportation plan that effectively aligns providers of transportation services to its consumers, effectively bringing value to both shippers and carriers.
1.2
Literature Review
-
Transportation Sourcing and Carrier Economics
Given the complexities within the transportation industry, there is a wide body of research focused on the dynamic aspects of networks and the application of mathematical methods to increase profitability for motor carriers. However, research that addresses the
specific topic of shipper procurement of carrier services is less plentiful. Ledyard (2000) recounts the first technology based bid and its success at Sears Logistics Services in the early 1990's. Caplice (1996) researches optimization based bidding, shipper/carrier economics, auction design, network design, carrier assignment, and other relevant topics.
Song and Regan (2003) cover various economic aspects of combinatorial bids from the perspective of the carrier using simulation techniques. Sheffi (2004) summarizes the application and development of the optimization based bidding tools and techniques over the last decade.
From the carrier perspective, there is extensive research focusing on carrier operations, trucking based asset management and market economics. Powell (2003) explores various optimization models as they apply to operation problems in the context of financial, physical and informational views. Jara-Diaz and Basso (2002) address production and cost functions and their application to various transportation networks as they apply to economies of scope.
Although this thesis does not explicitly address macro-economic trends and their implication on planning, they are a critical component to robust planning. Sources of industry based economic data include the Bureau of Transportation Statistics (BTS 2004) and Standard & Poor's Industry Survey of Commercial Transportation (S&P, 2004). Both
indicate tightening capacity in the current (2005) market after a period of consolidation in the North American truckload sector. Research by Lahiri and Yao (2004), Lahiri, Stelker, Yao and Young (2003) have suggested the potential of forecasting macro economic activity with transportation related indices resulting in the recently developed Transportation
Services Index. The TSI is now managed by the Bureau of Transportation Statistics and is a key component of economic predictors and is derived by aggregate transportation output across many modes for U.S. domestic freight.
1.3 Methodological Note
Although various sections of this thesis are not reinforced by quantitative analysis and are presented in general terms, the concepts and ideas are the culmination of my experience in managing and performing procurement services. I have interacted with hundreds of shipper and carrier transportation professionals in discussions regarding the planning and execution of transportation. This thesis is the culmination of those
observations with the hope of developing approaches that give equal consideration to needs of shippers and carriers a like, ultimately driving additional value in the industry. Any reliance on past experience will be cited as (Harding 2005).
The remainder of this thesis is organized as follows: Chapter 2 provides an introduction to the industry focusing on shippers, carriers and the optimization software that they use to establish contracts. Chapter 3 evaluates shipment data and presents methods to measure carrier performance with a framework to assess robustness of providers. Chapter 4 evaluates the data which captures the acceptance and rejection of
explores techniques to integrate the performance measurement with optimization software
by adjusting rate and capacity values linking both shipment and acceptance data defined in
previous sections. Chapter 6 provides design criteria in developing a simulation model and provides an example of how simulation can be used to assess the robustness of an
2
Industry
Overview
The U.S domestic trucking industry is a critical component of the overall economy. The latest numbers from Standard & Poor's Industry Survey for Trucking indicate that for-hire truckload operations accounted for nearly $270B in truckload revenues during 2003 representing roughly 40% of total U.S. commercial freight (S&P 2004). Trucking continues to dominate the U.S. freight transportation mix with current ratios at 64 percent of total value hauled, 58 percent of total tonnage, and 32 percent of total ton-miles for 2002 across all modes including rail, air and ocean (BTS 2004). In addition, transportation labor of for-hire transportation accounted for 4.4 million jobs in 2003, which is roughly 3.5% percent of all domestic employment (BTS 2004).
The trucking industry is also highly correlated to industry trends. In examining the effects of regional and industry level sector shocks on aggregate business cycles, Ghosh and Wolf (1997) quantified differences between various economic shocks to determine the effects at the state and industry level. Their research found that the transportation sector, second only to the retail trade, was highly correlated to both regional and industry level economic shocks. This was perceived to be a result of the high level of dependence for transportation services in other industries. This dependence on transportation can be a key enabler to economic viability or, conversely, a limiting factor since macro level swings in aggregate business cycles require available capacity in the U.S. domestic trucking market. The interconnectedness to all industrial sectors and sensitivity to business cycles make the
relationship between shippers and carriers particularly interesting from a contracting perspective.
2.1
Shippers
Shippers purchase transportation services from for-hire truckload carriers under various governance structures including dedicated service, contracted capacity and spot market capacity. A dedicated contract requires the carrier to dedicate a set level of their capacity to a portion of a shipper's network typically focusing on freight that can leverage economies of scope for the carrier. Contracted capacity is generally considered the set of carriers, both primary and backup, who have negotiated rates with a shipper and have agreed to contract terms and rate structures as part of a formal agreement. Spot market capacity is typically channeled to the shipper though brokers and consists of capacity that is needed usually when contract carrier capacity has been exhausted.
Contracts with for-hire carriers typically last one to two years and typically have an addendum of rates and capacity which the carriers agree to as part of their commitment to a given shipper. Lanes in a contract can be defined individually from other lanes as discrete lanes, or combined as "package lanes" or "bundled lanes" meaning that the rates apply only if the shipper commits to all the volume on all lanes in the package. Addendums that define the discrete or bundled lanes are generally referred to the Schedule A and contains all lane awards which are defined as an origin point or region to a destination point or region for a fixed or variable rate such as a flat $500 fee per load or a rate per mile. Service and equipment requirements are also defined such as single or team drivers, and dry, refrigerated equipment making the rates very specific to a particular carrier offering.
Additional costs such as detention fees, stop charges, pallet charges and other costs known as accessorials are also included in the contract. In some cases, these fees are set by the shipper. If the carrier objects to the level or structure of the fees, and the shipper has enough leverage to demand a fixed accessorial fee, the shipper expects the carrier to adjust their line-haul rates to capture the discrepancies in accessorial fees (Harding 2005). This is a common shipper bidding strategy which allows the shipper to compare line-haul rates while maintaining fixed non-line-haul rates. Since the frequency of many accessorials charges are not known in advance, adjusting line-haul rates to reflect anticipated accessorial fees poses a challenge for carriers since converting these expected fees to a single line-haul rate leaves them exposed to lower profits or the possibility of losing the business as a result of uncompetitive pricing.
The process of defining a transportation network typically includes aggregation of historical shipment transactions into lanes with adjustments for projected growth or major supply chain redesign. Changes are inevitable and include adding, moving, adjusting, and deleting freight volume as a result of anticipated activities such as closing of facilities, acquiring new suppliers or mergers with other companies. This information is presented to carriers in the form of a reverse auction where the carriers provide rates and capacity limitations on the business they are interested in winning and the price is driven down in the interest of the buyer.
Once the analysis of the rates and the negotiations are complete, the shipper
constructs what is commonly referred to as a "routing guide". The routing guide is used to determine which carrier is assigned a specific load based on the lane and capacity of the carrier during execution. The routing guide takes on many forms in various degrees of
sophistication from 3x5 cards, to a central database, to sophisticated software integrated between shipper Enterprise Resource Planning (ERP) systems and carrier ERPs. These systems are known throughout the industry as a Transportation Management System
(TMS) and have many capabilities to manage transportation planning and execution. All of the data provided in this study were obtained from TMS technology.
Once contracts are agreed to by both parties and the bid is complete, shippers then transition to the carriers in the newly designed routing guide. This is the period of greatest risk for a shipper. It is common for a shipper to acquire hundreds of thousands of lane bids on thousands of lanes from tens or hundreds of carriers (see Table 2.1). The amount of transition in the network is of great concern to shippers because incumbent and newly introduced carriers are readjusting flows and learning new business requirements which vary at both the origin and destination. If the change is significant, the likelihood of carriers not being able to adjust during the transition is at its highest in the contracting period. Some shippers transition to new contracts during slower periods of their business cycle since the potential for a negative impact to their business is at its lowest.
A common phenomenon that occurs during the transition period, and auctions in
general, is the Winner's Curse (Capen, Clapp and Campbell 1971). The Winner's Curse states that the winning bid is a result of imperfect information. Carriers may not fully understand the cost implications of a shipper's business requirements and bid too aggressively. This would result in winning the business based on perceived value and ultimately lead to increased costs for the carrier due to imperfect information. Shippers are well aware of the Winner's Curse and, in some cases, will disregard an extremely low rate from an unfamiliar carrier because of the risk that it will lead to elusive savings. In
extreme cases, incumbent carriers may not reduce rates knowing that the high service level requirements of a bidding shipper are not well known to competing non-incumbent carriers. Shippers who use new carriers to leverage rate reductions with incumbent carriers will ensure the Winner's Curse when hidden costs are not well understood by the new carriers. Once the shipper transitions to the new carriers, the unexpected costs challenge the new carrier's commitment. When this occurs, there is a strong likelihood that the shipper will look to acquire the needed capacity in the previous incumbent base. Although these carriers have "lost" the bid, they have a good understanding of the real costs and have demonstrated service capability making them likely candidates for reevaluation. This is termed "Losing the bid, but winning the business" and is an outcome that is highly
undesirable from the perspective of the shipper. Unfortunately for shippers in this situation, not all carriers adhere to the rates that were provided in the bid resulting in increase costs.
Once the shipper has made the necessary adjustments during the transition, they are faced with updating their routing guides and evaluating carrier performance for the term of the contract. Shippers vary on the allowable grace period to settle into the new traffic flows from 0 to 6 months and may hold monthly or semi-annual meetings to review performance (Harding 2005). Shippers expect seasonal demand variations and communicate their expectations to the carriers to ensure that the execution of the contracts is performed satisfactorily to corporate objectives which are commonly focused simultaneously on high service and low cost. Interestingly, shippers are not the only entity in this relationship that deal with severe demand fluctuations. Carriers have equally unpredictable demand for their capacity since they are dealing with many shippers in many different industries each with their own seasonal requirements. The hope and expectation for both parties is that the
variances in supply and demand will balance out over time and that relationships can be maintained. It is precisely this balance, or lack thereof, that leads to unplanned freight. For the purposes of further discussion, "planned" freight refers to freight that is executed within the definition of the routing guide and typically represents budgeted freight costs.
Conversely, "unplanned" freight represents freight that is assigned to non-primary carriers which may be loosely defined in the routing guide using state level rates representing standard pricing, or not defined in the routing guide at all leading to spot market rates.
Once the carriers settle into the business, the management of the carriers and daily execution can occur through the capacity assignments designated in the routing guide; however, the project is termed a success or a failure before the contracting period based on estimated savings. How does this happen? In practice, results are based on estimated future direct costs on forecasted demand using the freight expense captured by lane from the previous period, not the actual freight hauled under contract over the contracting period (Harding 2005). Optimistic savings estimates have significant implications for shippers. Collecting widespread sub-market rates will understate planned (budgeted) costs because carriers will likely default on their commitments due to lack of profits leading to higher priced alternatives for the shipper. Sub-market rates result from bids that focus on
collecting the lowest rates and are commonly referred to in the industry as "rate shopping". Rates obtained from rate shopping strategies are commonly termed "paper rates" due to the lack of capacity they provide. Although optimistic savings estimates can lead to overstating expected benefit, bids with reasonable savings estimates are also at risk of overstating expected savings leading to increased freight expenditure. More will be covered on this common miscalculation in section 4.2.
2.2 Carriers
For-hire carriers fall into three basic categories: National, regional and owner operators (00's). National carriers generally service the entire continental United States, regional carriers focus on specific regions while owner operators are generally individuals or family businesses with 3 or less trucks. Well over 30,000 of the 45,000 estimated trucking companies are estimated to have annual revenues of less than $1 MM (S&P 2004). Five of the top carriers have revenues between $1.5 and $3B in an industry that is estimated to be roughly $268B (S&P 2004). Competitive analysis indicates that the industry is highly fragmented with very low barriers to entry. Low costs of operation and low capital costs contribute heavily to this fragmentation. More recent trends include increased
consolidation as smaller carriers have exited the business. This brings the estimated total number of domestic truckload motor carriers from 53,000 in 1994 (ATA 1994) to its current level of 45,000 (S&P 2004).
Carriers' generally perceive the competitive bidding process as the least desirable level of interaction with a shipper. Carriers with sufficient analytical and engineering services prefer to offer more custom-tailored solutions and generally stress the position that competitive bidding commoditizes their offerings and limits their total value proposition. Carriers prefer to work with their shipper customers one-on-one without the pressure from their competition. To offset the competition, national carriers have attempted to
differentiate their total offering by expanding their logistics services to include supply chain analysis, IT services, multi-modal capabilities and third party logistics services. For shippers with complicated transportation and logistics problems, this differentiation in carrier capabilities can reduce competitive bidding pressure by differentiating their
relationship with a shipper beyond the supply of capacity. Although carriers prefer to avoid competitive bidding, it is current standard practice in the industry.
Bidding Strategies
Given the wide range of competencies in the carrier market, bidding strategies vary considerably. Carriers with strong engineering capabilities will generally have a systems view of their network considering the impacts of new business on their existing network using sophisticated tools and techniques. This expertise provides a foundation to be selective when bidding on freight as they look to gain from economies of scope. Conversely, carriers with limited engineering capabilities will be limited to qualitative experiences to determine which freight is beneficial to the organization. Depending upon the competitive forces that carriers face and their ability to design a feasible and
competitive response, carriers will range significantly in their approach to a shipper. The following illustrates two generalized approaches that carriers employ when responding to competitive bids.
The most sophisticated approaches supporting bid response strategies utilize detailed execution level data collected from daily operations employing carrier ERP and satellite track and trace systems. This information supports the use of sophisticated tools including forecasting, yield management and activity based costing. Carriers use
technology to gain a competitive advantage in the bidding process with the intention to increase profit, increase efficiencies and balance flows in execution. One interesting example of this is the use of activity based costing to capture the expected delay in loading or unloading. Carriers currently employ systems that capture the duration of delays for
each load and unload point because delays are a key contributor to lost profits and a major focus for carriers. Excessive delays limit equipment utilization and lead to greater driver turn over, which are translated into increased rates for perpetrating shippers. These data provide a statistical basis for estimating expected inefficiencies and adjusting pricing in response to a bid. If the delays are consistently significant for specific locations within an origin or destination on a lane, rates can be adjusted based on engineered information to cover any negative impact to the carrier's network. Carriers with sophisticated software are also capable of measuring the impact of network effects of new business on profits, and will use this capability to assess a shipper's profit potential given their existing network structure. Economies of scope override economies of scale for carrier networks, and increased freight can lead to lower profits for carriers as a result of imbalances. Balanced flows in the network leads to profitability, not just increases in business. This phenomenon motivates carriers to reduce dwell time and empty miles to increase profits and is the motivation leading to a wealth of operations research based software solutions to manage carrier planning and execution in the market.
The least sophisticated approach is the most difficult challenge for shippers trying to establish new contracts. Carriers, without the capacity or sophistication, will bid aggressively and provide rates and capacity values that far exceed their operational
capabilities. Carriers do this with the intention of winning as much business possible. The reasoning behind such a strategy is that the carrier can utilize the transition period to determine which lanes stay in the carrier's network. The lanes that cannot be supported by the carrier are either supported through additional third party relationships (brokers) to cover the excess requirements, or simply dropped from the carrier's network leaving the
shipper with no capacity. This approach creates major problems for shippers because carriers who were not awarded this business must be contacted after the bid indicating (informally) that the shipper made a poor choice. The carriers who have lost the business have likely readjusted the capacity to other parts of their network and must consider yet another readjustment to service the lanes with the required capacity. This almost always leads to increased transportation costs and is something that shippers must try to avoid.
Market Forces and Strategy
The competitiveness within the carrier market also has an impact on the way that carriers bid. In periods of tight capacity, demand for carrier services are relatively higher forcing shippers to take new approaches to competitive bidding. Carriers who are part of core carrier programs may be given the first right of refusal prior to a competitive auction. This opportunity allows the carrier to determine where they can best serve a shipper with a focus on service and less significant competitive pressures. Carriers may also decide to extend contracts with shippers beyond the contracting period effectively locking in pricing beyond the agreed contracting period. In periods of over capacity, carriers may face increases in operating ratios that threaten their viability resulting in highly competitive bidding. Carriers have limited leverage when shippers decide to bid during these periods simply because the low demand for freight can result in bids with irrational pricing. This in turn results in a greater number of carriers with financial issues as the consolidation in the market continues.
2.3 Optimization Solutions for Shippers and Carriers
Optimization based bidding technology is widely available to help shippers optimize transportation rates and capacity. This technology enables shippers to address a large number of competing objectives by allocating capacity considering hundreds of thousands of rates, and capacity limitations at various network levels including lane, facility and system-wide. In addition to rates and capacity, these solutions must also consider unique business rules considering factors such as number of providers per geographical region, minimum or maximum revenue targets, and required minimum volume levels. Business rules that control the allocation of capacity are applied at various hierarchical levels in the transportation network. Examples of common business rules that are translated to optimization constraints include: "Limit the number of carriers in the East facility to 15", "Ensure that Carrier X is award at least 50 loads per week at the West Coast facilities", etc. The application of business rules for each bid is extensive and can lead to very large mixed-integer programs (MIPs) that include tens to hundreds of scenarios. Each scenario tests various strategies supporting decision making focused on the best allocation of capacity.
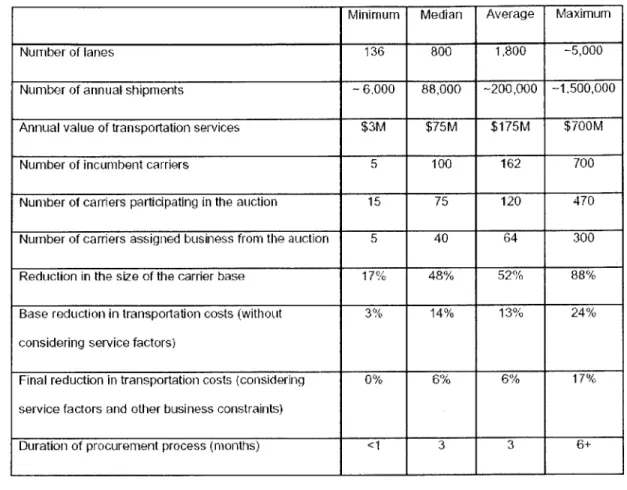
Optimization based bids range is size and scope. The following table illustrates project scope and potential opportunity using optimization tools based on bid size as defined by minimum, median, average and maximum statistics for roughly 50 bid events (Caplice & Sheffi 2005):
Minirnum Median Average Maximum
Number of lanes 136 800 1,800 -5,000
Number of annual shipments -6,000 88,000 -200,000 -1,500,000
Annual value of transportation services $3M $75M $175M $700M
Number of incumbent carriers 5 100 162 700
Number of carriers participating in the auction 15 75 120 470
Number of carriers assigned business from the auction 5 40 64 300
Reduction in the size of the carrier base 17% 48% 52% 88% Base reduction in transportation costs (without 3% 14% 13% 24% considering service factors)
Final reduction in transportation costs (considering 0% 6% 6% 17% service factors and other business constraints)
Duration of procurement process (months) <1 3 3 6+
Table 2.1 Size of Transportation Auctions 1997-2001
Formulations to optimize costs are fairly straightforward using operations research techniques. Auction theory refers to this as the Winner's Determination Problem (WDP) and is the basic formulation behind optimization and is defined below by Caplice & Sheffi (2005). Solved as a Mixed-Integer Linear Program (MILP), this formulation minimizes total cost as defined by various types of lane bids that carriers could provide including discrete lane bids and package, or combinatorial, bids which will be discussed in further detail.
Winner's Determination Problem with Discrete and Package Bids (Caplice & Sheffi 2005): Minimize: 1,
L~k[jZ
(Vz Z k k k y Ci j (I j V + Ji j (C I Subject to: c k C ji + I Ek kxi. > 0 C yi, ] ]7
=10, 1] X xij vi,]j Vi,],c, s,k Vc, k Indices i in Shipping Originj
in Shipping Destination c in Carrier Identificationk in Bid Package Identification
Decision Variables
exik in number of loads per time unit (week, month) on lane i toj, with
assigned carrier c, under package bid k
y 1 if carrier c is assigned to package bid k, 0 otherwise
Parameters
x Volume of loads on lane i toj that are being bid out
Scij Bid price per load on lane i toj , for carrier c as part of package k
The WDP has 4 main benefits which are summarized below:
I. It allows the combination of simple discrete bids to be considered with packaged bids which is difficult, if not impossible, to consider manually with a large set of discrete and package bids as a result of
interdependencies of capacity.
2. It allows the application of a wide range of constraints that represent business requirements. Shippers must quantify their business objects effectively in terms of modeling constraints to constrain the model to more operationally feasible solutions.
3. It allows non-financial trade-offs to be represented as rate adjustments using a Multi-Attribute Rating System (MARS) (McNamara, Nagle & Smith 1996). This is a key capability in addressing robustness in transportation planning. More will be discussed in Chapter 5 with examples.
4. It can be easily extended to other business constraints originating from both the shipper and the carrier. For example, carrier capacity is provided
by the carriers at many levels and applied to the WDP in the form of
capacity constraints. Carriers can bid on every lane, but limit their total capacity to a feasible level allowing the optimization model to determine where feasible capacity is most advantageous to the shipper without overburdening the carrier with too much volume.
Package bids have practical applications for carriers. WDP allows carriers the ability to express the combination of rates and capacity as separate bidding items known in auction theory as combinatorial bids. Song and Regan (2003) state that combinatorial auctions can be applied to any asset allocation process when complementarities and substitution effects exist and where bidders prefer bundled items over single items. With combinatorial bids, carriers can combine lane level bids into a bundle to capture economies of scope particularly where profitable operations are more likely. The shipper then awards all or none of the business ensuring that the discounted rates apply to the bundled package. Extensive work in combinatorial bids with applications in transportation has been
performed by Caplice (1996), Song and Regan (2003), Sheffi and Caplice (2003), Caplice and Sheffi (2005), Plummer (2003), and Hohner et al (2003).
In addition to modeling business constraints, some of the more advanced
formulations allow the application of penalty or bonus functions to reflect adjustments in the carrier's rate. The ability to consider adjustments to a carrier's rate for the purposes of quantifying additional factors is a system called "Multi-Attribute Rating System" (MARS) (McNamara, Nagle & Smith, 1996). This approach provides the ability to engineer
differences in rates for qualitative and quantitative factors. For example, if a carrier has a
99% on-time performance rate, this may equate to a -5% bonus adjustment to a rate since
on-time performance is highly valued. Conversely, carriers with a 75% on-time
performance may be penalized with a 25% reduction to their rate. The optimization would consider the adjusted rate in the objective function for modeling purposes.
An extension to the WDP formulation presented above is the application of hierarchical capacity constraints. Carriers need the flexibility to bid on many lanes but
limit their bid capacity to higher aggregate levels. This allows the carriers to bid
aggressively for more lanes than they can feasibly support, but constraining them at higher levels in the network. This effectively allows the carrier to win where their rates are competitive, but not win more volume than they can ultimately handle. As an example, a carrier can have only 5 units of capacity and bid on every lane which could exceed 2,000 units of capacity. As long as the carrier adds a system constraint of five units, that carrier will only win the five units where the capacity is most cost effective and part of the optimal solution.
The WDP has been widely adopted to solve procurement problems in
transportation, but there are inherent weaknesses in the WDP since rates and capacity are only two basic components in making a procurement decision. Equally important is the carrier service capability. The shipper's perception of service extends beyond simply arriving at the pickup location and final destination on time with a complete, undamaged load. It is also defined by the carrier's ability to fluctuate with demand and provide backup capacity in times of increased demand as the contracting cycle unfolds. Shippers also consider other service capabilities including on-time pickup and delivery, trailer pool management and accurate freight payment all of which can be addressed through
optimization solutions, or in most cases qualitatively from experience. The framework for a quantitative approach to the service problem is lacking in current literature and has been a difficult area for shippers to address using WDP based tools to solve their procurement problems.
The term "optimization" is widely used to describe the application of operations research to a complicated problem either minimizing or maximizing decision variables
subject to various constraints. However, the implication that actual transportation freight expenditure is optimized using an "optimization" software solution is a significant misrepresentation because it generates a solution independent of unplanned events.
Planned and unplanned freight are considered very differently in optimization software solutions. A significant characteristic of "optimized" output is that it represents what will occur as planned transportation freight expense. Unplanned freight is basically not considered. Thus, the inputs to optimization algorithms do not consider the cost of unplanned freight that is not only dependent on the level of cost reduction driven by the model, but also potentially increased as the optimization reduces total cost well below market rates. Unrestricted application of the WDP provides increased risk of unplanned freight volume leading to the potential of higher actual freight expenditures under the following conditions:
1) Accepting significantly lower than market rates will lead to less capacity
resulting in increased freight expenditure when replacement capacity is needed. 2) Acquiring new rates after a bid will result in decreased leverage since
negotiations are complete. This is because of the competitive pressure that results from greater volume awards is less prevalent.
3) Relationships with carrier organizations at the execution level can be a source of
strategic value. Moving to a new carrier may introduce a net loss of responsiveness and result in less committed capacity at a given rate. 4) Service failures have a significant cost in terms of higher freight expense
including service penalties from customers, lost production or higher supply chain costs as a result of transportation related inefficiencies.
Organizational strategy also influences the applicability of "optimization" as it applies to a shipper's network. A cost-focused shipper where transportation is a significant component of the costs of goods sold will have a more aggressive position on freight expense than an organization that is focused more on service. The risks and requirements, for example, to haul low value items such as paper towels are much different than high value products such as laptops or health care products.
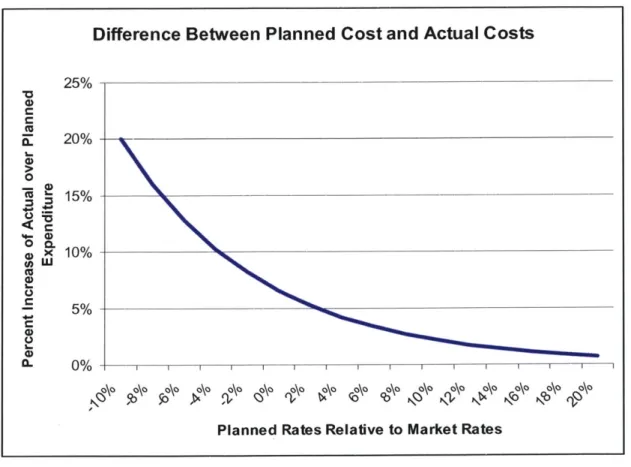
Difference Between Planned Cost and Actual Costs
25% 4) 20% 4-0 S15% 4 X 10% UJ -5% (.) I- 0% N 0 O N)N N N C~
Planned Rates Relative to Market Rates
Figure 2.1. Conceptual Difference Between Planned and Actual Costs
Figure 2.1 illustrates the concept of actual freight expense relative to planned freight expense in relation to market pricing. The concept is straightforward: the greater the negative difference between routing guide rates and market pricing, the greater the
actual freight expenditure will be relative to the planned freight expenditure. For rates that are much below market, the capacity will be less available leading to higher costs for alternatives and a greater percentage of freight that is unplanned. For rates that are much higher than market, the capacity will be a source of profit for many carriers and the costs will likely attract capacity from many carriers.
Is the optimal solution always to minimize planned cost? Arguably, shippers with
high value goods that have significant profit margin are not concerned at all about
differences between bid rates, particularly if service failures result in losses that far exceed the cost of a load, or the transportation is a miniscule fraction of the cost of goods. The effectiveness of the WDP for a service based solution is limited by the ability to restrain the algorithm by considering service-based criteria. This requires translating service into cost related benefits that the WDP can "optimize" by adjusting bids and capacity. In practice, measuring service is not trivial due to the subjective quality of service and the lack of data to support a quantitative approach. Conversely, shippers focused on cost reduction could conceivably increase actual freight costs without the proper restraints on the WDP if a large percentage of their freight is contracted well below market with carriers that do not share the notion of a strategic relationship, commit capacity to the rate, or experience economies of scope.
The service component is needed to truly optimize freight expense in all cases where the WDP provides analytical value for shippers. Whether shippers are focused on cost or service, they cannot accept the lowest cost solution across the entire network. Therefore, the focus on service always exists but varies only in scope and scale based on the needs of the shipper.
The remainder of this thesis addresses robust transportation planning techniques using the accumulation of transactions that occur between shippers and carriers. Tools and techniques to integrate performance into the WDP will be presented with a simulation that tests the robustness of an optimization. The purpose of this work is ultimately to improve shipper and carrier relationships by providing shippers a framework to not only assess carrier performance, but also to have at their disposal a foundation to build more strategic and mutually beneficial relationships with their carriers. More important, using
optimization software without properly considering service can be disruptive and lead to higher total direct freight expense. Although the techniques may appear to increase costs in the optimization, the objective of this work is to achieve the lowest total actual cost which is not the same as lowest expected costs based on a forecasted plan that assume 100% compliance.
3
Shipment Data and Robustness
When a shipper has obtained bid data from carriers and is considering future contracts there are five classes of information that can be used for the analysis of robustness:
1) Transactional data from the previous contracting period.
2) Routing guide data from the previous contracting period representing what was planned.
3) Qualitative experiences of the shipper.
4) Bid data itself collected from the carriers including rates and capacity.
5) Business information obtained from the carrier, or other sources, detailing carrier finance, operations, security, insurance, IT capabilities and
business strategy.
Each class of data is a form of input to the procurement decision making process and is, in essence, the raw data necessary for analysis. The synthesis of this information results in a strategic plan.
Transactional Shipment Data
Shipment data are widely available for shippers but seldom used to the fullest extent in procurement projects even though most TMS applications and freight payment systems provide detailed shipment information (Harding 2005). Although shipment transactions are the basis for defining the transportation network, shipment data can be further extended into detailed transportation metrics for specific carriers including volume flexibility or surge capability, adherence to planned costs, relative costs between same service and capacity of primary and backup carriers. For any detailed procurement process, shipment detail is mandatory for a quality network design since accurate representation of the shipper's network is a key component in enabling carriers to provide the most competitive pricing. Ambiguity of service requirements and fluctuations in demand typically lead to the Winner's Curse or hedging of the rates due to the uncertainty, both which are
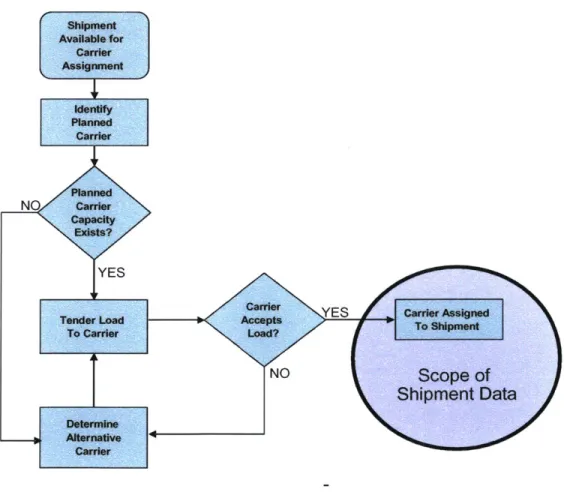
undesirable from the shipper's perspective. Historical shipment data typically includes origin, destination, shipment date, assigned carrier and line-haul cost. Although there are many benefits to using this information, there are also inherent limitations by focusing only on what was shipped and not the decisions that lead to the carrier assignment (see Figure
3.1).
Shipment data can also be used to measure the effectiveness of past procurement processes. Carriers that overbid are generally replaced during transitions to the new contracts. The success of the transition phase is easily captured by comparing shipment data to the initial version of the routing guide but is seldom performed in practice (Harding
Measuring the success of a transition by capturing where failures occurred and understanding the reasons is very useful at two levels: First, it helps shippers to adopt practices which prevent similar outcomes by measuring a carrier's bidding strategy. Secondly, this measurement captures the shipper's ability to make sound choices prior to transitioning. Measuring the effectiveness of past procurement projects in this manner provides a foundation for adopting and internalizing best practices for use in future procurement activities. The following representation of the transportation execution process illustrates what is captured by transactional shipment information in comparison to
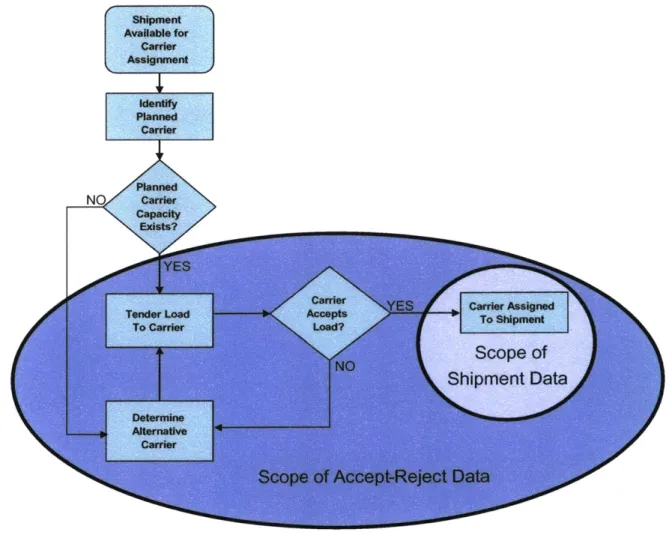
standard load planning processes:
Shipment Avallabe for carrier Assignment Identify Planned Carrier Planned NO carrier Exists? YES
Tonder Load Yceps ES Care Atsigned
To Carrier Load?ToSimn
NO Scope of
Shipment Data
Alter ate 3 o
Carrier
3.1 Carrier Performance Measurement
Carriers that perform well during periods of seasonal slowdowns may not perform as well during peak demand and vice-versa. Shipment data can identify carriers that provide higher levels of capacity on lanes than what was originally contracted as planned freight and the relative price difference for that additional capacity if rates are not the same throughout the year. Deviations from the planned freight costs may be the result of
inaccurate freight forecasts, unexpected lanes or primary carrier failure.
Carriers are not always formally defined in the routing guide as a primary or secondary carrier on a specific lane yet appear in the shipment data. Carriers are often assigned to shipments which are designated to other carriers in the routing guide. This outcome is sometimes the result of acquiring capacity on a very short notice. As a result, understanding the relative cost impact of a carrier that is consistently "saving the day" is also important since some carriers may take opportunities to charge significant premiums when capacity is tight, and others may charge closer to market rates. Other reasons for the use of carriers that are not in the routing guide include the shift of giving freight to carriers on lanes in which they have growing capacity as existing primary carriers lose the ability to service the lane.
Shipment data can also be used to assess carrier flexibility. Contracts generally include some level of volume expectation as part of the pricing (e.g. 5 loads per week at $1.23/mile). These levels are only targets and by no means fixed quantities since the variability in demand makes it impossible for all carriers to adhere to specific levels. A carrier's ability to fluctuate from period to period in maintaining capacity is a key component in developing a robust transportation plan and can be easily captured with
transactional shipment data. Carriers that can fluctuate and maintain volume commitments should be recognized for this capability. More on this topic will be presented regarding specific calculations under 3.2 Shipment Based Performance Metrics.
Changes Impacting Measurement
The most significant limitation in assessing carrier performance over a 1-2 year contracting period is driven by the fact that freight flows change over time. Any
comparisons to a specific plan must occur with the understanding of how and why the plan changed over time. However, this can be difficult in practice to maintain when analyzing shipment transactions. Capturing changes is a requirement to better utilize the information and losing that visibility would challenge more robust techniques for assessing carrier performance.
Each node in the network including suppliers, manufacturers, distribution centers, and customers is subject to change. Large suppliers may be added or deleted from
networks requiring significantly different inbound flows. Inventories may be repositioned between distribution centers impacting transportation flows. Forecasted freight volumes may be held confidential if they are associated with strategic initiatives. Network changes
effectively redirect flows impacting previously planned freight and create changes that require rebalancing capacity flowing differently than what was established in prior
contracting. Analyzing shipment data over periods when large-scale operational changes occur can give the appearance that carriers have not performed well if not properly captured. Conversely, carriers that are flexible enough to manage large scale changes in flows should recognized this service capability.
3.2 Shipment Based Performance Metrics
How are carriers measured? More important, how can carriers be measured where the analysis is integrated with optimization techniques or performance measurement that aids the development of a robust transportation plan? The following metrics were
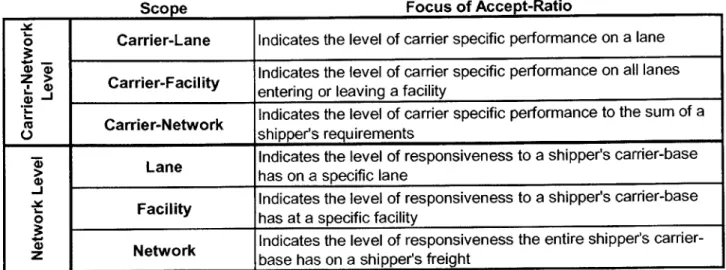
generated via standard spreadsheet and desktop database tools. This analysis can be used when making trade-offs between carriers where incumbent data exists. There are four levels of shipment aggregation that will be used throughout this thesis to represent the hierarchical levels found within transportation networks. Each of these levels provides a different view of carrier or network operations and all levels are important for assessing robustness.
The lowest level of shipment aggregation is the "lane" level which can be loosely defined as the geographic representation of origins, destinations and service and equipment requirements necessary for a contracting commitment. It is important to note that in some cases service, equipment and contract types are defined as part of a lane prior to bidding; in other cases, they are options that are considered when rates are provided by the carriers. This needs to be evaluated on a case by case basis when using any of the techniques in this section since lane definition is not always fixed and rates apply to different service levels or equipment options.
Lanes are defined from the facility level to the state or region level. There is a general relationship between the specificity of a lane and its volume that shippers use when collecting lane bids from carriers. In cases where volume is less predictable, lane origins (or destinations) are expanded in size to capture a level of volume needed to leverage better pricing from carriers. Where volumes are heavy, both the origin and destination are
specific to postal code or facility to allow the carrier a more accurate view of the volume requirements with the expectation of better pricing since there is little or no ambiguity in terms of operational or volume requirements for the carrier. A lane is defined as a discrete item for which a carrier bid can be received and it can be defined at any level from facility to state or custom region independently for both the origin and destination.
The next intermediate level of shipment aggregation is at the "facility" level
considering inbound and outbound direction separately. This separation is important when requirements are markedly different. In cases where manufacturing or distribution
processes are tightly coupled to transportation, carrier performance on the inbound side to a facility could be much more critical than on the outbound. Late arrivals for an inbound shipment that shuts down a production line have much greater ramifications than an outbound shipment to a customer that has flexible arrival times. For these reasons, facility aggregations are presented at the inbound and outbound levels.
The highest level of shipment aggregation is at the "system" level. Performance metrics calculated at this level reflect a carrier's overall performance with the shipper organization. The pooling of performance metrics to the system level can be effective in filtering out sporadic cases of poor performance, or elevating visibility of system-wide performance for comparative analysis across competing providers.
3.3 Shipment-Based Performance Metrics and Multi-Level Aggregation
The ability to weigh metrics at various levels in a network is important because the same shipment metrics can be used at various levels of aggregation to focus on a variety of carrier relationships ranging from the strategic relationship with the shipper to an