HAL Id: hal-01343169
https://hal.archives-ouvertes.fr/hal-01343169
Submitted on 7 Jul 2016
HAL is a multi-disciplinary open access
archive for the deposit and dissemination of
sci-entific research documents, whether they are
pub-lished or not. The documents may come from
teaching and research institutions in France or
abroad, or from public or private research centers.
L’archive ouverte pluridisciplinaire HAL, est
destinée au dépôt et à la diffusion de documents
scientifiques de niveau recherche, publiés ou non,
émanant des établissements d’enseignement et de
recherche français ou étrangers, des laboratoires
publics ou privés.
Distributed under a Creative Commons Attribution - ShareAlike| 4.0 International
License
Revealing stiffening and brittling of chronic myelogenous
leukemia hematopoietic primary cells through their
temporal response to shear stress
B Laperrousaz, L Berguiga, F.E. Nicolini, C. Martinez-Torres, A. Arneodo, V.
Maguer-Satta, Franck Emmanuel Nicolini, Françoise Argoul
To cite this version:
B Laperrousaz, L Berguiga, F.E. Nicolini, C. Martinez-Torres, A. Arneodo, et al.. Revealing stiffening
and brittling of chronic myelogenous leukemia hematopoietic primary cells through their temporal
response to shear stress. Physical Biology, Institute of Physics: Hybrid Open Access, 2016, 13 (3),
pp.06LT01 (1-6). �10.1088/1478-3975/13/3/03LT01�. �hal-01343169�
Revealing stiffening and brittling of chronic myelogenous leukemia
hematopoietic primary cells through their temporal response to
shear stress
B Laperrousaz1,2,3, L Berguiga2,4, F E Nicolini3,5, C Martinez-Torres1,2, A Arneodo1,2,6,7, V Maguer Satta2,3and
F Argoul1,2,6,7
1 CNRS UMR5672, Laboratoire de Physique, Ecole Normale Supérieure de Lyon, 46 Allée d’Italie, 69007 Lyon, France
2 Université de Lyon 1, 43 Boulevard du 11 Novembre 1918, 69100 Villeurbanne, France
3 CNRS UMR5286, INSERM U1052, Centre de Recherche en Cancérologie de Lyon, 28 rue Laennec, 69008 Lyon, France
4 CNRS UMR5270, Institut des Nanotechnologies de Lyon, INSA Lyon, 7 avenue Capelle, 69621 Viilleurbanne, France
5 Hospices Civils de Lyon, Hematology Department, CHLS, 165 Chemin du Grand Revoyet, 69495 Pierre Bénite, France
6 CNRS UMR5798, Laboratoire Ondes et Matière d’Aquitaine, 351 cours de la Libération, 33405 Talence, France
7 Université de Bordeaux, Campus de Talence, 351 cours de la Libération, CS 10004, 33405 Talence, France
Keywords: viscoelasticity, cell mechanics, cancer stem cells, wavelet transform analysis, chronic myelogenous leukemia, primary cells Supplementary material for this article is availableonline
Abstract
Cancer cell transformation is often accompanied by a modification of their viscoelastic properties.
When capturing the stress-to-strain response of primary chronic myelogenous leukemia
(CML) cells,
from two data sets of CD34+ hematopoietic cells isolated from healthy and leukemic bone marrows,
we show that the mean shear relaxation modulus increases upon cancer transformation. This
stiffening of the cells comes along with local rupture events, detected as reinforced sharp local maxima
of this modulus, suggesting that these cancer cells respond to a local mechanical stress by a cascade of
local brittle failure events.
Cell mechanics is recognized to control critical cellular functions and to be altered in different human diseases including cancer[1–10]. As such, cell mechanics may
help unravel the role of mechanical alterations in cell transformation processes and to quantify how malig-nant cells differ from healthy ones. Chronic Myelo-genous Leukemia (CML) has been described as a myeloproliferative disorder that arises from a single reciprocal chromosomal translocation t(9;22) leading to the formation of an oncogene(BCR-ABL) [11]. The
bone marrow cell density considerably increases dur-ing this disease, suggestdur-ing that the leukemic hemato-poietic cell deformability may also change[12]. The
purpose of this letter is to show that these cells not only become stiffer and more elastic upon transformation but that their ability to sustain a deformation is dramatically changed, as evidenced by enhanced local rupture events indicating a higher brittleness.
Previous studies of cancer cell elasticity[2,3] have
shown that, depending on the cell types and the con-text, the stiffness of cancer cells may increase[6,10] or
decrease[13] and their Young modulus distributions
may spread or shrink[5], when compared to healthy
counterparts. Recent advances in nanotechnologies have paved the way to single-cell mechanics studies. Atomic force microscopy(AFM) is one of the local probe method that has proved efficient to measure single living cell stiffness[14–20]. However, very few
studies consider that, during their deformation, living cells remodel their shape in real time by viscous or plastic effects that take over a part of the input energy. Such an assumption requires that the characterization of the cell response be not simply restricted to a single elastic parameter(Young’s modulus) [21]. One of the
major difficulties in capturing the relevant parameters that could describe the stress-to-strain response of a living cell comes from our lack of realistic models. As soon as we try to restrict the dynamical response of a living cell to a simple viscoelastic model, we lose an important information, namely its local and dynami-cal(active) adaptation to a given deformation. We take the opposite view in this study. Without hypothesizing
any model, we adapt sophisticated space-scale wave-let-based analyzing tools to capture, as accurately as possible, the dynamical signature of the force indenta-tion curves(FICs) recorded during a living cell AFM indentation. Prior to this study, this space-scale analy-sis was successfully applied to characterize AFM ima-ges of rough surfaces[22] and mechanical footprints
of isolated plant cell walls[23], to image living cells via
diffraction phase microscopy[24,25] and to capture
the passive micro-rheology of living adherent cells with AFM[26]. In the context of the present study, this
characterization provides evidence for local rupture events (brittle failures) that overwhelm the back-ground noise in the pathological case(CML). These brittle failures could constitute a new marker for cell resilience to deformation in cancer.
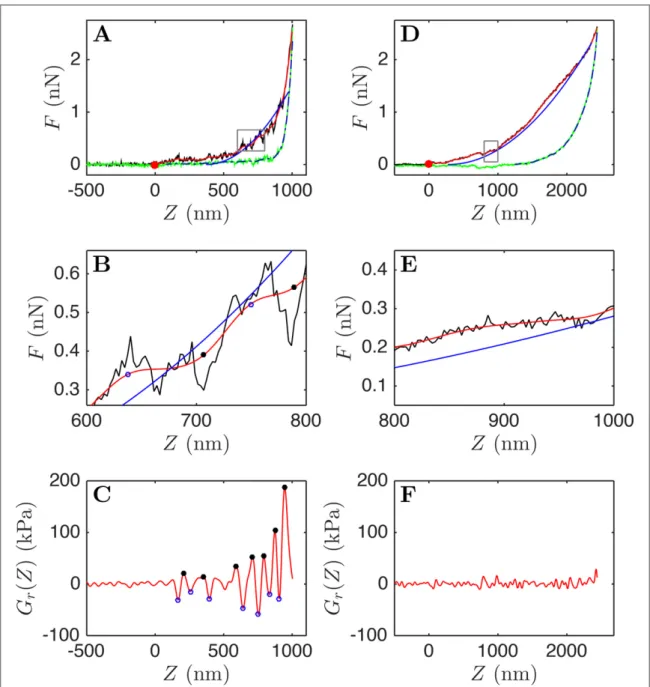
The nano-indentation of living cells was per-formed with an atomic force microscope(AFM) on single hematopoietic purified CD34+ cells from CML patient and healthy donor bone marrows(>95% pur-ity). Hematopoietic cells were immobilized on fibro-nectin-coated coverslips to avoid them slipping away from under the cantilever tip when performing the nano-indentation. We believe that this fibronectin adhesion assay is relevant because it is rather repre-sentative of physiological conditions observed in the human bone marrow that hosts the hematopoietic stem cell niche. Actually these cells are not in suspen-sion in their niche but actively adhere to stromal cells and to proteins of the extracellular matrix. The techni-cal description of the cell preparation, the AFM mea-surement and the force indentation curve (FIC) analysis is thoroughly described in the Supplementary data8. We focus more precisely on the local curvature of the FICs(figure1), that is characteristic of the shear
relaxation modulus Gr(Z) of the tested sample
(equation S7 in (see footnote 8)). We computed Gr(Z)
as a smoothed second-order derivative of the force curve F:T ( )[ ](F Z s, )
g2 (equation S14, S15 in (see
foot-note 8) and [23]). The variations of Gr(Z), for a fixed
scale s value(corresponding to an analyzing wavelet width of 60 nm), are illustrated in figures1(c), (f). This
width of the second derivative of a Gaussian g(2) ana-lyzing wavelet (see footnote 8) was optimized to smooth down the background noise. This smoothing is illustrated on the force curves infigures1(b), (e) that
werefiltered by a Gaussian function g(0)of the same width(red lines). We note that local peaks (extrema) in Gr(Z) can be clearly distinguished from the
back-ground noise for CML cells(figure1(c)). Interestingly,
none(or few) of these peaks can be detected for the healthy cells(figure1(f)). The number Npof maxima
for a given FIC and their mean amplitude G<p>along
the Gr(Z) profile will be used to distinguish healthy
from cancer cells in the next paragraph. We also notice that the left FIC(figure1(a)) presents three regimes, a
very slow increase of F, followed by a faster increase after 500 nm indentation depth, andfinally a much sharper increase beyond 800 nm indentation. It is thus quite impossible to extract a single shear modulus from this curve, that would requirefitting this curve by a single parabola, as predicted by a purely elastic Sned-don model[27]. Indeed, the slow increase of F in the
first regime is likely to be heavily influenced by the membrane and its outer sheath(gangliosides in the case of hematopoietic stem cells), whereas the third regime at the end of the force curve appears to be sen-sitive to the nuclear area. This is why we chose to focus on the middle part of this curve andfit the smoothed red curve by a parabola (plotted as a blue line in figures1(a), (b)), from which we get some
representa-tive estimate of a mean shear relaxation modulus(Gm).
The story of the indentation is completely different for the cell from an healthy donor(figure1(d)), where F
increases smoothly and can be better approximated by a parabolic shape(blue curve) with a single coefficient which will be considered as a mean shear relaxation modulus(Gm). In addition, the dissipation loss ratio is
computed from the work integral of the approach curve Wa(equation S2 in (see footnote 8)) and of the
retract curve Wr(equation S3 in (see footnote 8)) as
Dr= (Wa+ Wr)/Wa(equation S4 in (see footnote 8)).
Figure 2 summarizes the distribution of all the parameters: Gm, G<p>, Drand Np, computed from two
large sets of single cell FICs collected from 5 CML patients(red — 1302 force curves — 51 cells) and 5 healthy donors(blue — 1672 force curves — 60 cells). Figure2(a) shows the histograms of Gmvalues whose
medians clearly indicate that the CML cells are stiffer (Gm= 705 Pa) than the healthy ones (360 Pa). We note
also that in the healthy case, 50% of FICs bear a mean shear relaxation modulus smaller than 350 Pa, whereas in the cancer case the histogram of Gmvalues
is much wider and has a maximum around 700 Pa, meaning that the transformed hematopoietic cells in CML are about twice stiffer on average than their heal-thy counterpart, confirming previous observations in other leukemia[1,4,10]. Our analysis of the local
cur-vature of the force curves, via the detection of their local maxima, provides an important clue to the understanding of how these cancer cells can adapt to a deformation. The distribution of the mean value of the maxima height G<p>is illustrated infigure2(b). These
local values of the shear relaxation moduli G<p> (corresponding to the peaks of Gr) are much larger
than Gm averaged over the indentation curve
(figure 2(a)); they indeed describe very local events
occurring at scales below 60 nm(the size of the analyz-ing wavelet). The histogram of G<p>values is not only
shifted to larger values in the pathological case(with a median= 24 kPa slightly larger than 19 kPa in the healthy case), but is also more asymmetric, spreading to twice larger values than for the healthy case. The comparison of the distributions of dissipation loss ratio Dr(figure2(c)) leads to two main observations: 8
See Supplementary Materialfile for a more detailed description of
materials and methods, cell culture and analysing tools.
the cancer cells appear less viscous(median Dr= 0.57)
than the healthy ones(median Dr= 0.63), and there is
also a significant fraction of FICs corresponding to low dissipation loss ratio Drin the[0.2; 0.4] interval for
cancer cells that has no counterpart in healthy cells. Importantly, the statistical sampling of the force curves with detectable local maxima is not the same in cancer(87% of the FICs) and healthy (64% of the FICs) cells. In the former, not only the amplitude of these local shear relaxation modulus maxima increa-ses but their probability of occurrence also increaincrea-ses,
whereas the length of the indentation curves rather tends to decrease(by a factor two on average). This would therefore give a reduction of the density of these local failure events by a factor of three from cancer to healthy cells. This conclusion is corroborated by the percentage of FICs showing a given number Np[from
0 to 10] of Grlocal maxima(figure2D). More than
50% of the force curves from healthy donors do not contain any failure event or at the very most a single event, as compared to only 25% of the force curves from CML patients. This means that the excess of
Figure 1. Illustration of FICs and shear relaxation moduli Gr(Z) (see (see footnote 8)) from two CD34+ cells selected from a CML
patient(a) (c) and a normal donor (d) (f).(a), (d) F(Z) curves showing both the approach (black) and retract (green) curves. The red
curves correspond to some smoothing of the original FICs with a low passfiltering Gaussian g(0)(see footnote 8). The blue curves are
parabolic parametrizations of the FICs, that match their local derivative in their middle part, the pre factor giving some estimate of the
mean shear relaxation modulus Gm(see text). The dashed dark grey curves outline the part of the retract curves which is used for the
computation of the recovered work after releasing the stress.(b), (e) Zooms of (a), (d) highlighting the presence of a large number of
rupture events in the CML case.(c), (f) Gr(Z) computed with a second derivative of a Gaussian with the same width as the Gaussian
filter used in (a), (d). The black dots (resp. blue circles) correspond to the local maxima (resp. minima) of Gr(Z) selected according
the criteria thatΔ Gr(Z) between two neighbouring extrema > 25 kPa. These local extrema positions are reported on the FIC zooms in
failure events observed in a majority of cancer FICs is a clear signature of the mechanical transformation of these cells. It is also quite informative to look for both cases at the two quantities G<p>and Dron each subset
of FICs with a given number of Grmaxima. The
box-plots offigure2(e), (f ) show for each subset, the
med-ian(horizontal line), the quartiles (25% and 75%) as the limit of the vertical boxes, and the 10% and 90% percentiles as the edge of the thinner lines. The outliers are plotted as single dots. The color of the box-plots is
proportional to the percentage of FICs used to com-pute these boxes, as given by the histogram in figure 2(d). We note that the distinction of the Dr
values between cancer and healthy cells is more pro-minent on the FICs with a number of peaks Npin the
range of 2 to 4, corresponding to 44 % of the FICs in cancer cells and to only 24 % in healthy cells. The out-liers with a much lower Drare also much more distant
from the quartiles boxes in cancer than in healthy cells. Finally, when comparing the amplitude of the local Gr Figure 2. Comparison of the global(Gm, Dr) and local (G<p>, Np) histograms computed from 5 CML patients (red 1302 force
curves collected from 51 cells) and 5 healthy donors (blue 1672 force curves collected from 60 cells.) (a) Histograms of the mean
shear relaxation modulus Gmestimated from a large scale parametrization of the NFICFICs with a parabola function(see text). (b)
Histograms of the local shear relaxation moduli G<p>computed as the mean of the local maxima values of Gr(Z) for each FIC (see figure1(c), (f)). (c) Histograms of the dissipation ratio Drdescribing the ratio of the loss work over the indentation work.(d) Histogram of the number of local maxima Npof Gr(Z) per curve. (e) Box plots of the dissipation ratio Dr, taking the number of local maxima Npper curve as a class variable.(f) Box plots of the local shear relaxation moduli G<p>, taking the number of local maxima Np per curve as a class variable.
maxima, averaged over the different peaks on each FIC (figure2(f)), we notice again an amplification of these
maxima amplitude in the cancer case, and the repor-ted box-plots show that the greater amplification also occurs for FICs with Npranging from 2 to 4. This is a
strong indication that CML cells have the propensity to become(at least locally) stiffer and less viscous than healthy cells. Let us emphasise that the extreme varia-bility in the viscoelastic properties of cancer cells obtained from the analysis of our overall sample of 1320 FICs from 51 CML cells is quite representative of the results obtained for each individual CML patient.
This study suggests a possible recognition of can-cer transformation in leukemia through local singular events that would sign local failure of the cell cytoske-leton cohesion. Given that the cytoskeletal elasticity is elaborated by a complex interplay between active and cross-linked biopolymer networks[28–30], the quick
adaptation of these cross-links is essential for the abil-ity of living cells to sustain local shear stress without failure. If these cross-links are tight and less active, elastic behaviour of these networks can become locally nonlinear, making the cell looking much stiffer upon applied stress [30,31]. In that case a brittle failure
involving a collective unbinding of cross-links may occur, leading to a catastrophic loss of network integ-rity[32]. In CML, the BCR-ABL fusion gene is
detec-ted in up to 95% of CML patients and gets transladetec-ted into an oncoprotein p210BCR/ABLthat has increased tyrosine kinase(TK) activity and increased binding to the actin cytoskeleton [33] compared to the p145
Abelson protein. The interaction of p210BCR/ABLwith F-actin was shown to induce its redistribution into punctate, juxtanuclear aggregates[34]. In addition, the
interaction of p210BCR/ABLwith other actin-cross link-ing proteins such asα−actinin and fimbrin (by simili-tude with the c-Abl F-actin-binding domain) could modify the actin cytoskeleton mechanosensitivity properties[34,35]. To summarise, we have shown in
this study that upon elastic stiffening, CML CD34+ hematopoietic cells respond very abruptly to a local mechanical stress, by a cascade of local brittle failure events, whereas healthy CD34+ hematopoietic cells are able to maintain their network integrity by a rapid network adaptation (ductile failure). These results open new perspectives in the understanding of how leukaemia cells can withstand mechanical constraints exerted by their microenvironment to promote their survival and drug escape[36–39].
Acknowledgments
This study was funded by Agence Nationale de la Recherche ANR-10-BLAN-1516, INSERM(Plan Can-cer 2012 01-84862), CNRS, Novartis, Ligue Nationale contre le Cancer(Saone et Loire) and Cent pour Cent la Vie. BL is the recipient of a PhD fellowship from the
French government and by the Ligue Nationale contre le Cancer, CMT PhD fellowship was partly supported by CONACyT, Mexico.
References
[1] Rosenbluth M J, Lam W A and Fletcher D A 2006 Biophys. J.90
2994 3003
[2] Suresh S 2007 Acta Bio.3 413 38
[3] Brunner C, Niendorf A and Käs J A 2009 Soft Matter5
2171 8
[4] Cai X, Xing X, Cai J, Chen Q, Wu S and Huang F 2010 Micron
41 257 62
[5] Lekka M 2012 Nat. Nanotechnol.7 691 2
[6] Ketene A N, Schmelz E M, Roberts P C and Agah M 2012
Nanomedicine: Nanotechnol. Biol. Med.8 93 102
[7] Byun S et al 2013 Proc. Natl Acad. Sci.110 7580 5
[8] Wang B, Lançon P, Bienvenu C, Vierling P, Di Giorgio C and
Bossis G 2013 Micron44 287 97
[9] Rother J, Nöding H, Mey I and Janshoff A 2014 Open Biol.4
140046
[10] Zheng Y, Wen J, Nguyen J, Cachia M A, Wang C and Sun Y 2015 Sci. Rep.5 7613
[11] Pasternak G, Hochhaus A, Schultheis B and Hehlmann R 1998
J. Cancer Res. Clin. Oncol.124 643 60
[12] Jones D 2010 Neoplastic Hematolopathology: Experimental and
Clinical Approches(New York, NY: Humana)
[13] Sokolov I 2007 Atomic force microscopy in cancer cell research
Cancer Nanotechnology(Valencia, CA: American Scientific)
pp 1 7
[14] Radmacher M, Tillmann R W and Gaub H E 1993 Biophys. J.
64 735 42
[15] Radmacher M 2002 Methods in Cell Biology68 67 90
[16] Jena B P and Horber J K H 2002 Atomic Force Microscopy in Cell
Biology(San Diego, CA: Elsevier)
[17] Hecht F M, Rheinlaender J, Schierbaum N, Goldmann W H,
Fabry B and Schäffer T E 2015 Soft Matter11 4584 91
[18] Cartagena Rivera A X, Wang W H, Geahlen R L and Raman A
2015 Sci. Rep.5 11692
[19] Dokukin M and Sokolov I 2015 Scientific Report5 12630
[20] Abidine Y, Laurent V M, Michel R, Duperray A and Verdier C 2015 Eur. Phys. J. Plus130 202
[21] Kiessling T R, Herrera M, Nnetu K D, Balzer E M, Girvan M, Fritsch A W, Martin S S, Kas J A and Losert W 2013 Eur.
Biophys. J.42 383 94
[22] Roland T, Khalil A, Tanenbaum A, Berguiga L, Delichère P, Bonneviot L, Elezgaray J, Arneodo A and Argoul F 2009 Surf. Sci.603 3307 20
[23] Digiuni S, Berne Dedieu A, Martinez Torres C, Szecsi J,
Bendahmane M, Arneodo A and Argoul F 2015 Biophys. J.108
2235 48
[24] Martinez Torres C, Berguiga L, Streppa L, Boyer Provera E, Schaeffer L, Elezgaray J, Arneodo A and Argoul F 2014 J.
Biomed. Opt.19 036007
[25] Martinez Torres C, Laperrousaz B, Berguiga L,
Boyer Provera E, Elezgaray J, Nicolini F E, Maguer Satta V,
Arneodo A and Argoul F 2015 J. Biomed. Opt.20 096005
[26] Martinez Torres C, Arneodo A, Streppa L, Argoul P and
Argoul F 2016 Appl. Phys. Lett.106 034102
[27] Sneddon I N 1965 Int. J. Eng. Sci.3 47 57
[28] Khan S M, Ali R, Asi N and Molloy J E 2012 Commun. Integr. Biol.5 39 42
[29] Huber F, Schnauß J, Ronicke S, Rauch P, Muller K,
Futterer C and Kas J 2013 Adv. Phys.62 1 12
[30] Jensen M H, Morris E J and Weitz D A 2015 Biochim. Biophys. Acta1853 3038 42
[31] Ehrlicher A J, Krishnan R, Guo M, Bidan C M, Weitz D A and
Pollak M R 2015 Proc. Natl Acad. Sci.112 6619 24
[32] Sadhukhan P, Schumann O and Heussinger C 2014 Eur. Phys. J. E37 58
[33] McWhirter J R and Wang J Y J 1991 Mol. Cell. Biol.11
[34] McWhirter J R and Wang J Y 1993 The EMBO Journal 12 1533 46
[35] Goldman J M and Melo J V 2003 N. Engl. J. Med.349
1451 64
[36] Bissell M J and Labarge M A 2005 Cancer Cell7 17 23
[37] Bissell M J and Hines W C 2011 Nat. Med.17 320 9
[38] Lu P, Weaver V M and Werb Z 2012 J. Cell. Bio.196 395 406
[39] Laperrousaz B, Jeanpierre S, Sagorny K, Voeltzel T, Ramas S, Kaniewski B, Ffrench M, Salesse S, Nicolini F E and
Maguer Satta V 2013 Blood122 3767 77