Effect of Permeation on Discharge Characteristics of
Capacitive Deionization Process
By Ishan Barman
B.Tech., Mechanical Engineering
Indian Institute of Technology, Kharagpur, 2005
SUBMITTED TO THE DEPARTMENT OF MECHANICAL ENGINEERING IN PARTIAL FULLFILMENT OF THE REQUIREMENTS FOR THE DEGREE OF
MASTER OF SCIENCE IN MECHANICAL ENGINEERING AT THE
MASSACHUSETTS INSTITUTE OF TECHNOLOGY June 2007
C Massachusetts Institute of Technology.
All right reserved.
Signature of Author ... ... ... .. ... ,? ... Department of Mechanical Engineering
· ya
May
•07
Certified By
... ... .
.
.
.
...
Na
P. Suh
Ralph E. and Eloise F. Cross Professor of Mechanical Engineering Thesis Supervisor
Accepted By ... ... ...
Lallit Anand Chairman, Departmental Committee on Graduate Studies
Dep.nrtment nf M.echnnicnl PEninnP.erin1
ARCHVES
OF TEOHMiOLOGY
SlA
0-
3 2
008
LIBRARIES
Effect of Permeation on Discharge Characteristics of
Capacitive Deionization Process
by
Ishan Barman
Submitted to the Department of Mechanical Engineering on May 19, 2007, in partial fulfillment of the requirements for the Degree of Master of Science in
Mechanical Engineering
Abstract
Cost-effective desalination of seawater can be a panacea for the growing freshwater crisis that ranks alongside the problems of shortage of viable energy resources and global warming in terms of its frightening global spread and magnitude. However, the energy guzzling nature of the existing desalination technologies has resulted in very limited relief characterized by a meager 0.3% contribution to the annual water use. In recent years, capacitive deionization (CDI) has been reported to potentially solve some of the crucial issues that have plagued the classical desalination processes. CDI is a low-pressure, non-membrane desalination technology that employs the basic electrochemical principle of adsorbing ions in a capacitive fashion to high surface-area electrodes such that the outgoing stream becomes devoid of the ions that were present in the incoming stream. Although the power efficiency of CDI is nearly an order-of-magnitude superior to the existing processes, it is plagued by the problem of low water recovery ratio. The costs of pumping and pre- and post-treatment of water added to the rising costs of surface water makes maximizing the recovery ratio a priority. Moreover, the throughput of the plant is related to the water recovery
ratio.
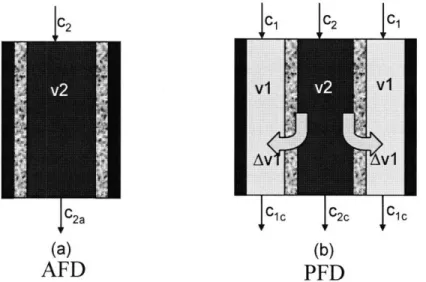
To drastically reduce the problem of low water recovery ratio while still maintaining the sizeable power consumption advantage of the CDI process, we propose a capacitive deionization process with permeating flow discharge (PFD). In PFD, the waste water is permeated through the porous electrodes rather than flowing in-between the electrodes as is the case in the conventional axial flow discharge (AFD) process. We hypothesize that the rate of removal of ions from a channel setup is higher for a process that is influenced by solvent drag (PFD) than for one which
is diffusion limited (AFD), given the same flow conditions.
A table-top setup, designed to simulate the AFD and PFD processes, is used to obtain precise experimental evidence for the ion removal rate for each process. A mathematical model based on unsteady convection-diffusion process for AFD and membrane transport process for PFD is presented. We find that over smaller time scales, permeating flow is much more efficient in removing the ions detached from the electrical double layer in the porous electrode. Based on our experimental observations, we observe that the use of the PFD process, under conventional operational conditions, can cause a discharge time reduction by at least a factor of two. Numerical simulations carried out on the basis of this model are shown to compare favorably with the experimental observations. The model predicts that the reduction in discharge time translates to an increase in water recovery ratio by approximately 30 percent. Moreover, the clear superiority in power efficiency is not surrendered by employing this new scheme.
Thesis Supervisor: Nam P. Suh
Acknowledgements
Delving into the intricacies of desalination has been one of the most wonderfully rewarding experiences of my life. It has been challenging at all times to deal with a project of such far-reaching consequences but the intellectual stimulation it has provided me has been worth the journey. And the ride would not be what it has been if not for all the support that I have received
from some truly remarkable people.
First and foremost, I would like to acknowledge the unwavering support and insightful guidance of Professor Nam P. Suh. Without his resourcefulness and creative inputs, the project would have faltered many a times. His enthusiasm for the project did not flag even when he shifted to KAIST. It has been a pleasure to work with a man of his stature, understanding and experience. Through my interactions with him, I have grown as a researcher and as a person.
I also owe a great deal of gratitude to Professor Sang-Gook Kim, whose suggestions and advice has proven invaluable in shaping the thesis into its current form. Dr. Taesik Lee deserves a lot of credit for keeping a constant tab on the project, and even undertaking to help out with the experiments performed. He has also provided an excellent sounding board for all our ideas and an able negotiator for the conflicts we have had during the process. Dr. Gyunyoung Heo, for the time he was associated with the project, contributed immensely, especially on the experimental front. He was instrumental in setting up our apparatus, right down to the nuts and bolts.
I would take this opportunity to thank all my labbies: Steve, AJ, Malin, Hrishi, Pete, Jordan and Eric. They have eased the trials and tribulations of adjusting to life at MIT and, of course, of the research itself. Our group meetings have provided me with a ready source of feedback. We have shared much more than a dour academic existence and our bonding has provided me with a source of sustenance on many an occasion. Thanks are also in order for Tony Pulsone for the skillful maneuvering that has been needed at times.
I am indebted to my professors at IIT Kharagpur, especially Professor Sujoy Guha and Professor S. K. RoyChowdhury. Professor Guha taught the ABCs of research, showing me the ins and outs of an academic life. And needless to say, I would not have survived even my freshman year had it not been for the life support system provided by Professor RoyChowdhury.
My friends, from Kolkata and Kharagpur, deserve a special mention. My conversations and emails with each and every one of them has let me lead a normal existence. I cannot thank them enough for that. Two of them deserve a special mention in this regard. Shiladitya, especially for the period when he was at Tufts, has given me a helping hand, right from groceries to MEMS. Our conversations must have made Cingular rethink their phone plans. A special token of thanks needs to go out to Damayanti. She has provided me with a constant sounding board. Her enthusiasm in listening to the electrochemistry of desalination must be commended.
Finally, I do not know where and how to start thanking my parents. There are no words to express my feelings of gratitude and really anything I will put down does not do justice to their efforts. They have always - with a capital A - believed in me and my pursuits. Never have they had anything but words of encouragement and support. Baba and Ma, I would like you to know that one cannot have better mentors, friends and guides than you have been.
Table of Contents
ABSTRACT ... 3 ACKNOWLEDGEMENTS ... 5 TABLE OF CONTENTS ... 7 LIST OF FIGURES...9 LIST OF TABLES... ... 12 CHAPTER 1: INTRODUCTION ... 13CHAPTER 2: REVIEW OF DESALINATION TECHNOLOGIES ... 21
CHAPTER 3: PROPOSED APPROACH ... ... 31
CHAPTER 4: MATERIALS AND METHODS ... 40
CHAPTER 5: MODEL FORMULATION ... 47
(a) Analysis of the charging process ... 48
(b) Analysis of the Axial Flow Discharging (AFD) process...52
(c) Analysis of the Permeating Flow Discharging (PFD) process.... ... 55
(d) Solution Procedure ... 64
CHAPTER 6: RESULTS AND DISCUSSION ... 67
6. (a) Charging process ... 67
6. (b) Axial Flow Discharging process ... 69
6. (c) Permeating Flow Discharging process ... 73
6. (d) Comparison of Performance Metrics ... 78
CHAPTER 7: CONCLUSION... 85
List of Figures
Fig. 1. (a) Source water classification: Global market (left) and US market (right)
(adapted from [27]) 21
(b) Desalination process classification: Global market (left) and
US market (right) (adapted from [27]) 22
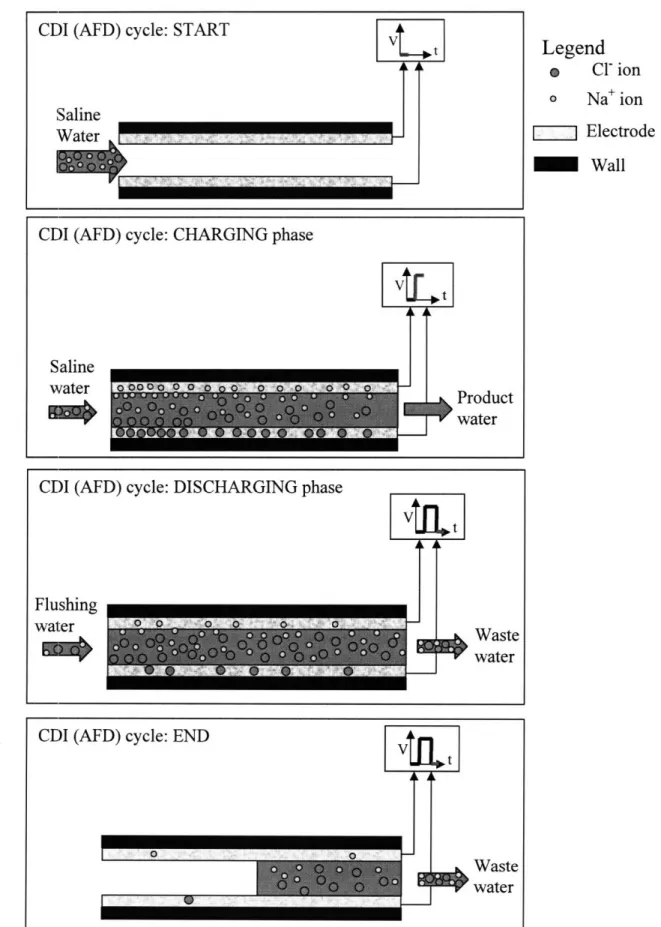
Fig. 2: Multi-Stage Flash distillation (once-through process) (adapted from [28]) 22 Fig. 3: Schematic diagram of the reverse osmosis process [29] 24 Fig. 4: Schematic diagram of an EDR process in operation (adapted from [30]) 25 Fig. 5. (a) Spiral wound flow-through capacitor as designed by Andelman [34] 26 (b) Stacked flow-through capacitor as described by Andelman [34] 27 Fig. 6: Flow-along-serpentine-path desalination apparatus, designed by Farmer ([36], [37]) 28 Fig. 7: Representation of one complete cycle of the capacitive deionization process
working in axial flow discharge (AFD) mode 33
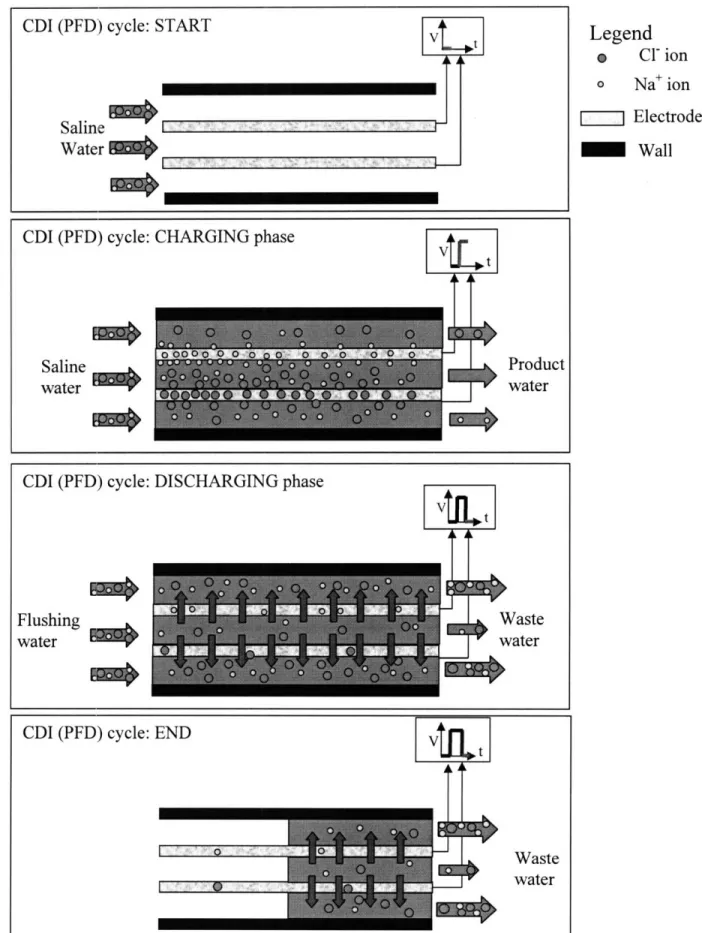
Fig. 8: Representation of one complete cycle of the capacitive deionization process
working in permeating flow discharge (PFD) mode 37
Fig. 9: (a) Three concentric tubes' embodiment (Top); 40
(b) Shell-and-tube design (bottom) 40
Fig. 10: Schematic diagram of the AFD and PFD setups employed. Flow velocities
shown are relevant to the discharging phase only. 41
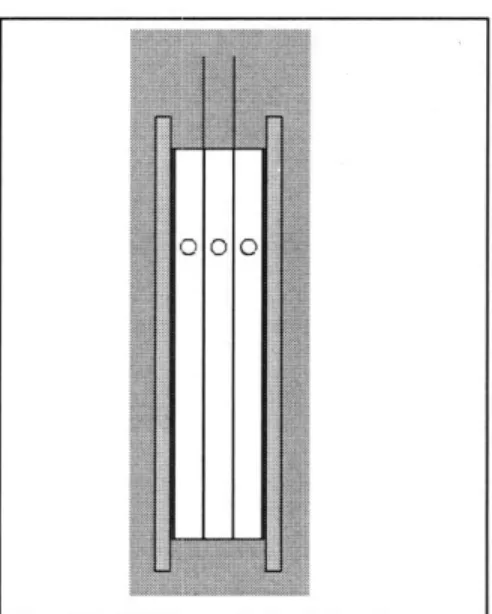
Fig. 1 : CAD model of the three channel setup (exploded view - left; isometric view -right). The parts clearly visualized are: polypropylene sheets (purple); rubber gasket (brown); aluminum foil (yellow); polypropylene channel frames (white); carbon
aerogel (black). 41
Fig. 12: CAD model of the three channel setup - front view 42 Fig. 13: SEM images of carbon aerogel paper: SEM 22x (left); SEM 200x (right) [47].
At smaller magnification, the paper has a planar appearance. At higher resolutions, distinct fibers traversing through the pores in the material are visible. 43 Fig. 14: Schematic diagram of fluidic circuit employed in PFD process.
The components indicated in the figure are: reservoir (1); wye (2); connecting tube (3); peristaltic pump (4); retainer plate (5); carbon aerogel electrode (6);
valve (7); collecting beaker (8). 45
Fig. 15: Schematic diagram of the charging process showing the electromigration phenomenon. Positively charged ions (green) move towards the negatively charged electrode and the negatively charged ions (orange) migrate towards
Fig. 16: Double layer capacitor with EDL formation due to coupling between electrode and ions. The dotted lines, on either electrode, depict the Debye length (not drawn to scale) within which the EDL forms. A simple circuit representation of the DLC is shown on the right, where Cdl is the capacitance in the EDL, RAR is the faradaic
parallel resistance and R8 1o is the electrolyte resistance. 48
Fig. 17: Schematic diagram of the axial flow discharging process showing diffusion from the
walls and axial convection. 52
Fig. 18: Schematic diagram of the permeating flow discharging process showing permeation
through the porous electrodes. 55
Fig. 19: Permeating flow discharge across a carbon aerogel paper, which was positively
polarized during the charging phase (AP = Pm - Po; Ac = cm - co.) 58
Fig. 20: Plot of current versus time obtained during the charging experiments for AFD and PFD setups. The solid lines connect the experimentally obtained data points. The
dashed lines are the best fit exponential curves through these data points. 67 Fig. 21: Plot of permissible charging time versus flow rate for different values of
permissible output concentration. The blue line, red line and black lines map the expected charging times for cprm equal to 30 ppm, 15 ppm, and 5 ppm below the
input concentration respectively. Charging current parameters employed:
10o = 19.6 mA and = 14.16 min. 68
Fig. 22: Plot of percentage of ions removed as a function of time for the AFD process at a prescribed flow rate of 16 ml/min. In the legend, 2h refers to distance between the aerogel electrodes and f is the effective electrode volume, Vy. 69 Fig. 23: Plot of discharging current versus time for the AFD setup. The blue line connects
the experimental data points and the red line gives the best fit exponential through the set of data points. For the exponential curve, Io = 13.39 mA and r = 10.82 min. 70 Fig. 24: Plot of mass of ion removal as a function of time for different flow rates of the AFD
process. 72
Fig. 25: Plot of percentage of ions removed as a function of time for the PFD process at a flow rate of 16 ml/min. In the legend, 2h refers to distance between the aerogel electrodes and f is the effective electrode volume, Vp. The percentage of ions removed was calculated as the number of ions removed at any instant of time divided by the total mass of ions detached from the paper in three time constants
(multiplied by 100 to convert to a percentage). 73
Fig. 26: Plot of discharging current versus time for the PFD setup. The blue line connects the experimental data points and the red line gives the best fit exponential through the set of data points. For the exponential curve, Io = 9.20 mA and t = 12.98 min. 75
Fig. 27: Plot of percentage of ion removal as a function of time for different flow rates of the
Fig. 28: Plot of mass of ion removal as a function of time for different porosity values for a
PFD process employing flow rate of 16 ml/min. 77
Fig. 29: Plot of percentage ion removal as a function of time for the AFD and PFD process. The topmost curve quantifies the percentage of ions detached from the electrical
double layer of the capacitive electrodes. 78
Fig. 30: Plot of water recovery ratio (standard) as a function of the discharge percentage for
different flow rates of the AFD and PFD processes. 79
Fig. 31: Plot of modified water recovery ratio as a function of the discharge percentage for
different flow rates of the AFD and PFD processes. 80
Fig. 32: Plot of throughput as a function of the discharge percentage for different flow rates
List of Tables
Table 1 Classification of desalination technologies based on the physics of the individual
processes 18
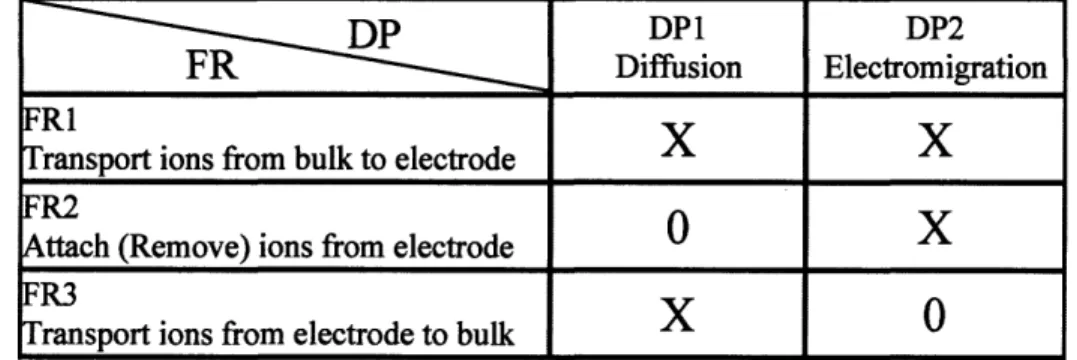
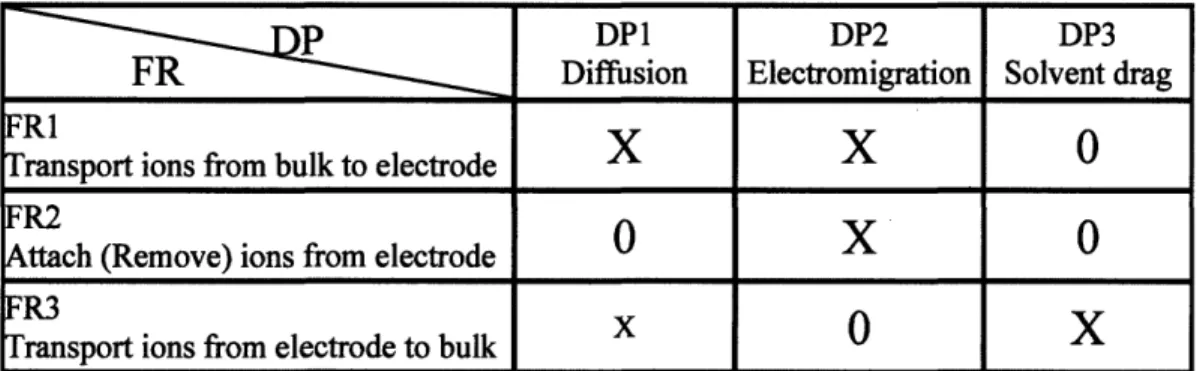
Table 2 Performance comparison of the major desalination processes 19 Table 3 Cost comparison of RO and CDI (adapted from [23]) 19 Table 4 FR-DP mapping for capacitive deionization with axial flow discharge 35 Table 5 FR-DP mapping for capacitive deionization with permeating flow discharge 38
Chapter 1: Introduction
The presence of water is central to the functioning of all living organisms. The human body consists of approximately seventy-five percent water showing the importance of this single component in the sustenance of life forms. The characteristic properties of water, particularly with regard to its solvent ability, dielectric constant, temperature of maximum density, heat capacity and surface tension, make it immeasurably important for all organic life so much so that it is currently theorized that the presence of water on any celestial body might provide the first signs of existence of preliminary life on it. From a biological standpoint alone, water plays vital roles in photosynthesis and respiration, in acid-base reactions and enzyme reactions, as a universal solvent and as an essential part of numerous metabolic processes.
In order to satisfactorily perform most of the aforementioned functions, it is critical that the solute concentration of the water consumed lies within a specific window of tolerance, as required for the particular process or reaction. For example, as the solvent base of the fluids in plants and animals, water is instrumental in the transportation of nutrients to tissues and cells in the body as well as in the removal of waste matter from the body. This requires the periodic replenishment of water in the body, which is accomplished in a large number of organs and tissues by the passage of water through semi-permeable membranes, such as the root covering of plants and the lining of colon in animals. The semi-permeable membranes permit water flow from a dilute solution to a relatively concentrated one by osmosis, while screening the dissolved minerals. The physics of the osmosis process necessitates that the fluids used to replenish the body must be less concentrated than the body fluids. Evidently, each of the fluid transport processes, whether governed by osmosis, convection or diffusion, imposes its own restrictions on the concentration of water that can be used for replenishment.
The most important consequence of the limitations imposed on the water intake concentration
by the physics of the various processes governing the physiological phenomena is that seawater
and even brackish water, which has a substantially high concentration of ions, is unacceptable for direct human consumption. To overcome this problem, most marine and estuarine life, which have no alternative but to consume saline water, have developed special capabilities to concentrate wastes and retain as much fresh water as possible in the body. While there are a number of factors, such as concentration of particular compounds, alkalinity and pH, that determine the acceptability of water for consumption purposes, a generic figure that is commonly cited as the maximum desirable concentration limit for potable water is 500 parts per million (ppm) of total dissolved solids (TDS) [1]. The other factors mentioned above provide additional stipulations on the 'safety' of drinking water, including upper bounds on concentration of specific chemicals of health significance, such as fluoride, nitrate and pesticide, concentration of substances that give rise to consumer complaints, and bacterial contamination.
While fresh water is absolutely critical in sustaining various life processes, its significance in agricultural uses, particularly in developing countries, cannot be underestimated. Irrigation of crops, particularly in equatorial and tropical climates, account for nearly seventy percent of global water consumption [2]. Given the hot and dry conditions of the developing countries in these
regions, it is perhaps not surprising that a disproportionately high amount of water is required to feed the burgeoning population. It is also no coincidence therefore that ancient civilizations, which possessed exclusively agrarian characteristics, flourished in regions with abundant supply of fresh water. Mesopotamia, the ancient Egyptian civilization, and the Indus Valley Civilization developed around the riverine regions watered by the Tigris and Euphrates, the Nile and the Indus and Ghaggar-Hakra rivers respectively. Needless to say, very few of the early human settlements were situated in regions of plentiful saline water (near seas or oceans, for example), where fresh
water from rivers and lakes was not readily available. In addition to irrigation, agricultural water consumption figures also account for the water required for livestock, dairies and fish farms. While the ratio of water used for livestock to that used for irrigation is typically very small, inefficient and labor-intensive irrigation methods can raise both the total amount of water required and the fraction of water consumed by livestock. It is worth mentioning here that given the large amount of water that is needed for irrigation and the skewed distribution of fresh water resources, the piping losses in the water conveyance systems for irrigation can be substantial.
Along with agriculture, domestic and public water consumption, the other major category of de-mineralized water use is industrial. In this classification scheme, industrial water use accounts for not only the water utilized by the electronics, pharmaceuticals and food industries amongst others but also by the power generation stations, where it is used primarily in the form of boiler feed water and coolant. While industrial and energy development use varies widely from the least developed countries to the industrialized nations, it is estimated that industrial water consumption across the globe occupies a twenty-three percent segment of the total water consumption pie [3]. Various industries designate different tolerance ranges for water intake, but power generation plants typically are capable of handling a higher degree of salinity in their water intake than the pharmaceuticals and semiconductor industries. The latter, in particular, demands that the input water is chemically, physically and biologically very pure - and the trend towards further miniaturization of circuit components is imposing even stricter requirements [4]. Moreover, it might also be important to monitor other 'purity' parameters such as water hardness and water activity level (defined as the ratio of the vapor pressure of water in a solution to the vapor pressure of pure water), for example, in the food processing industry. Water activity level is a function of solute concentration and directly affects microbial growth, which in turn impacts the preservation and shelf-life of food items [5].
In the face of such obvious need for ample fresh water supply to generate energy, grow crops, provide for high-tech fabrication and most importantly to sustain life, it is evident that any strain on the global fresh water resources can have major repercussions. As it stands, 97 percent of the earth's water is saline and contains anywhere between 3.1 to 3.8 percent salt by weight, which translates to an average of 35,000 ppm of total dissolved solids [6]. This leaves only 3 percent of the water on the planet in the 'freshwater' category. However, two-thirds of the total freshwater is locked up as ice in the glaciers and frozen polar caps. The remaining 1 percent is carved out approximately in the ratio of 3:7 between surface water resources and groundwater aquifers. In other words, the amount of stored freshwater (as differentiated from the annual precipitation which serves to replenish the water resources) that can be readily treated to yield water suitable for the aforesaid uses is about 0.5 percent of the total water available on Mother Earth. Moreover, the distribution of freshwater resources and rainfall is fairly uneven over the entire land mass. The high cost of water redistribution prohibits the transportation of water over large distances to arid and drought affected regions.
It is worth mentioning that about seven-eighths of the surface freshwater, which requires the least effort to transform to product water both in terms of energy cost as well as quality and quantity of necessary water treatment, is contained in freshwater lakes, with swamps and rivers accounting for the rest. Regions that do not receive sufficient annual precipitation and do not have lakes and rivers in their vicinity are, therefore, prone to serious and recurring droughts. While this has been the prevalent situation for as long as human civilization has existed, the availability of fresh water has taken a sharp downturn in recent decades due to substantial human interference in the natural hydrologic cycle.
Population explosion, coupled with the rising living standards and rapid industrialization, has led to shrinking per capita supplies all around the globe. Overpopulation has also brought about irresponsible practices, such as misuse of available freshwater and pollution of freshwater sources, which have in turn led to unprecedented water scarcity. Flood irrigation, which is extensively used in major agricultural pockets around the world, provides a classic example of appallingly inefficient utilization of water resources. Although this form of irrigation satisfies the primary functional requirement of supplying water to the crops on the field, massive quantities of water are allowed to just trickle away or evaporate before serving any known purpose. The resultant overirrigation causes a multitude of problems ranging from depletion of groundwater aquifers to surface subsidence as experienced in Mexico City [7]. It also has a deleterious effect on sustainable agricultural yields and on the quality of soil surface it leaves in its wake.
The inadequacy of fresh water supplies to meet the demands of the human population locally and globally has meant that the world is facing a crisis of gigantic proportions that ranks alongside the twin problems of shortage of viable energy resources and global warming in terms of its frightening spread and magnitude. This inadequacy exists not only in terms of insufficient quantity of water resources available at a specific location but also in terms of the poor quality of water in places where the availability of 'untreated' water is not a concern. The latter obviously precludes the possibility of human consumption due to the presence of excess amount of chemical, physical or/and biological impurities. Typically, in underdeveloped countries the acute deficiency of basic infrastructure as regards water withdrawal facilities (whether it be from groundwater aquifers or surface water supplies) and water conveyance systems is the root cause of water scarcity. In overpopulated developing countries, on the other hand, the focus of the water crisis is on the lack of proper water treatment particularly for domestic water supplies.
The poor quality of water, characterized by the presence of excess minerals and bacterial contamination, is a crucial issue as evidenced by the fact that waterborne diseases are responsible for the largest number of deaths worldwide and are estimated to cause around 80 percent of all human sicknesses [8]. Diarrhea, while usually thought of as an irritation more than as a medical condition in developed countries, has an annual fatality count in the region of 2 million people worldwide [9]. The spread of acute diarrhea, particularly among infants, has a high degree of correlation with lack of access to safe drinking water and inadequate sanitation facilities. While the incidence and severity of such diseases is primarily restricted to people in underdeveloped and developing nations, specific population pockets in periurban and rural areas of developed countries also face the danger of coming in contact with viral infections and bacterial toxins carried by contaminated water.
The World Water Development Report 2003 [10] delivers the grim prognosis that by the middle of this century, more than 50 nations, constituting a population of about 5 billion, will face a water crisis. The World Resources Institute report [11] estimates that, in 1995, 41 percent of the world's population, or 2.3 billion people, were living in river basins under 'water stress', meaning that per capita water supply was less than 1700 m3/year. Monitoring surveys, conducted
jointly by WHO and UNICEF [12], reveal that, despite slight gains in water coverage during the 1990s, approximately 1.1 billion people still have to depend on unreliable water resources such as ponds, unprotected wells and vendor-provided water to meet their daily needs. The major reason for the unavailability of reliable water supplies can be attributed to the fact that the increase in water coverage (from 77 percent to 82 percent in the decade of 1991-2001) has barely kept pace with the population explosion and migrations in the developing world. The surveys also highlight that arsenic poisoning of groundwater has become a serious problem for a number of Asian countries during the past decade. To complicate matters further, nearly 2 billion people around the globe do not have access to adequate sanitation facilities. These twin issues of shortage of
safe drinking water and inadequate sanitation facilities are inherently inter-linked as improper sewage disposal due to lack of proper sanitation gives rise to contamination of safe drinking water lines. The converse relation is established by the fact that places lacking adequate drinking water resources are unable to afford the 'luxury' of sufficient water for sanitation.
The numbers predict a bleak future for a water-stressed society which increasingly has greater demands for de-mineralized water and lesser supply avenues to satisfy those demands. However, even these figures tend to substantially underestimate the gravity of the problem because they reflect only gross macroscopic averages of annual precipitation, withdrawal and consumption, smoothing out local irregularities and shortfalls. More importantly, however, the statistics fail to reveal the far-reaching consequences of the socio-economic manifestations of limited water resources. It would not be far from the truth if one were to say that control of limited water resources is one of the major destabilizing forces and cause for potential conflicts in many parts of the world. While it might be a little too premature to accept the "next world war will be over water" rhetoric, tensions clearly exist over water as a 'strategic resource' and nowhere more so than in the Middle East, where armies have prepared to go to war over water ownership [13, 14].
The main problem, from a geo-political perspective, is the mindset that local water resource is an absolute territorial matter that must be controlled by people local to the region. In reality, though, few would disagree that water must be a shared resource that necessitates global cooperation to manage appropriately and to benefit all by doing so. Issues pertaining to water use, water ownership and water rights continue to provide an added edge to underlying border tensions in already destabilized regions. Although Helsinki Rules [15] provide a certain framework to negotiate international water disputes, in many a case the fight for water might only provide the ignition for the war for survival, which to all intents and purposes supercedes any logical rationale. International water disputes that fall into this category are familiar to the nations of North and South Korea, Egypt, Ethiopia and Sudan, and Israel and Palestine. In Israel, for example, extraction from water resources has exceeded replenishment by 2.5 billion meters in the past 25 years [16] and given that water needs are only going to spiral up, water use becomes an
'add-on' to the myriad issues that need to be resolved in the region.
Another major water-related flashpoint on the world stage pertains to the withdrawal and nature of use by upstream consumers that has a direct bearing on the quantity and quality of water available to people further downstream. Wrongful dam construction and diversion projects have huge social manifestations since entire villages, towns or even states might need to be relocated as a consequence of the poorly planned action. Typically such construction also comes at a substantial environmental cost, as a result of the widespread damage caused to both vegetation and wildlife in the region. Other unpleasant issues that arise from water scarcity and subsequent tensions arising from water use and ownership include questions on food security for nations starved of water, hugely subsidized water pricing, which hurts regions that have abundant supply of water but little else, and productivity of ecosystems, which have been continuously milked for providing water security, in other sectors.
There is no obvious solution to this increased competition between different sectors, different populations and different nations, particularly in the current climate of limited cooperation at all levels. To tackle a global issue of this magnitude, huge mobilization efforts need to take place to create an international consensus that can provide for water security for generations to come. Measures to inculcate equitable water price, empower international agencies to create basic infrastructure in underdeveloped countries, install wastewater treatment plants, and replace flood irrigation methods by drip irrigation and precision sprinklers, have been proposed to reduce the water crisis. While these and other political, social and economic initiatives would undoubtedly
enable better utilization of the meager freshwater resources, a technological breakthrough that can rapidly alleviate the problem is desperately needed in these dire circumstances.
Desalination stands out as an attractive proposition as, theoretically speaking, it can exploit the earth's seemingly boundless reserves of saline water in the oceans and seas to generate freshwater suitable for human consumption as well for agricultural and industrial use. However, over the years, it has failed to meet up to the lofty expectations primarily because of the energy guzzling nature of the different desalination technologies employed to date. The current opinion regarding desalination is that while it may take on greater significance in the future, existing desalination operations will be restricted to countries, where the local distribution of energy and water resources is significantly skewed in favor of the former (e.g. in the Middle-East).
Currently, about 12,300 desalination plants world-wide strive to fulfill the objective of treating sea water to make it fit for various applications, primarily human consumption [17]. However, their cumulative contribution is only about 0.3% of the world's water use. While the desalination
technology roadmap projects that by 2020 "water purification and desalination technologies will contribute significantly to meeting the need to assure a safe, sustainable, affordable and adequate water supply" [18], the current state of the art does not allow desalination to be extensively used. However, if by introduction of some novel 'disruptive' technology one were to scale down the energy costs by an order of magnitude or more, the landscape of the water crisis phenomenon might undergo a sea change. It is pertinent to note that in doing so one must be very careful that the capital and maintenance costs do not spiral out of control, as has been the case for a number
of promising, yet ultimately unsuccessful, desalination technologies.
The present global desalination market is dominated by membrane-based technologies and thermal desalination methods. In recent years, the former has rapidly gained impetus as compared to the more traditional thermal desalination techniques that have essentially remained the same as regards the basic process structure over the last century or so. Reverse osmosis (RO), which has a market share of approximately 47 percent of installed capacity worldwide [19], is the foremost proponent of the membrane-based desalination technologies. In this process, saline water is filtered through a semi-permeable membrane by applying pressures well in excess of the osmotic pressure against the natural pressure gradient. The thermal desalination techniques, on the other hand, use the time-tested method of evaporating saline water and then condensing the water vapor, formed in the evaporation step, to obtain pure water. The various thermal processes, such as multi-stage flash (MSF) and multi-effect distillation (MED), vary in the pressures and temperatures employed at different stages, and in the number of chambers and passes utilized for a typical process. The MSF process forms the basis of about 36 percent of the world's desalination plants. Another desalination technology that has been in vogue, since the 1970s, especially for brackish water desalination is electrodialysis reversal (EDR) [20]. In the EDR process, saline water is passed through an electrolytic chamber where an electric field is applied to separate out the ions from the pure water. Table 1 presents a comprehensive list of the desalination methods classified according to the respective physical phenomenon that forms the basis for ion separation from saline water. Some of the key ideas behind these different processes are revisited in greater detail in Chapter 2.
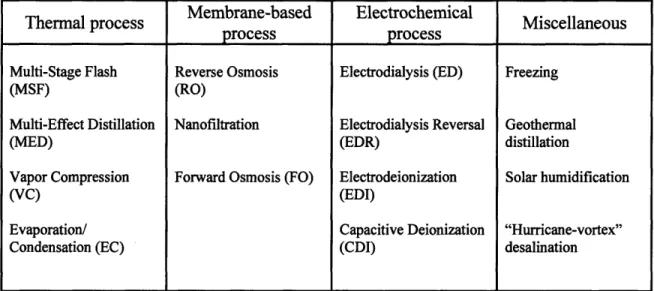
Table 1: Classification of desalination technologies based on the physics of the individual processes
Membrane-based Electrochemical
Thermal process Miscellaneous
process
process
Multi-Stage Flash Reverse Osmosis Electrodialysis (ED) Freezing
(MSF) (RO)
Multi-Effect Distillation Nanofiltration Electrodialysis Reversal Geothermal
(MED) (EDR) distillation
Vapor Compression Forward Osmosis (FO) Electrodeionization Solar humidification
(VC) (EDI)
Evaporation/ Capacitive Deionization "Hurricane-vortex"
Condensation (EC) (CDI) desalination
Membrane related research [21] has helped in decreasing the energy consumption of the RO and EDR processes and enabled the maturation of the RO process, in particular, to a point where the potable water needs in the Middle-East can be satisfied partially by employing this method. However, neither can it be used in water-stressed regions that do not enjoy the luxury of abundant energy resources, such as in the African continent, nor can the greater share of the market, for
industrial and agricultural uses, be satisfied with the high energy requirements inherent in the
process.
In recent years, capacitive deionization (CDI) has been reported to potentially solve some of the crucial issues that have plagued the classical desalination processes such as energy cost and membrane fouling (Table 2 and 3) [22]. It consists of flow of saline water through a pair of high
surface area electrodes (e.g. activated carbon cloth) across which a small voltage is applied.
During the flow the ions in the saline water move towards one of the electrodes depending upon the polarity of the ions. The porous electrode is able to electrostatically absorb the ions in a
reversible manner. As a result, during this charging process, capacitive current flows in the
external circuit connecting the electrodes. Consequently, the water flowing out of the system is de-ionized. Once the capacitor is fully charged, the ions are regenerated by shorting the electrodes (or by applying a reverse polarity). The discharge process, thus, consists of the flushing of the
ions adsorbed during the charging process by means of waste water through the same flow path.
The basic electrochemical scheme in the CDI process is distinguished from that used in the EDR process by the fact that the former avails of reversible electrostatic adsorption in the electrical
double layer close to the surface of the polarizable electrode while the latter employs electrolysis
on the surface of the non-polarizable (or reactive) electrode. Surface adsorption naturally requires much less energy than electrolysis of ions.
Although the capacitive process has shown a lot of promise over the last decade or so, it is yet to be fully implemented in an industrial setup. One of the reasons that affect its suitability in such an environment is the low water recovery ratio (with regards to other processes used for brackish water desalination) (Table 2). Water recovery ratio is defined as the ratio of the amount of desalinated water obtained to the total amount of input water. For a given throughput of a desalination plant/process, the water recovery ratio and the power consumption per unit volume
of water desalinated provide the two most significant metrics for judging the effectiveness of the plant/process. The costs of pumping and pre- and post-treatment of water added to the rising costs of surface water makes maximizing the recovery ratio a priority. It is also accepted that aquifer withdrawals surpass the recharge with resulting drops in water tables, which renders the recovery ratio even more important. In the CDI process, it is observed that the discharge typically takes at
least half the time required for charging thereby enabling a maximum recovery ratio of 0.5 - 0.6 (for brackish water desalination) [23, 24]. The corresponding recovery ratios for the RO and EDR
processes for brackish water desalination typically exceed 0.85 - 0.94 [25]. In addition, the
available energy during the process cycle is not fully utilized as it is really operational for half to two-thirds of the total cycle time. Furthermore, the low ratio constrains the range of input saline water the process can be used for.
Table 2 Performance comparison of the major desalination processes Process Seawater Desalination Brackish water Desalination
Parameters MSF RO RO EDR CDI
Susceptibility tosceptibility to Low High High Low Negligible
scaling I I
Final product salinity Can be <10 On demand On demand On demand
(ppm TDS) <500 <500 <500
nergy cost High (25 - 200) Moderate (7 - 9) Moderate (- 2) Moderate (- 2.1) Low (0.05 - 0.5) kWhr/m) recovery Poor, 10 25% Moderate, 50% >80% Hi 85 - 90% Low, 50 - 60% Water recovery Poor, 10 - 25% Moderate, 50% High, >80% High, 85 - 90% Low, 50- 60%
Table 3 Cost comparison of RO and CDI (adapted from [23])
Reverse Osmosis (RO) Capacitive Deionization (CDI)
Capital cost $0.52 $0.26
Operating and $0.81
$0.14 Maintenance cost
Total cost $1.33/1000 gallon $0.40/1000 gallon
To drastically reduce the problem of low water recovery ratio while still maintaining the sizeable power consumption advantage of the CDI process, we introduce a capacitive deionization process with permeating flow discharge (PFD). In PFD, the waste water is permeated through the porous electrodes rather than flowing in-between the electrodes as is the
case in the conventional axial flow discharge (AFD) process. It is to be emphasized that this change in flow path is implemented during the discharge period only when the electrodes are regenerating. In this study, a table-top setup to simulate both AFD and PFD is designed and fabricated. The experimental observations for the ion removal rate for each process as a function of time is then presented. To understand the physical mechanisms in a more rigorous manner, a mathematical model based on unsteady convection-diffusion process for AFD and membrane transport process for PFD is built. Numerical simulations are carried out to compare with the
experimental observations. Finally, theoretical predictions of the expected benefit in throughput and water recovery ratio due to utilization of the PFD process are presented.
Chapter 2: Review of desalination technologies
A large number of processes have been proposed for water desalination and a few of these have attained commercial importance. As desalination of water typically takes place in large scale industries, for any new idea to mature requires a huge investment of effort and time, not to mention money. Consequently, numerous promising processes have fettered out for the lack of sufficient research into the physics of the processes and subsequent development of the technology. The state-of-the-art approaches, as noted previously in Table 1, utilize a wide variety of physical principles as well as different forms of input energy that include mechanical energy (reverse osmosis), electrical energy (electrodialysis reversal), thermal energy (multi-stage flash distillation) and chemical energy (ion exchange processes). An excellent review of the engineering principles and various practical aspects of the existing desalination processes can be found in Buros' "ABCs of Desalting" report [26].
The feasibility of employing one of these processes at a proposed location is determined not only by the fundamental characteristics of the process but also by a number of location specific factors, such as the concentration of water that needs to be desalted, type and amount of available energy resources and brine discharge possibilities at the proposed plant site. For instance, given a coastal plant location one would be essentially left with the choice of employing either reverse osmosis or multi-stage flash distillation process. On the other hand, at a location where brackish water comes with an associated price tag and the possibilities of brine discharge are very limited (any place distant from the sea or ocean has these limitations), an electrodialysis reversal process would be more in order. The aforementioned factors are reflected in Fig. 1, where in one finds that despite its energy intensive nature, thermal desalination technologies have approximately a
45 percent share in the global market because of the fact that seawater remains the dominant source for desalting. However, if the focus shifts to the US desalination market, one would observe that thermal desalination accounts for just about 5 percent of the total desalinated water. The reason for this anomaly can be traced to the extensive use of brackish water as source in the US (51 percent) relative to the global market (24 percent).
Waste Brackist Brine <10N Pure 7%-1 /--Unknown <1% Pure 7% Wasti r 55O/% iver 26% miver V7o
Global
US
Brackish 51%Fig. 1(a): Source water classification: Global market (left) and US market (right)
Multi-Effect Distillation 2% Vapor Compression 30/% I thr 7%/ Electrodialysis 5. Multi-Stage Fla 40% Global Re 44 Nano-Filtration 15% Others 2%-Multi-Effect Distillation 1%0/ Vapor Compression 3%" Electrodialysis 90 Multi-Stage Flash 1 :verse Osmosis %
US
69%Fig. 1(b): Desalination process classification: Global market (left) and US market (right) (adapted from [27]).
To initiate our review of the existing technologies and the advantages and the pitfalls associated with employing them, let us focus on the key performance characteristics which define the quality of any desalination process. The critical parameters for a desalination plant include throughput (total amount of water desalinated per day), power efficiency (energy required to desalinate unit volume of water), water recovery ratio (ratio of water desalinated to water input) and percent removal of ions. If one imposes an upper bound on the concentration of acceptable (desalinated) water, the percent removal of ions ceases to be a plant performance metric. As the input water has a given salinity (seawater and brackish water have salt concentration in the range of 35000 and 3000 ppm), and the output water must have salinity below 500 ppm to meet human consumption standards, the percent removal of ions becomes pre-specified and is not considered to be a parameter that can be modified or optimized. In other words, the processes must be compared bearing the twin parameters of power efficiency and water recovery ratio in mind, while also accounting for reliability, longevity, fouling characteristics, scalability, and capital and maintenance costs. Finally, a desalination process must also address the issue of brine disposal and the oft associated problem of excess heat rejection.
Fig. 2: Multi-Stage Flash distillation (once-through process) (adapted from [28]) R,
Thermal desalination processes typically utilize the concept of evaporation followed by condensation (i.e. distillation) at reduced temperature and pressures (with respect to ambient pressure) for the evaporation step so that less energy is consumed. This is augmented by coupling of the two processes, wherein one feeds energy to the other. Cogeneration configurations, where thermal desalination plants and power plants form dual-purpose facilities, can further reduce the energy requirements of the desalination process as the waste water from the power plant can be used to heat the seawater. Such configurations, however, can only be viable in places where an existing power plant can supply the necessary 'by-products' for the desalination plant. The prominent thermal desalination processes are multi-stage flash, multi-effect distillation and vapor compression desalination.
The multi-stage flash (MSF) desalination process distills sea water by flashing a portion of the water into steam in multiple stages. Seawater is, first, heated in a brine heater (unless a cogeneration configuration is in place). This step is usually achieved by condensing steam on a bank of tubes carrying sea water through the brine heater. The heated water is passed to another container known as a "stage", where the surrounding pressure is lower than that in the brine heater. It is the sudden introduction of the water into a lower pressure "stage" that causes it to boil rapidly and flash into steam. Boiling will continue only until the water cools to the boiling point at the particular pressure after supplying the necessary heat of vaporization. Typically, only a small percentage of this water is converted into steam, depending on the pressure maintained at the stage. The remaining water is subsequently sent through a series of additional stages, each possessing a lower ambient pressure than the previous "stage". The steam generated by flashing is condensed on tubes of heat exchangers that run through each stage. A MSF plant typically consists of more than 15 such stages and operates at a peak temperature of 90-1200C. It is used
either in the once-through mode (Fig. 2) or the brine recirculation mode. Although this process has been in vogue for a long time, it has very high energy requirements. Operating the plant at a higher temperature facilitates higher efficiency but increases the possibility of scale formation in the stages.
Multi-effect Distillation (MED), like MSF, exploits the basic evaporation and condensation process in a series of "effects" at reduced pressures to desalt water. However, it tends to have greater scaling issues as compared to MSF and has thus largely been replaced by the latter in most application areas. In the Vapor Compression (VC) technique, compression of vapor before the condensation step provides the necessary heat of vaporization for the entering water. It is typically used in conjunction with other desalination processes or in small scale desalination applications. Although both these techniques, particularly MED, have found suitable application areas (e.g. evaporation of juice from sugarcane for the production of sugar) and have been prominent contributors to the total desalination market over the years, currently neither of them are particularly favored even when thermal desalination is the best way forward.
High Membrane Pressure Asml .. .: .. .. .: . ji:a ii water Discharge
Fig. 3: Schematic diagram of the reverse osmosis process [29]
Membrane processes use semi-permeable membranes to filter out dissolved material or fine solids. In the reverse osmosis process, the permeate (the liquid flowing through the membrane) is forced to flow through the membrane by the pressure differential created between the feedwater
and the product water, which is nearly at atmospheric pressure (Fig. 3). The remaining feedwater continues through the pressurized side of the reactor as brine. No heating or phase change takes place. The major energy requirement is for the initial pressurization of the feedwater. For brackish water desalination the operating pressures range from 200 to 400 psi, and for seawater desalination from 800 to 1000 psi. These extremely high pressure gradients are required to offset the osmotic pressure gradient felt by the permeate when it is pressurized against the semi-permeable membrane. Seawater, for example, has a natural osmotic pressure of about 350 psi. Thin film composite membranes, which are typically made of an active thin-film layer of polyimide layered with polysulfone as a porous support layer, act as molecular sieves to filter out inorganic salts as well as non-ionic organic compounds such as fructose (MW 180) and smaller organics such as ethyl alcohol (MW 46). The membranes are rated in terms of rejection rate and flow rate allowed. Nanofiltration is similar to reverse osmosis except that it allows smaller organics and small ions (with lower charges) to go through but requires a smaller pressure gradient to operate. Reverse osmosis has improved significantly due to improvement in membrane characteristics as also improvement in energy recovery and recycling systems. However, it still remains a fairly expensive process due to the high pressure pumps required. Moreover, it is extremely susceptible to scaling and membrane fouling, which decreases the longevity of the process causing major maintenance headaches. Reverse osmosis, also, involves significant amount of pre-treatment (primarily for solid and sediment screening) and post-treatment of the water (mainly for adjustment of pH) further increasing the cost of distributed water.
Forward Osmosis (F.O.) introduces a novel scheme in the spectrum of membrane based desalting approaches. This process employs a passive membrane filter that is hydrophylic (attracts water), slowly permeable to water, and blocks a portion of the solutes. Water is driven across the membrane by osmotic pressure created by food grade concentrate on the clean side of the membrane. Forward osmosis systems are passive in that they require no energy inputs. Although forward osmosis systems have very limited applications on an industry wide scale, they can be useful in emergency desalination purposes in seawater and floodwater settings.
C4trsm D-tr4*m (ConCentrate) (Product ) 2io- * 2 HO t I
o
- 2 H + HI+20H- + -4) 0 C) U= 2N. :W Na*P SO Nao Na*P
O>S 0000C-*ep~r Fed O0terem Feed
Fig. 4: Schematic diagram of an EDR process in operation (adapted from [30]) The electrodialysis reversal (EDR) process is sometimes clubbed together with reverse osmosis as a commercially successful membrane-based desalination approach. However, the fundamental physics of the EDR process is vastly different from that of the RO process as is the type of input energy utilized to deionize the influx of saline water (mechanical energy for RO as opposed to electrical energy for EDR). In the EDR process, an electric current is employed to force the dissolved salt ions to migrate towards the anode or the cathode, depending on the polarity of the ion, through an electrodialysis stack of alternating cationic and anionic exchange membranes. The ions in their lateral motion are trapped in these concentrate channels leaving alternate channels of fresh water (Fig. 4). EDR systems reduce the fouling tendencies of the saline water by reversing the polarity of the electrodes every 15-20 minutes. This change in polarity causes the scales that may have been formed during one cycle to disassociate from the membranes. Polarity reversal causes the concentrating and diluting streams to switch after every cycle. EDR is a popular process in the domains of industrial process water treatment as also for wastewater reuse projects. The reason it is not favorable for seawater desalination is because the process does not scale up, with respect to the input water concentration, particularly well. The energy requirements of the process rise steeply with the increase in input water concentration that must be treated in the plant. Nevertheless, the EDR process provides a valuable tool for brackish water desalination, primarily because of its high water recovery ratio. General Electric (GE) reports that their EDR systems are able to deliver a water-recovery rate of up to 94 percent [31]. The desirable characteristics of membranes used in electrodialysis applications include selectivity between ions of opposite charge, high ionic conductivity, low electrical conduction, long-term chemical stability, mechanical strength, and resistance to fouling. These characteristics are determined by the membrane matrix polymer and the fixed ionic moiety that affect the ion selectivity of the membrane. Polymer materials such as polystyrene, polyethylene, and polysulfone are often chosen for the membrane matrix and are often cross-linked to ensure stability. Fixed ionic moieties such as S032- and P0
32- are commonly used for cation exchange membranes, whereas
NH3+ and RNH2+ are common choices for anion-exchange membranes.
In the backdrop of these technologies that have matured over the past few decades, the capacitive deionization technique was proposed to address the predominant problem afflicting the
In+
t 2%2 o?l 12Ne+ '00+9 ý* N 0?r
0.CL*5
Cfield of desalination, i.e. the huge cost of desalinated water. Desalinated water currently costs about $2-$9/kgallon. This figure is an order of magnitude higher than the price paid by farmers ($0.2-$0.4/kgallon) and is a factor of two to three higher than that paid by urban users ($1-$3/kgallon) [32]. Although capacitive deionization was first mentioned as a possible method of desalting in 1971 by Johnson and Newman [33], it was not till the early '90s that any substantial efforts were made to develop the promising approach into a practical method of deionizing water. A number of different techniques, using a wide array of electrode materials, flow paths and channel configurations, have since been proposed to take advantage of this energy-efficient deionization technology. In the following paragraphs, we shall outline a few novel schemes that have been actively pursued in terms of characterization and development of the process and the proposed module.
Andelman [34] discloses one of the first inventions relating to spiral-wound (Fig. 5 (a)) and stacked (Fig. 5(b)) flow-through capacitors using high surface area electrodes. In the former, the water enters through the axis of the spirally wound system, comprising of high surface area electrodes 16, 17, 21, 22 that are connected to DC power by means of conductive backing 20 and 14 and are separated from each other by means of insulating material layers 12 and 18. The saline water moves radially outward as well as flowing down along the axis. The desalinated water is then collected from the outer layer as shown in the figure below.
ICO~O
Fig. 5(b) Stacked flow-through capacitor as described by Andelman [34]
Another embodiment of the capacitive deionization scheme is the stacked flow-through capacitor. It consists of a hollow plastic tube that supports the washer parts together. Washer material 116, 117, 121 and 122 provide the high surface adsorption capability while being backed by electrically conductive layers 120. Insulating spacers 112 and 118 separate the electrodes from one another. In a compact form the conductive leads 124 connect the alternating anode and cathode layers in parallel as shown on the right.
Various improvements of the basic flow-through capacitor design have been proposed over the past few years although the principles and flow paths employed remain identical to those stated in [34]. A demonstrative example of the changes can be found in [35], where short solute or fluid flow paths in direct communication with the outside of the capacitor are employed. This invention is said to reduce fouling because the formation of fouling precipitates and crystals is impeded by the lack of spatial dimension over which the flow occurs. Nevertheless, it has not been demonstrated clearly that the introduction of multiple thin strips or open netting instead of porous spacers serve the twin function of providing insulation and minimizing clogging appropriately. In fact the presence of any kind of said spacers decreases the effectiveness of the process in as much as the pressure drop required for fluid flow increases significantly. In the description, the inventor also speaks of the disadvantage of having low water recovery in existing capacitive deionization purification devices. Unfortunately, the designs suggested do not present themselves to any physical mechanism by means of which one can obtain a clear increase in water recovery ratio. Finally, the design necessitates that holes are cut on the electrodes of the flow-through capacitors to align with the perforations on the liquid feeding pipe. This restricts the adsorbing area of the capacitors and complicates the manufacturing and assembly of the system. Both of the effects severely limit the commercial feasibility of the process.
From the investigations carried out at Lawrence Livermore National Laboratory (LLNL), Farmer et al. have described a design where the flow path is strikingly different from that adopted
in Andelman's approach. A flow path that is parallel to the capacitor plates is advocated as opposed to flow through the capacitors. Fig. 6 details the flow path and desorption scheme. In this scheme, saline water flows between the channels created by the aerogel papers (black), which are supported by structural layers of gaskets and frames. As it flows laterally through each of the channels, while also moving down from the input to the output section, so encapsulated between two high surface area electrodes, the ions are adsorbed in the double layer.
Rubber gasket ;:-Carbon aerogel composite Titanium electrodes
Fig. 6: Flow-along-serpentine-path desalination apparatus, designed by Farmer ([36], [37])
The main advantage of this design is the ease of fabrication and maintenance although, as noted elsewhere [38], the ease of construction does not necessarily imply that the manufacturing process guarantees reliability in satisfying the functional requirements. Another main advantage of this system is that unlike in previous designs where water was made to flow through packed carbon beds, which are not 'immobilized', the carbon aerogel papers do not get entrained in the flow. Consequently, material degradation and erosion is significantly lesser, thereby maintaining efficiency of the process for a longer period of time. Van Konyenburg et al [39] further propose a fuse and filter method for limiting and ameliorating electrode shorting in case a conducting particle is fragmented from a carbon aerogel sheet. While this design also presents exciting possibilities in reducing pressure drops required for water flow through the system in spite of advocating a tortuous serpentine path for solute and water flow, it suffers from substantial fouling problems. Precipitates can form at the bends and corners thereby impeding further flow of fluid. Farmer's design suffers from bulk and cost issues, particularly pertaining to the structural members, as also from severe leak problems from the large number of bends required in such a setup. However, the most significant problem in this design is that the discharge process, which has the same flow path as the charging process, is severely restricted by the convection-diffusion mechanism. This results in a very low water recovery ratio rendering the process not viable in a competitive scenario.
Other methods that have been patented include a process to separate ions by using a combination of electric current and centrifugal force (Hanak [40]) and movable electrode flow-through capacitors (Faris [41]). However, both these ideas while intriguing in themselves and
using very novel approaches incorporate moving mechanical elements (mechanical rotor and movable belt structure or roller respectively) which would be very difficult not only to incorporate in a water purification setup but would also reduce the efficiency and longevity of the system.
In all the patents we have considered thus far it has been noted that a common thread of problems arise from the fact that too much water is used for reclamation or regeneration of the electrodes once they are saturated. While it has been a well-documented fact over the last few years, very few researchers have actively sought to address this issue. Tran et al [42] describe a method of regeneration which uses less of the 'useful' water being deionized. They employ shorting or reverse polarity, the latter due to the possibility of increased rate of ion desorption from the electrodes. Moreover, the design uses a second regenerant fluid to remove ions while slowing down or stopping the flow of 'useful' fluid such that it is not wasted. However, the use of reverse polarity might mean that while ions of one type of charge are repulsed from an electrode, the oppositely charged ions will get immediately attracted to the electrode causing the saturation of the electrode rather than regeneration. Moreover, using a second regenerant fluid gives no additional advantages particularly when one considers that introduction of the new fluid gives no benefits in as far as the first fluid is not wasted. In fact in most cases the saline water is the cheapest resource and if any fluid needs to be used to take away the ions from the saturated electrodes, it must be the incoming saline water.
A method of improving the efficiency of flow-through capacitors by using charge barrier membranes has been proposed by Andelman et al [43]. The inventors disclose a method of placing charge barrier membranes next to the electrodes so as to compensate for pore volume losses caused by adsorption and expulsion of pore volume ions. The "charge barrier" is described as a permeable or semi-permeable membrane which retains the co-ions that migrate into the cell, thereby considerably improving the quality of water produced. It is reported that this results in a large gain in ionic efficiency (defined as the coulomb of ionic charge purified per coulomb of electrons used). Consequently, the capacitive deionization process with the additional charge barrier pieces can be utilized to desalinate seawater which otherwise proves uneconomical. In this method, when a charge cycle is completed the flushing takes place only in the layer between the electrodes and the charge barrier membranes thereby reducing the water used for discharge to an extent. Although this does open up new avenues, it is still untested and has several disadvantages if the extent of benefit, as described in the patent, is not realized. For example, the presence of additional membrane implies the increase in the value of the internal resistance of the RC circuit. The 10% microporous membranes, advocated in the patent, is also likely to cause a severe pressure drop for the flow-through capacitor setup. A significant adverse osmotic pressure gradient would also develop for such a membrane necessitating the application of a much higher hydrostatic pressure. Evidently such membranes would also have the potential for detrimental scale formation and would add to the maintenance cost as well as to the capital cost.
In a recently reported work, Max [44] proposes a segregated flow, continuous flow deionization technique by means of which it is claimed that deionization continues unabated even when polarity reversal takes place. The invention consists of placing membranes next to electrically attractive devices thereby creating segregated sections of concentrated and fresh water flow. The membranes permit ions of the same charge to flow through them but do not let them move back due to resistance in diffusion. However, this design has multiple problems. Firstly, it is difficult to find a membrane that fits the description in the patent. Secondly, in the given design deionization of the concentrated channels occurs in parallel with deionization of the fresh water channels. The ions from the concentrated channels take up substantial surface area of the electrodes thereby
![Fig. 2: Multi-Stage Flash distillation (once-through process) (adapted from [28])](https://thumb-eu.123doks.com/thumbv2/123doknet/14757549.583311/22.918.145.780.745.1064/fig-multi-stage-flash-distillation-process-adapted.webp)
![Fig. 4: Schematic diagram of an EDR process in operation (adapted from [30]) The electrodialysis reversal (EDR) process is sometimes clubbed together with reverse osmosis as a commercially successful membrane-based desalination approach](https://thumb-eu.123doks.com/thumbv2/123doknet/14757549.583311/25.918.233.691.133.471/schematic-operation-electrodialysis-reversal-commercially-successful-membrane-desalination.webp)
![Fig. 6: Flow-along-serpentine-path desalination apparatus, designed by Farmer ([36], [37])](https://thumb-eu.123doks.com/thumbv2/123doknet/14757549.583311/28.918.278.625.265.607/fig-flow-serpentine-path-desalination-apparatus-designed-farmer.webp)