HAL Id: hal-00304829
https://hal.archives-ouvertes.fr/hal-00304829
Submitted on 21 Feb 2006
HAL is a multi-disciplinary open access
archive for the deposit and dissemination of
sci-entific research documents, whether they are
pub-lished or not. The documents may come from
teaching and research institutions in France or
abroad, or from public or private research centers.
L’archive ouverte pluridisciplinaire HAL, est
destinée au dépôt et à la diffusion de documents
scientifiques de niveau recherche, publiés ou non,
émanant des établissements d’enseignement et de
recherche français ou étrangers, des laboratoires
publics ou privés.
the Okavango Delta, Botswana, from analysis and
interpretation of a 30-year hydrometric record
P. Wolski, M. Murray-Hudson
To cite this version:
P. Wolski, M. Murray-Hudson. Flooding dynamics in a large low-gradient alluvial fan, the Okavango
Delta, Botswana, from analysis and interpretation of a 30-year hydrometric record. Hydrology and
Earth System Sciences Discussions, European Geosciences Union, 2006, 10 (1), pp.127-137.
�hal-00304829�
www.copernicus.org/EGU/hess/hess/10/127/ SRef-ID: 1607-7938/hess/2006-10-127 European Geosciences Union
Earth System
Sciences
Flooding dynamics in a large low-gradient alluvial fan, the
Okavango Delta, Botswana, from analysis and interpretation of a
30-year hydrometric record
P. Wolski and M. Murray-Hudson
Harry Oppenheimer Okavango Research Centre, Maun, Botswana
Received: 11 August 2005 – Published in Hydrology and Earth System Sciences Discussions: 6 September 2005 Revised: 29 November 2005 – Accepted: 3 January 2006 – Published: 21 February 2006
Abstract. The Okavango Delta is a flood-pulsed wetland,
which supports a large tourism industry and the subsistence of the local population through the provision of ecosystem services. In order to obtain insight into the influence of var-ious environmental factors on flood propagation and distri-bution in this system, an analysis was undertaken of a 30-year record of hydrometric data (discharges and water lev-els) from one of the Delta distributaries. The analysis re-vealed that water levels and discharges at any given channel site in this distributary are influenced by a complex interplay of flood wave and local rainfall inputs, modified by channel-floodplain interactions, in-channel sedimentation and techni-cal interventions, both at the given site and upstream. Ad-ditionally, cyclical variation of channel vegetation due to in-termittent nutrient loading, possibly sustained by nutrient re-cycling, may play a role. It is shown that short and long-term flood dynamics are mainly due to variation in floodplain flows. As a consequence, discharge data collected within the main channels of distributaries do not adequately represent flooding dynamics in the system. The paper contributes to the understanding of seasonal and long-term flood pulsing and their variation in low gradient systems of channels and floodplains.
1 Introduction
The dynamics of flood propagation and inundation in a channel-floodplain system constitute an important hydrolog-ical and ecologhydrolog-ical variable. Hydrologhydrolog-ically, the interactions of channels with floodplains cause considerable variation in flood levels, storage and conveyance capacity of the system. As a result, the flood wave is modified – often flattened and delayed – while passing through a channel-floodplain
sys-Correspondence to: P. Wolski
tem, and the flood frequency distribution itself can change, compared to that at upstream locations (Wolff and Burges, 1994). The ecological role of the channel-floodplain interac-tion is expressed by the flood pulse concept (Junk et al., 1989; Middleton, 1999). According to this concept, floodplain wet-lands and riparian ecosystems adjust to, and are maintained, by the pulsing of water, sediment and nutrients that occurs during over-bank flow conditions. Odum (1994) addition-ally identifies flood pulsing at various spatial and temporal scales as an energy subsidy to wetland ecosystems, explain-ing in part the high ecological productivity associated with such systems.
In the past, river management has been focused on control-ling rivers rather than managing them in sympathy with their natural variability. This has often resulted in a considerable reduction in floodplain wetlands and loss of biodiversity and ecosystem services (Tockner and Stanford, 2002). More re-cently, however, recognition of the role of flood pulsing and the hydrological role of floodplains has led to the tendency to rehabilitate regulated rivers through the re-establishment of natural channel-floodplain links, and their hydrological and geomorphological dynamics. This recognition has also re-sulted in a trend towards trying to maintain the natural dy-namics in undisturbed systems, in order to maintain ecosys-tem services such as effective flood mitigation (Middleton, 1999). Flood dynamics in a channel-floodplain system can change due to exogenic processes such as climate change, endogenic processes such as geomorphological evolution of river channels and floodplains, and anthropogenic processes such as channelization, regulation, water diversion. Not all change is undesirable, however. Continuous and episodic al-luvial processes such as the natural evolution of river chan-nels and flood-induced shifting of floodplain morphology are recognized as important drivers of floodplain ecology. They cause habitat rejuvenation and thus maintain high habi-tat diversity (Ellery and McCarthy, 1994; Hauer and Lo-rang, 2004; Richards et al., 2002; van der Nat et al., 2003).
These processes can also maintain floodplain communities at an early stage of succession, resulting in high productivity (Odum, 1994). Thus, for the effective management of river corridors and floodplain wetlands, a thorough understanding of the natural dynamics of channel-floodplain systems and of endogenic and exogenic changes occurring in these systems is needed.
The dynamics of floodplain flows and water levels and their change are often difficult to ascertain. Hydrological ob-servation networks are generally focused on the in-channel situation rather than the overbank one. Off-channel flows can be measured directly with a current meter or by dye techniques (e.g. Stern et al., 2001). Indirectly, they can be obtained by the slope-area method involving hydraulic cal-culations based on post-event high flood mark surveys or on water levels measured with new airborne or space radar tech-niques (Alsdorf et al., 2000). Such measurements, however, are usually campaign-based, not continuous, and thus are not suitable for longer term change analyses. Usually, overbank flood discharges are obtained by comparison with continu-ous measurements at upstream/downstream stations where the total discharge is measurable (e.g. Wyzga, 1999) or by extrapolation of a known in-bank stage-discharge curve to overbank conditions (e.g. Chen and Chiu, 2004). However, these techniques are not suitable in systems where there is lateral differentiation of flood dynamics, such as low gradi-ent rivers and river deltas. Such environmgradi-ents are character-ized by very complex and variable water regimes, because a large proportion of total flow can occur as off-channel flow. This may lead to the splitting of the flood wave into indepen-dent flow paths of different dynamics. Additionally, the re-lationship between channel and floodplain flows varies with flood level, between systems, and within a system, depend-ing on the hydraulic connectivity of floodplains, and the na-ture of the channel-floodplain link. For example, in some systems floodplains carry increasingly more water with in-creased flood levels. Floodplain flow in such systems is es-sentially parallel to that of channel, and floodplain storage is much smaller than the flow volume. In other systems, flood-plain storage effects dominate during larger floods, with little floodplain flow in the longitudinal direction. Flow in these “storage” floodplains is mostly perpendicular to the channel direction: away from the channel during the rising flood, increasing floodplain storage, and in towards the channel, draining floodplain storage during flood recession (Wyzga, 1999). Analysis of flood dynamics and change in floodplain systems from time series of hydrological measurements must therefore take into account the possible occurrence of endo-genic change. In addition, observations from a given hydro-metric station must be related to those at other stations, ide-ally where endogenic change is known not to occur, e.g. at the inlet to a delta (Polonsky, 1996).
The Okavango Delta is a large low gradient alluvial fan, forming a hydrologically complex wetland system in an oth-erwise semi-arid environment. It is a RAMSAR site, the
nat-ural resources of which support an economically important tourism industry and the subsistence livelihoods of the lo-cal population. In the last three decades a general decline of flooding extent occurred, with some parts of the system being affected more than others. So far, the system has not been subject to major human interventions, but technical al-terations such as channel clearing are being considered. Such proposals are prompted by drying up of floodplains and de-velopment of vegetation blockages in channels in the vicinity of settlements and safari camps. Such actions are, due to their capacity to alter the natural hydrological and geomorpholog-ical dynamics of the system, potentially harmful to the Delta ecosystem functioning, and their technical results may not be sustainable. Understanding of the processes causing flood decline and flooding shifts is thus essential for effective man-agement of the natural resources associated with the Delta in general, and for making informed decisions about any pro-posed technical interventions in particular.
In this paper we systematize and analyse hydrometric data from channels in the eastern part of the Okavango Delta, where hydrological responses differ widely, suggesting that several processes are acting simultaneously to produce the observed flooding conditions. We describe the processes causing the observed hydrological responses, and thus im-prove the understanding of the hydrological functioning of the Okavango Delta system. In a broader context, using the example of the Okavango Delta we illustrate issues of flood-ing dynamics and change in the channel-floodplain network of a low gradient broad system, as influenced by a combina-tion of endogenic and exogenic processes, and as modified by hydraulic relationships between channels and floodplains.
2 Study site
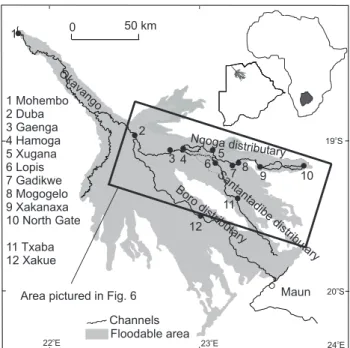
The main features of the Okavango Delta have been described in detail elsewhere in the literature (e.g. Gieske, 1997; Gumbricht et al., 2004; McCarthy et al., 1998). In brief, the Delta is a large alluvial fan with a mean surface gradient of approximately 1:3700, in which water and sedi-ment from the inflowing Okavango river are spread across a convex conical surface through a complex system of chan-nels and floodplains (Fig. 1). The upper part of the Delta, the Panhandle, is a 15 km broad fault-bounded flat-bottomed val-ley, with a well defined meandering channel. At the apex of the alluvial fan proper, the channel flows through a relatively unbounded system of papyrus swamps and floodplains. Fur-ther downstream, the presence of chains of islands results in differentiation of relatively separate distributaries, forming the characteristic fan shape, with Chief’s Island, the largest land mass in the Delta, dividing the system into an eastern and a western part. The most eastern distributary, includ-ing the Nqoga, Maunachira and Khwai river systems, re-ferred to here simply as the Nqoga, is the direct extension of the main Okavango channel and thus considered the primary
distributary. The Santantadibe distributary, which includes the Mboroga, Gomoti, Santantadibe and Mogogelo river sys-tems branches off from the Nqoga east of Chief’s Island. The Boro distributary branches off west of Chief’s Island. The Santantadibe and the Boro are considered to be secondary distributaries.
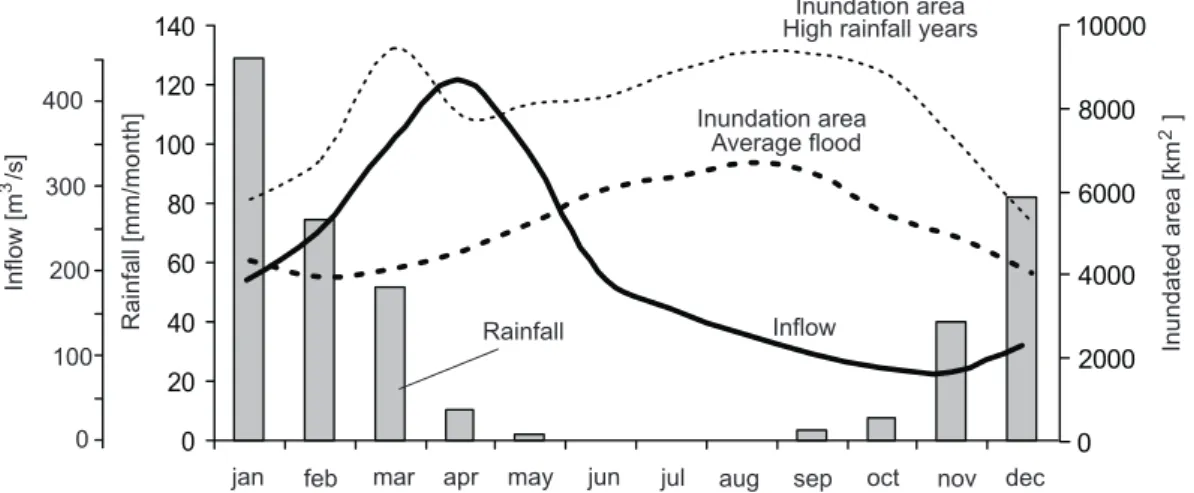
The Okavango Delta is subject to an annual flood event. This is caused primarily by seasonal rainfall in the catch-ment, some 600 km distant from the Delta. The flood wave of the Okavango River causes the discharge at the Delta inlet to increase from about 100 m3s−1to more than 600 m3s−1on average (Fig. 2). This flood wave results in an expansion of the inundated area in the Delta from an annual minimum of 4000–6000 km2to an annual maximum of 6000–12 000 km2. The expansion of the inundated area is out of phase with the rainy season: the rainy season lasts from November to March, while the Okavango river flood wave peaks at the Delta inlet in April, and maximum flood extent is recorded in August/September (Fig. 2). This delay is partly caused by the distance of the headwaters from the Delta, and partly by slow propagation of the flood in the Delta itself.
Rainy season flooding either takes the form of a major expansion of inundated area coincident with local rainfall, or of inundation of small, isolated depressions. The first is observed only during years when local rainfall exceeds 700 mm a−1; such conditions occurred only 3 times in the last 30 years. During average and low rainfall years, the effects of local rainfall are usually only manifested by lo-cal water level rise within the inundated part of the system, while the total inundated area continues to decline during the rainy season (Fig. 2). Inundation of pans and depressions might occur depending on rainfall intensity, but is usually short-lived. Despite the fact that local rainfall does not usu-ally cause flood expansion, it is an important factor influenc-ing the annual maximum flood extent. Statistical modellinfluenc-ing (Gumbricht et al., 2004) indicates that both maximum an-nual flood extent and Delta outflows vary in response to a combination of inflow, local rainfall, and antecedent wetness conditions.
Flood propagation in the Delta takes place as a combina-tion of in-channel and off-channel flows. The system is de-positional, not erosive, and so generally channels are not in-cised, but at surface level or elevated. Channel banks are formed by reeds and sedges (Ellery et al., 2003) and are thus permeable, and channels have rectangular, rather than v-shaped cross-sections. Due to the permeable nature of chan-nel banks and the low topographic relief, chanchan-nels have some hydraulic connection to the surrounding back-swamps and floodplains at most flood stages. The main channel of the Okavango is approximately 200 m wide at the Delta inlet, and its width reduces downstream to approximately 20–30 m. Distributary channels are typically less than 20 m wide, and can be as narrow as 2–3 m.
The off-channel flows play an important role in feeding the distributaries. Within each of the distributaries there is a
Okavango 22 Eo 20 So 19 So 23 Eo 24 Eo 0 50 km Maun 1 Mohembo 2 Duba 3 Gaenga 4 Hamoga 5 Xugana 6 Lopis 7 Gadikwe 8 Mogogelo 9 Xakanaxa 10 North Gate 11 Txaba 12 Xakue 1 2 3 4 6 5 7 8 9 10 11 12 Channels Floodable area
Nqoga distributary Boro distribut ary Sant ant adibe distribut ary
Area pictured in Fig. 6
Fig. 1. The Okavango Delta and its main features.
relatively well defined channel, or system of channels. How-ever, these channels often have no direct (or a very limited) hydraulic link to the main channel of the Okavango river. The accession of main channel flood waters to distributaries takes place mostly through seepage across the vegetated banks and by flow through a system of interconnected flood-plains. Downstream, that dispersed flow may be partly re-concentrated within distributary channel(s) or travel through relatively independent, floodplain flow systems without dis-tinct channels. In the distal parts of the Delta floodplains and channels dry up annually.
3 Materials and methods
Data used in the analyses presented here were obtained from the Department of Water Affairs (DWA) who have a hydro-logical monitoring network for the Okavango Delta. This network is comprised of numerous water level gauging sites (H) and several discharge measurement sites (Q), all lo-cated on channels. Measurements are theoretically done on a monthly basis; more frequent records are kept only at Mo-hembo, the inflow, and Maun, an important outflow. Due to accessibility and logistical problems, long gaps in record are often present. Water levels are read from staff gauges. Discharge measurements are made with a current meter in natural channel cross-sections using standard hydrological methods. For the purpose of this work, discharge, mean flow velocity, mean and maximum recorded profile depth as well as width of measurement section, were extracted from DWA database for each discharge record (these were not avail-able for water level stations). The elevation of the channel
0 20 40 60 80 100 120 140
jan feb mar apr may jun jul aug sep oct nov dec
Rainfall [mm/month] Inundated area [km ] 2 Inflow [m /s] 3 Inflow Rainfall Inundation area Inundation area Average flood 0 2000 4000 6000 8000 10000 High rainfall years
0 100 200 300 400
Fig. 2. Seasonality in inflow, rainfall and flood extent in the Okavango Delta. Monthly means for 1992–2000.
bed with respect to gauge zero level (arbitrary) was then calculated by subtracting recorded channel depth from the recorded water level.
All available time series were plotted and the data series were visually screened for outliers and possible systematic errors, but no strict outlier identification procedure was ap-plied. The visually detected outliers were identified mostly as typographic errors, which in several cases were confirmed by reverting to original measurement forms. In doubtful cases, the rule was to leave the suspect data points as they were, and during the analyses to take into consideration that they were possibly erroneous points.
In most of the analysed data series trends were conspicu-ous and detectable by visual interpretation, and therefore sta-tistical trend analyses were considered superfluous. Methods used in the analyses thus comprised visual interpretation and comparison of trends for various stations. This was done in a qualitative manner, and within a framework of the identifica-tion of possible hydrological links between those parts of the analysed system that were represented by the measurement stations.
4 Observed variation in hydrological inputs and re-sponses
4.1 Hydrological inputs
Rainfall and inflow to the Delta declined considerably from the 1970s to the 1990s (Fig. 3), with the lowest rainfall and inflow recorded respectively in 1995 and 1996. After 1996, there is a slight upward trend in inflow and a less accentuated one in rainfall.
4.2 Water levels and discharges in the secondary distribu-taries (Boro and Santantadibe)
The behaviour of flooding within each of the the two sec-ondary distributaries is similar, and for the sake of brevity is presented here using only selected stations considered repre-sentative of these systems. Flooding in the Boro distributary (Fig. 4) is very dynamic in terms of both seasonal and in-terannual variation in water levels and discharges, and, by comparison with Fig. 3, corresponds well with the variation in hydrological inputs. A characteristic feature of the inter-annual variation is the decline in water levels and discharges occurring in the 1990–1996 period and their subsequent re-covery between 1997 and 2000. By contrast, in the Santanta-dibe distributary, there is very little seasonality in water lev-els, and discharges display a pattern that appears to bear no relation to the water level trend.
4.3 Trends and variation in water levels and discharges in the primary distributary (Nqoga)
The Gaenga, Hamoga, Gadikwe, Mogogelo and Xakanaxa stations in the Nqoga distributary (Fig. 5), show trends in wa-ter levels that do not correspond to the inflow trend presented in Fig. 3. Water levels at Gaenga, Hamoga and Xakanaxa have risen continuously throughout the period of observa-tions, while those at Gadikwe and Mogogelo were initially stable, but started dropping in the 1990s, without the charac-teristic recovery observed in inflow to the Delta, and in other distributary systems during the late 1990s. Duba, Xugana and Lopis (Fig. 5) displayed stable water levels between 1970 and 1990, and after that water levels dropped till 1996 and subsequently recovered to achieve levels in 2000 similar to those of the 1980s. The station from the distal part of the dis-tributary, North Gate, showed rather erratic water level fluc-tuations, with a strong rise often observed during rainy sea-sons (November-March). The amplitude of seasonal water
0 200 400 600 800 1000 1000 800 600 400 200 0 0 4000 8000 12000 16000 1970 1975 1980 1985 1990 1995 2000 Discharge[ms] 3 -1 Rainfall[mma] -1 Inflow[mlnma] 3 -1 Rainfall Inflow
Fig. 3. Discharge hydrograph of Okavango river at Mohembo, mean annual rainfall and total annual inflow to the Okavango Delta.
0 1 2 3 1970 1975 1980 1985 1990 1995 2000 [m] [m] 1970 1975 1980 1985 1990 1995 2000 0 25 50 [m s ]3 -1 [m s ]3 -1 H H Q Q 0 1 2 0 10 20
Txaba (Santantadibe) Xakue (Boro)
Fig. 4. Water levels and discharges for selected stations on the Santantadibe and Boro system. Q – discharge, H – water level.
level fluctuations was low at Gaenga and Hamoga (<0.15 m), but was more pronounced at Duba and the remaining stations (typically >0.3 m).
4.4 Trends and variation in flow characteristics and channel geometry at the Nqoga distributary stations
Gaenga station on Nqoga (Fig. 6) showed a steady decline in discharges concurrent with the decline in flow velocities, and accompanied by a steady rise in channel bed elevation, during the entire observation period. At the Hamoga site (Fig. 6) discharges rose strongly between 1973 and 1979 and subsequently stabilized. Channel bottom elevation dropped
by over 2 m between 1974 and 2000. A small reduction in mean flow velocity was recorded between 1974 and 2001. At Xakanaxa (Fig. 6), flow velocity and discharge varied in a pattern approximating a 10-year cycle. Channel bed ele-vation decreased by approximately 0.1 m between 1970 and 2001.
5 Interpretation
The responses observed in different reaches of the Nqoga dis-tributary differ considerably, and do not appear to display any consistent pattern along the system. This is in contrast to the
1 2 0 1 1 2 0 1 Xugana Lopis Gadikwe Mogogelo 1 2 1 2 Xakanaxa Hamoga 1 2 3 Gaenga North Gate 0 1 2 Duba W ater level [m above gauge zero] W ater level [m above gauge zero] 0 1 2 1970 1975 1980 1985 1990 1995 2000 1970 1975 1980 1985 1990 1995 2000
Fig. 5. Water level hydrographs for stations in the Nqoga system. Note differences in scale between Duba, Gaenga, North Gate and the remaining stations.
other distributaries, i.e. Boro and Santantadibe, the responses of which differ, but are consistent within each. To explain the differences between the distributaries as well as differences between discrete reaches in the Nqoga, we consider several processes:
– channel aggradation,
– channel/floodplain interactions, – human interventions in the system,
– the difference in flood response to river inflows and
lo-cal rainfall,
– dynamics of aquatic vegetation.
5.1 Channel aggradation processes
The process of aggradation of the Okavango Delta chan-nels with bedload sediment (composed of well sorted fine to medium sands) and its effects on hydrological and ecolog-ical conditions have been described by McCarthy and Ellery (1997). In short, the process results from the sediment car-ried into the system by the Okavango river being trapped in the channels, as it cannot be carried across the vegetated
banks due to low flow velocities. The deposition of sedi-ment within the channel initiates a series of feedbacks. The build-up of the sediment causes a reduction of slope in both channel bed and water level. This reduces flow velocity and makes the channel susceptible to vegetation blockage, either in the form of accumulation of floating plant debris, or colo-nization by aquatic vegetation, or most often by a combina-tion of these. Upstream of the aggraded or blocked reach, the lateral (from channel to floodplain) gradient increases con-siderably. Breach of the flanking vegetation may occur along a line of weakness, such as a hippo path, and a new channel can form, bypassing the blocked section. Neotectonic activ-ity may facilitate development of the new channel.
Conditions indicating channel aggradation, i.e. a gradual rise in river bed level, a concomitant rise in water level and reduction in channel discharge, occurred at Gaenga on the Nqoga. The process at Gaenga accommodates sediment sup-plied by the main Okavango river, and is essentially a contin-uation of the aggradation of the Nqoga and upper Mboroga described by McCarthy et al. (1987) and Wilson (1973). The gradual rise in water levels is observed also at Hamoga, where it must be an effect of the same process, indicating its sub-regional character. However, changes in channel ge-ometry and channel discharge at Hamoga do not indicate aggradation. The channel at Hamoga is man-made, and its
H H Q V [m] [m] [m] CB CB Q V
Gaenga Hamoga Xakanaxa
H CB Q V 0.0 0.5 1.0 1.5 0 5 10 -2 -1 0 1 2 -3 -2 -1 0 1 2 3 0 20 40 0.5 0.7 0.9 30 50 70 -4 -3 -2 -1 0 1 2 3 0 5 0 5 0 5 197 197 198 198 199 199 2000 0 5 0 5 0 5 197 197 198 198 199 199 2000 0 5 0 5 0 5 197 197 198 198 199 199 2000 0 .1 .2 0 0 [m s ]-1 [m s ]-1 [m s ]-1 [m s ]3 -1 [m s ]3 -1 [m s ]3 -1
Fig. 6. Discharge and channel characteristics for stations in the Nqoga system. V – flow velocity, Q – discharge, H – water level, CB – channel bottom elevation relative to gauge zero, vertical lines in the Hamoga graphs represent Smith’s Channel clearing activities.
Boro Nqoga Maunachira Mboroga Khwai Sant ant adibe Okavango Duba Mmadinare Gaenga Hamoga Smith's Channel Xugana Lopis Txaba Gadikwe Mogogelo Xakanaxa North Gate
Main blockage of the Nqoga
Reaches where aggradation currently occurs Main directions of floodplain flows Areas affected by reduction in flood levelsdue to upstream aggradation Channels
Floodplains
0 10 km
Gomoti Mogogelo
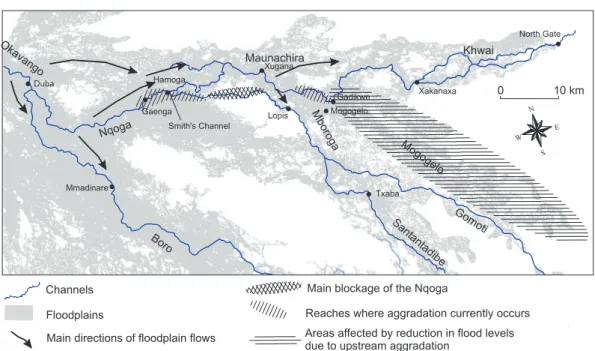
Fig. 7. Interpretation of flow system and its controls in the Nqoga distributary.
hydrological responses are explained in detail below in a fol-lowing section on human interventions in the system. A crit-ical factor in the aggradation of the Gaenga/Hamoga area is that the morphology is such that the water lost from the channel to the floodplains is retained within the distributary, albeit as off-channel flow. Therefore, no downstream effects
(reduction of water level and discharges) of this process are observable yet.
Channel aggradation is also taking place in the Mau-nachira reach between Xugana and Gadikwe (Fig. 7), but this is not directly captured by the observation network. McCarthy et al. (1992) investigated this stretch of the
Discharge
[m
s
]
3
-1
0
50
100
150
200
1970
1975
1980
1985
1990
1995
2000
Fig. 8. Comparison of observed channel discharges at Gaenga (circles), and distributary discharges simulated by a hydrological model1for Gaenga cross-section (solid line).
Maunachira in 1987–1989, and found a significant reduction in channel flow velocity, and reduction of sediment transport rate, occurring in the downstream direction, accompanied by high lateral channel-floodplain water level gradients in the upper part of that reach. These were interpreted as indicative of aggradation of the lower reach of the Maunachira, and redirection of channel flow towards the flanking floodplains. The decline in water levels at the Gadikwe and Mogogelo sites (Fig. 5) indicates that that area is currently being de-prived of water. At Txaba (Fig. 4) and Xakanaxa (Fig. 5) a rise in water levels is observed, probably indicating that water previously supplying the Gadikwe and Mogogelo re-gion is being redirected to those locations. The flow be-tween the upstream part of the failing Maunachira and the Khwai may be via floodplains to the north of the Maunachira channel (Fig. 7), in a sense shortening the route of the Mau-nachira between Xugana and Xakanaxa. Such a possibility is corroborated using reasoning similar to that applied by Mc-Carthy et al. (1992). Namely, the spectral response as seen in satellite images indicates the presence of actively growing papyrus at the eastern tip of Xugana lediba (lake). This indi-cates that fresh, nutrient rich water is passing through there towards floodplains linking that site with the Xakanaxa area. The effects of aggradation of the Maunachira should also be manifested by rising water levels in the upstream part of the affected reach, i.e. at Xugana. Water level rise at Xugana was observed only until 1990, after which the general re-duction in water level characteristic of the 1990s took place. As discussed below, the Xugana site responds strongly to the annual flood pulse and interannual variation in flood size (Fig. 5). Therefore, the eventual changes in Xugana water levels resulting from aggradation of the middle Maunachira are probably masked by the response of water levels at this station to the interannual variation in discharge.
5.2 Channel-floodplain interactions
Seasonal water level fluctuations are much more pronounced at Xugana and Lopis, and at Gadikwe and Mogogelo, than they are at Hamoga and Gaenga (Fig. 5). Also, water lev-els at Duba show stronger seasonal fluctuations than Gaenga and Hamoga. Previously, this had been attributed to the ef-fect of flow confinement (McCarthy et al., 1998; Wilson and Dinc¸er, 1976). In the Gaenga and Hamoga area the flow emerging from the Panhandle is not constrained, as the flood-plains surrounding the channel are wide. Water flowing in from the Duba area, when spread uniformly over the large area of floodplains around Gaenga thus causes only minor water level fluctuations. Further downstream, the flow is con-fined in the Xugana area. As a result, seasonal water level fluctuations again become large. There is, however, a pro-nounced interannual variation in water levels at the down-stream sites of Xugana and Lopis, which cannot be explained by the flow confinement model, as this variation is not visi-ble at the upstream sites of Gaenga and Hamoga. This sug-gests that the Xugana and Lopis sites are supplied not only from the Nqoga channel, but also by an additional source system of different dynamics. Given the setting of the Xu-gana and Lopis area, flow is delivered there by accession from the main Nqoga channel to the floodplain system flank-ing its north bank (Fig. 7). Seasonally varyflank-ing flows orig-inate from upstream of Gaenga, probably from the vicinity of Duba, where seasonal fluctuations in channel water levels are well pronounced. Inflow to that floodplain system likely stems from overbank spill through the east bank of the main channel.
The differences in dynamics of channel and floodplain flows in the vicinity of Gaenga are highlighted in Fig. 8, which compares observed discharges with simulated dis-charges produced by a semi-distributed hydrological model1. The model simulation represents the distributary-wide dis-charge required to reproduce the flood expansion observed in the downstream parts of the distributary. Floodplain flows, which must be invoked to account for the difference between the simulated distributary discharge and observed channel discharge, are obviously much more dynamic than the chan-nel flow, and on average would be of a similar order of mag-nitude as the channel flow.
The separation of total flow into channel and flood-plain flows characterized by different seasonal and inter-annual dynamics can be explained by the specificity of channel/floodplain interactions. Channels in the Delta are bounded either by floating papyrus stands or by emergent vegetation, usually sedges and grasses (Ellery et al., 1995). Along papyrus-defined banks, a small rise of channel wa-ter level causes a rise of the floating papyrus rhizome mat; 1Wolski, P., Savenije, H., Murray-Hudson, M., and Gumbricht, T.: Modelling the hydrology of the Okavango Delta, Botswana, J. Hydrol., submitted, 2006.
this results in a rapid significant reduction in resistance to flow from the channel to the flanking floodplain. Along those reaches bounded by rooted sedges and grasses, the resistance to lateral flow from channel to floodplain is a function of depth: increasing channel water levels meet with progres-sively decreasing resistance to outflow. This is a result of a decline in stem density, diameter and resistance to bending with height in the bank vegetation. In both settings the flood wave surcharging the channel is accommodated in the flood-plains. This floodplain flow may be re-directed into a sepa-rate distributary, or re-routed within a given distributary. The effect of this extraction of surcharge flow volumes is that the downstream reaches of the channel receive a relatively con-stant amount of water. The channel water level hydrograph thus gets considerably flattened in the downstream direction, i.e. seasonal and interannual variation is considerably atten-uated.
This separation of flow into channel and floodplain flows of different seasonal and interannual dynamics, apart from causing the differences in seasonal amplitude of water level fluctuations within the Nqoga distributary, is considered to be the principal cause of major differences in flood dynamics at the scale of the entire Delta system. This process occurs in the area where the Boro distributary departs from the Oka-vango main channel. Flow accession to the Boro system is primarily via surcharge accession, causing the large seasonal water level fluctuations and expansion/contraction of the in-undated area observed in this distributary, while the supply to the Nqoga distributary generally remains more stable and permanent.
5.3 Effects of human interventions
The Hamoga site is located at the inlet to Smith’s Channel, which is a man-made channel opened in September 1973. It was cut between the failing Nqoga channel, upstream of a blockage, and one of the backswamp channels connecting to the Maunachira to facilitate boat passage. The length of the cut stretch was 200 m. At the time of cutting, water level in the Nqoga channel was 1.5 m above that of the flanking floodplains, and vigorous flow out of the channel with bed erosion was observed immediately after cutting. Data from Hamoga show that hydrological conditions and channel ge-ometry have been changing since the opening of the chan-nel, and that they are still changing today, 30 years later. Initially, channel discharge increased rapidly, but stabilized after 5 years. In view of the continuously changing chan-nel geometry (i.e. erosion of the chanchan-nel bottom) this dis-charge stabilization must express the adjustment of the sub-regional water level gradient to the presence of that channel. The change in the geometry of Smith’s Channel expresses in turn a much slower adjustment of channel gradient to the prevailing sub-regional water level gradient. The rise in wa-ter levels at Hamoga seems to be independent of processes
taking place within the channel, and probably results instead from the larger-scale process of aggradation of the Nqoga.
The observable effects of the opening of Smith’s Chan-nel on flooding in the distributary are relatively local. The strong increase in Smith’s Channel discharges between 1973 and 1978 is not reflected at upstream (Gaenga), nor down-stream (Xugana) sites. The presence of Smith’s Channel has not affected the process of aggradation of Nqoga, and wa-ter continues to build up in the failing reach as is evident from rising water levels at Hamoga and Gaenga. The ob-served steady rise in water levels at Xakanaxa could poten-tially be caused by the opening of Smith’s Channel, as was suggested by Kraatz (1983). However, in view of the pro-cesses of aggradation reported by McCarthy et al. (1992) in the mid-Maunachira, the Xakanaxa water level rise is more probably caused by redirection of water from the headwaters of the Gomoti and Mogogelo than by the opening of Smith’s Channel. It is, however, possible (although not evident from the data) that the opening of Smith’s Channel caused an in-crease in bedload transport to the Maunachira and thus ac-celerated the process of its aggradation between Xugana and Gadikwe.
In spite of relatively high water flow velocities, Smith’s Channel, and the reaches downstream of it, have been blocked with floating papyrus several times since its open-ing. These blockages have periodically been cleared primar-ily for the purposes of keeping the channel navigable. Data on the clearing activities are available only for the period af-ter 1983. These took place in February–May 1994, January– March 1996, September 1996, May–June 1997 and Septem-ber 1997 (Fig. 6). The channel has not been cleared since then, and in 2002 a papyrus blockage extended for more than 1 km downstream. Only the 1997 clearing activities were as-sociated with an observed increase in flow velocities and dis-charge. It is reported that when the channel is blocked, there is relatively little flow on its downstream side (McCarthy et al., 1992). The inflowing water, as recorded at Hamoga, must thus be redirected from the channel to the surrounding floodplains. Therefore, the blocking of the Smith’s Chan-nel does not significantly affect flows between Nqoga and Maunachira, implying that the bulk of water flowing to the Maunachira is supplied from through-bank accession. 5.4 Responses to local rainfall and river flood
Local rainfall plays a role in flooding at North Gate on the Khwai (Fig. 5). There are distinct peaks in water level oc-curring during the rainy season. Although the North Gate record is fragmentary, the long-term variation appears to cor-respond to variation in rainfall more than to variation in up-stream flows. The correlation coefficient r between the maxi-mum flood season water level at North Gate and annual rain-fall is 0.78, between the maximum flood season water level at North Gate and Xakanaxa flow velocity is 0.56 and be-tween the maximum flood season water level at North Gate
and annual Mohembo inflow volume is 0.60. At Lopis and Xugana, a rise in water levels is often recorded during rainy seasons (Fig. 5), but it is superimposed on the much stronger flood peak corresponding to the Okavango river flood pulse, and the latter dominates the interannual variation in water levels at these stations. At Xakanaxa, rainy season water level peaks are visible only during high rainfall years (1974, 1978, 1989, 2000), while at Gaenga and Hamoga there is no direct effect of rainfall apparent, and trends at these stations are clearly not related to rainfall variation.
5.5 Dynamics of aquatic vegetation
Discharge at Xakanaxa shows variation approximating a 10-year cycle, and is unrelated to the variation in water levels (Fig. 6). This peculiar variation is observed also in the San-tantadibe stations (Txaba in Fig. 4 and others not presented here), and has never been described before in the Okavango Delta, and to the best of our knowledge, in any other wetland system. At this stage, the processes underlying this cycle can only be hypothesised, and we think that a possible ex-planation is related to the dynamics of aquatic vegetation, as outlined below.
The velocity variation is not accompanied by a concurrent water level change. As there is no water level change, it is not likely that the flow velocity variation results from a change in water surface gradient. Therefore, the only possible explana-tion of the velocity variaexplana-tion seems to be a change in channel conveyance capacity. As the channel geometry (width and depth) also does not vary concurrently with flow velocity, the variation in channel conveyance capacity has to be attributed to a change in resistance to flow. This could be caused by cyclic changes in channel or channel margin vegetation. Nu-trients are supplied to the Okavango Delta mostly by the in-flowing water. Because the loads are low, the system is gen-erally considered oligotrophic (Cronberg et al., 1996), and channel-fringe and floodplain emergent macrophyte species are adapted to these conditions, showing very tight nutri-ent cycling (Mitsch and Gosselink, 2000; Thompson, 1976). Given the anaerobic conditions prevailing in the perennially flooded and characteristically low-fluctuation Santantadibe distributary, it is possible that the discharge variations oc-cur in response to a cyclic change in the density of channel fringing vegetation (and consequently its resistance to move-ment of water, both within channel and between channel and floodplain). Such a variation could be triggered by spikes in nutrient input (as, for example, may result from an extensive burn, or the re-flooding of desiccated floodplains, upstream – both these processes have been recorded in the provenance of this system). The increased nutrient supply would result in a rapid overgrowth of channel fringe vegetation, with a conse-quent increase in resistance to flow, but no change in “hard” channel geometry. The internal cycling efficiency of fring-ing plants would ensure that the effects of the spike would support growth for a number of seasons. Under the
anaero-bic conditions, however, senescence would gradually remove nutrients from the active vegetation to be sequestered, or re-moved, in the slow cycling detrital processing system. The fringing vegetation would gradually revert to a less dense growth, allowing channel velocities to increase again. Un-doubtedly, more work is required to elucidate these changes and their possible causes, and eventually to confirm or re-ject the hypothesis about the vegetation-hydrology feedback stated here.
6 Conclusions
The data presented here were analysed in the context of the improvement of the understanding of seasonal and long-term flood pulsing, their changes and effects on hydrology in a low gradient alluvial channel-floodplain system. We have described a system where channels and floodplains display significantly different seasonal and inter-annual dynamics of flood wave propagation. As a result, hydrometric stations record the effects of in-channel changes, but the effects of variation in hydrological inputs may not be captured by wa-ter level or discharges measurements. We were, however, able to show that such variation does occur in the analysed system at the distributary level. This was done based on data from a few stations which to a certain extent integrated distributary-wide responses, and displayed inter-annual vari-ation qualitatively similar to the varivari-ation of the hydrolog-ical inputs. Due to a lack of certainty about the extent to which such stations reflect distributary-wide dynamics, as opposed to channel dynamics only, systematic analyses of flood changes in response to hydrological inputs were not possible. The Okavango Delta is a system with rather un-usual channel-floodplain interactions, which may create ex-treme differences in within-channel and off-channel flood dynamics. Given the geomorphological setting of the Delta, such extreme behaviour may not be encountered in other floodplain systems. However, this study serves to show that analyses of flood pulse dynamics, change, and hydrological variation in a large low gradient system cannot be done based on measurements at a single point in a system cross-section. To be meaningful, such analyses must be done using a com-prehensive array of hydrometric observation sites, designed to capture variation of both in-channel and off-channel flows, and should preferably include flood extent maps derived from remote-sensing images. Little systematic work of this nature has been reported in the hydrological literature.
The data set presented in this study allowed for the de-scription and characterization of major differences in sea-sonal and interannual dynamics in water levels and dis-charges within the analysed distributary. More importantly, the comparison of data from various stations allowed the identification of probable causes of these differences. Water levels and discharges at any given channel site in the Nqoga system are influenced by a complex interplay of flood wave
and local input, modified by channel-floodplain interactions, sedimentation and technical interventions, both at the given site and upstream. Additionally, we hypothesize that there is a feedback between ecology and hydrology takin the form of nutrient pulsing driven cyclical variation of channel vegeta-tion and thus channel conveyance. All these processes act at different scales, affecting parts of the Nqoga distributary, but also the entire system of the Okavango Delta. The analyses presented here lay the framework for on-going work address-ing the seasonal and inter-annual dynamics of the flood pulse in the Okavango Delta, that make use of detailed satellite data-derived flood maps.
Acknowledgements. Work presented here was funded by the European Union in the framework of a project entitled Water and Ecosystem Resources for Regional Development, coded ICA-4-CT-2001-10040. Department of Water Affairs, Republic of Botswana is acknowledged for providing the data.
Edited by: K. Bishop
References
Alsdorf, D. E., Melack, J. M., Dunne, T., Mertes, L. A. K., Hess, L. L., and Smith, L. C.: Interferometric radar measurements of water level changes on the Amazon flood plain, Nature, 404, 174–177, 2000.
Chen, Y. C. and Chiu, C. L.: A fast method of flood discharge esti-mation, Hydrol. Processes, 18, 1671–1684, 2004.
Cronberg, G., Gieske, A., Martins, E., Prince-Nengu, J., and Sten-strom, I.: Major ion chemistry, plankton, and bacterial assem-blages of the Jao/Boro River, Okavango Delta, Botswana: the swamps and flood plains, Arch. Hodrobiol./Suppl., 3, 335–407, 1996.
Ellery, W. N. and McCarthy, T. S.: Principles for the sustainable uti-lization of the Okavango Delta ecosystem, Botswana, Biological Conservation, 70, 159–168, 1994.
Ellery, W. N., Ellery, K., Rogers, K. H., and McCarthy, T. S.: The role of Cyperus papyrus L. in channel blockage and abandon-ment in the northeastern Okavango Delta, Botswana, African J. Ecol., 33, 25–49, 1995.
Ellery, W. N., McCarthy, T. S., and Smith, N. D.: Vegetation, hy-drology, and sedimentation patterns on the major distributary system of the Okavango Fan, Botswana, Wetlands, 23, 357–375, 2003.
Gieske, A.: Modelling outflow from the Jao/Boro River system in the Okavango Delta, Botswana, J. Hydrol., 193, 214–239, 1997. Gumbricht, T., Wolski, P., and McCarthy, T. S.: Forecasting the spa-tial extent of the annual flood in the Okavango Delta, Botswana, J. Hydrol., 290, 178–191, 2004.
Hauer, F. H. and Lorang, M. S.: River regulation, decline of ecolog-ical resources, and potential for restoration in a semi-arid lands river in the western USA, Aquatic Sci., 66, 388–401, 2004.
Junk, W. J., Bayley, P. B., and Sparks, R. E.: The flood-pulse con-cept in river-floodplain systems, Special publication of the Cana-dian J. Fisheries and Aquatic Sci., 106, 110–127, 1989. Kraatz, D. B.: Improvement of the water supply for flood recession
farming in the molapo belt betwen Maun and Shorobe and in the Thaoge area, Tech. rep., FAO/Government of Botswana, Molapo Development Project, TCP/BOT/2201, Maun, Botswana, 1983. McCarthy, T. and Ellery, W.: The fluvial dynamics of the
Maunachira channel system, northeastern Okavango swamps, Botswana, W. Water, South Africa, 23, 115–126, 1997. McCarthy, T. S., Ellery, W. N., and Rogers, K. H.: Observation on
the abandoned Nqoga Channel of the Okavango Delta, Botswana Notes and Records, 19, 83–89, 1987.
McCarthy, T. S., Ellery, W. N., and Stanistreet, I. G.: Avulsion mechanisms on the Okavango Fan, Botswana: the control of a fluvial system by vegetation, Sedimentology, 39, 779–795, 1992. McCarthy, T. S., Bloem, A., and Larkin, P. A.: Observations on the hydrology and geohydrology of the Okavango Delta, South African J. Geology, 101, 101–117, 1998.
Middleton, B. A.: Wetland restoration: Flood pulsing and distur-bance dynamics, John Wiley and Sons, New York, 1999. Mitsch, W. J. and Gosselink, J. G.: Wetlands, John Wiley and Sons,
New York, 2000.
Odum, H. T.: Ecological and General Systems: an introduction to systems ecology, University Press of Colorado, Niwot, Co., 1994.
Polonsky, V. F.: Physicostatistical approach to river delta hydrology, J. Hydraulic Eng., 122, 333–340, 1996.
Richards, K., Brasington, J., and Hughes, F.: Geomorphic dynamics of floodplains: ecological implications and a potential modelling strategy, Freshwater Biology, 47, 559–579, 2002.
Stern, D. A., Khanbilvardi, R., Alair, J. C., and Richardson, W.: Description of flow through a natural wetland using dye tracer tests, Ecol. Eng., 18, 173-184, 2001.
Thompson, K.: The primary productivity of African wetlands, with particular reference to the Okavango Delta, in Symposium on the Okavango Delta and its future utilization, Botswana Society, Gaborone, Botswana, 1976.
Tockner, K. and Stanford, J. A.: Riverine floodplains: present state and future trends, Environ. Conservation, 29, 308–330, 2002. van der Nat, D., Tockner, K., Edwards, P. J., Ward, J. V., and
Gur-nell, A. M.: Habitat change in braided flood plains (Tagliamento, NE-Italy), Freshwater Biology, 48, 1799–1812, 2003.
Wilson, B. H.: Some Natural and Man-made Changes in the Chan-nels of the Okavango Delta, Botswana Notes and Records, 5, 132–153, 1973.
Wilson, B. H. and Dinc¸er, T.: An introduction to the hydrology and hydrography of the Okavango Delta, in Symposium on the Okavango Delta and its future utilization, Botswana Society, Gaborone, Botswana, 1976.
Wolff, C. G. and Burges, J.: An analysis of the influence of river channel properties on flood frequency, J. Hydrol., 153, 317–337, 1994.
Wyzga, B.: Estimating mean flow velocity in channel and floodplain areas and its use for explaining the pattern of overbank deposition and floodplain retention, Geomorphology, 28, 281–297, 1999.