HAL Id: hal-01890999
https://hal.archives-ouvertes.fr/hal-01890999
Submitted on 5 Aug 2020HAL is a multi-disciplinary open access archive for the deposit and dissemination of sci-entific research documents, whether they are pub-lished or not. The documents may come from teaching and research institutions in France or abroad, or from public or private research centers.
L’archive ouverte pluridisciplinaire HAL, est destinée au dépôt et à la diffusion de documents scientifiques de niveau recherche, publiés ou non, émanant des établissements d’enseignement et de recherche français ou étrangers, des laboratoires publics ou privés.
Main features of cosmic ray induced air showers
measured by the CODALEMA experiment
Lilian Martin, Richard Dallier, Antony Escudie, Daniel García-Fernández,
Florian Gaté, Alain Lecacheux, Benoît Revenu
To cite this version:
Lilian Martin, Richard Dallier, Antony Escudie, Daniel García-Fernández, Florian Gaté, et al.. Main features of cosmic ray induced air showers measured by the CODALEMA experiment. 35th In-ternational Cosmic Ray Conference, Jul 2017, Busan, South Korea. pp.414, �10.22323/1.301.0414�. �hal-01890999�
PoS(ICRC2017)414
measured by the CODALEMA experiment
Lilian Martin*,1,3, R. Dallier1,3 , A. Escudie1, D. García-Fernández1, F. Gaté1,
A. Lecacheux2 and B. Revenu1,3
1Subatech, CNRS/IN2P3, IMT Atlantique, Université de Nantes, Nantes, France 2LESIA, Observatoire de Paris, CNRS, PSL, UPMC/SU, UPD, Meudon, France.
3Unité Scientifique de Nançay, Observatoire de Paris, CNRS, PSL, UO/OSUC, Nançay, France.
E-mail: lilian . martin@subatech.in2p3.fr
The radio signals produced by extensive air showers initiated in the atmosphere by high energy cosmic rays are routinely observed and registered by the various instruments of the CODALEMA experiment located at the Nançay radio observatory and notably by the large array of self-triggering stations equipped with wide band and dual polarization antennas. Precise comparisons between observed radio signals and simulations performed with the SELFAS code allow most of the main features of the primary cosmic ray to be determined : arrival direction, energy and Xmax estimates from which the composition in the energy range covered by
CODALEMA may be derived. After a presentation of the analysis methods, its sensitivity will be discussed and the results obtained over a significant set of experimental events will be detailed.
35
thInternational Cosmic Ray Conference – ICRC2017
10-20 July, 2017Bexco, Busan, Korea
PoS(ICRC2017)414
Cosmic ray measured by the CODALEMA experiment L.Martin
1. Introduction
Initiated at the earliest years of the modern period of the wide international R&D effort for the radio detection of extensive air showers (EAS), the CODALEMA experiment has been constantly improving its detection capabilities and sensitivity [1]. The AERA engineering array at the Pierre Auger Observatory is focusing on combining radio electric field measurement with other available detection techniques [2] while the LOFAR radio-telescope is relying on very high number of antennas on a small area to oversample the radio footprint on the ground and to deduce precise EAS information [3]. CODALEMA is still pursuing its original goal of developing both a sensitive antenna and triggering system toward an efficient and fully autonomous apparatus dedicated to high energy cosmic ray detection. This paper reports on the latest results obtained with a sample set of data and especially on the derivation of the shower Xmax and the cosmic ray energy estimates.
2.The experimental setup and the acquisition system
Installed in the early 2000, at the radioastronomy station of Nançay, France, the CODALEMA experiment is now a set of various mature apparatus and prototyping instruments [1],[4]. Since few years, a set of 57 self-triggering autonomous stations (SA) scattered over roughly 1 km2 is the main CODALEMA detection system (Figure 1). The stations feature dual
horizontal polarization antennas equipped with the LONAMOS low noise amplifier and optimized to measure transients over a wide frequency band (10-200 MHz) and over a large dynamic range. Electronic boards have been developed to fulfill dedicated function (trigger, dating, digitization...) and installed in a double layer EMC compliant mechanical box (Figure 1). A multi-level triggering system has been developed to select narrow transients specific to air shower induced electric field and to reject signals produced by anthropic noise sources. A simple first trigger level compares band filtered analog signals to a programmable voltage level and is used to initiate on-board dating and digitization of the events. Further noise rejection is achieved using a second trigger level involving more sophisticated quantities such as the signal rise time. Finally, accepted events are sent by the stations to a central acquisition system which
2
Figure 1: The autonomous stations (white circle), the scintillators (red square) and the compact array (yellow triangle) superimposed on an areal view of the Nançay radioastronomy station (left). An autonomous station nearby a NenuFAR mini-array (right).
PoS(ICRC2017)414
aggregates events in time coincidences, reconstructs arrival directions, excludes coincidences pointing to identified sources and finally requests the full information for the accepted event from the local stations.
Surviving the early stage of the experiment a set of 13 scintillators covering a limited surface of 340 by 340 m2 allows to unambiguously detect high energy cosmic ray events (Figure
1). It provides a particle trigger sent to a dedicated GPS station for accurate time recording and off-line time coincidence with the autonomous stations. It requires that 5 scintillators out of 13 see a signal above 15 mV corresponding to a detection energy threshold of the order of 1015 eV
(considering the array extension). This trigger is also used to record signals from dedicated cabled antenna arrays and to provide software triggers sent over the network to distant antennas [4].
CODALEMA is taking data in this mode steadily since several months. On a typical period of a month, the scintillator array is producing of the order of 40 000 events while the central daq system retains of the order of 1 200 000 events from the SA array. This figure reduces to 60 events per month when requiring for a time coincidence between both arrays.
3. Event reconstruction in the scintillator array
A meticulous procedure [1] is applied to the scintillator signals in order to deduce informations from the cosmic ray. At first an analysis on the raw signal is performed to quantify and subtract parasitic oscillations and transients produced by LW perturbations and mismatched electronic elements. For each channel, timing, amplitude and integrated charge are evaluated. Individual timings are combined using a plane front approximation to calculate the cosmic-ray arrival direction. For each event, the particle density in each station is extracted from the corresponding deposited charge and converted in VEM units. A correction factor is used to take into account the transition effect, wherein arriving gamma particles are converted into charged particles inside the scintillator. Then, event by event, station positions are projected into the plane perpendicular to the arrival direction and containing the central detector (shower plane). The reconstruction of the ground particle density lateral distribution function (LDF) as a function of distance from the shower axis is performed assuming a NKG theoretical shape. With a minimizing procedure, we obtain the shower size and the coordinates of the shower core in the shower plane, which are then converted back to the array plane. The primary energy is then calculated as a function of the reconstructed shower size parameter.
4. Event reconstruction in the autonomous station array
Event reconstruction using the data from the autonomous stations is rather straightforward. Once recorded on disk the data are transferred into a Firebird database for an easy data mining and data selection. As a matter of fact, retrieving coincidences consists simply in an SQL request requiring to group database entries by identical event time. Once aggregated, reconstructed data from the different stations are combined and treated. Similarly to the scintillator data, the arrival direction of the coincidences is deduced using a plane front approximation and using only the timing information (the time jitter induced by the station self triggering system is negligible).
PoS(ICRC2017)414
Cosmic ray measured by the CODALEMA experiment L.Martin
Few examples of the radio signal footprint on the ground are shown in Figure 2 reflecting the variety of arrival directions and energies of the cosmic rays observed by the SA array and exhibiting low or high multiplicities, uniform or very different amplitudes.
Analysis of the transients (Figure 3) gives further information on the air shower features and its unambiguous identification. Thanks to its very wide frequency band, the spectral content derived from the short transients recorded provides very useful information (Figure 3) : strongly influenced by the antenna response, the high frequency patterns are directly correlated to the arrival direction; a quickly varying spectral index is also typical of an increase of the distance between the antenna distance relative and the shower core. Finally, polarization patterns, simply expressed as the hodograph of the electric field measured in this EW-NS plane (Figure 7) can be used to infer the shower properties : polarization pattern relatively uniform indicates an arrival direction far from the geomagnetic field and/or antennas far from the shower core. On the opposite, a large dispersion of the observed patterns reveals antennas surrounding the shower core and/or a dominant charge excess effect (symmetrical around the shower axis).
5. Inferring the EAS features using SELFAS
Earliest methodology applied to infer the EAS and cosmic ray properties from the radio signal was modeled on the technique used for particle detector data. A symmetry was assumed around the shower axis in order to extract the shower location while an exponential lateral distribution function was employed in order to derive an energy estimate of the cosmic ray. The varying interplay between the geomagnetic effect and the charge excess effect clearly compromises a perfect symmetry of the electric field around the shower axis and leads for
4
Figure 3: Waveforms (left) observed in the 17 EW antennas of the left-most event of Figure 2. The waveforms are arbitrarily shifted in time and in amplitude for readability. The corresponding PSD (right) are calculated in a time window centered around the transients and compared to noise reference levels (light gray lines).
Figure 2: Examples of radio signal amplitude footprints on the ground. The size of the circle surface is proportional to the sum of the square of the two polarization amplitudes while its color (early in blue, late in red) reflects the detection timing relative to the average timing. The gray dots represented the station locations.
PoS(ICRC2017)414
instance to a clear offset between the cores reconstructed respectively from the radio signals and from the particle density at ground [5]. In addition, an angular correction must be introduced for the energy calculation in order to take into account for the dependence of the geomagnetic effect to the angle between the local geomagnetic field and the cosmic-ray arrival direction. On the other hand, modern theoretical approaches simulating the radio signal induced by EAS have made significant progress and are now in relatively good agreement demonstrating that the radio emission mechanisms are understood. Therefore we have chosen in the analysis to proceed to careful and systematic comparisons between experimental data and simulations to infer the cosmic-ray properties.
5.1 SELFAS simulations
We use the SELFAS model [6] to calculate the electric field induced on a virtual array of antennas by a cascade of secondary particles initiated by ultra-high energy cosmic rays in the atmosphere. This approach is based on a microscopic description of the shower. Using relevant distributions of secondary electrons and positrons, individual contributions all along their tracks are calculated and summed up to compute the final electric field at given locations.
Basically, the SELFAS simulations produced for this analysis were performed with a fixed cosmic-ray energy of 1017eV, a random first interaction point (and thus random X
max) with a
thinning factor resulting in 20 million of generated particles from CONEX distributions [7]. The shower axis was set to the azimuthal and zenith directions taken from the experimental event considered and its core set at the center of a virtual array of 320 antennas. In the shower frame, these antennas were arranged on 16 branches with an antenna density decreasing with increasing distance to the shower core (Figure 7). 50 proton and 10 iron induced EAS were simulated per experimental coincidence.
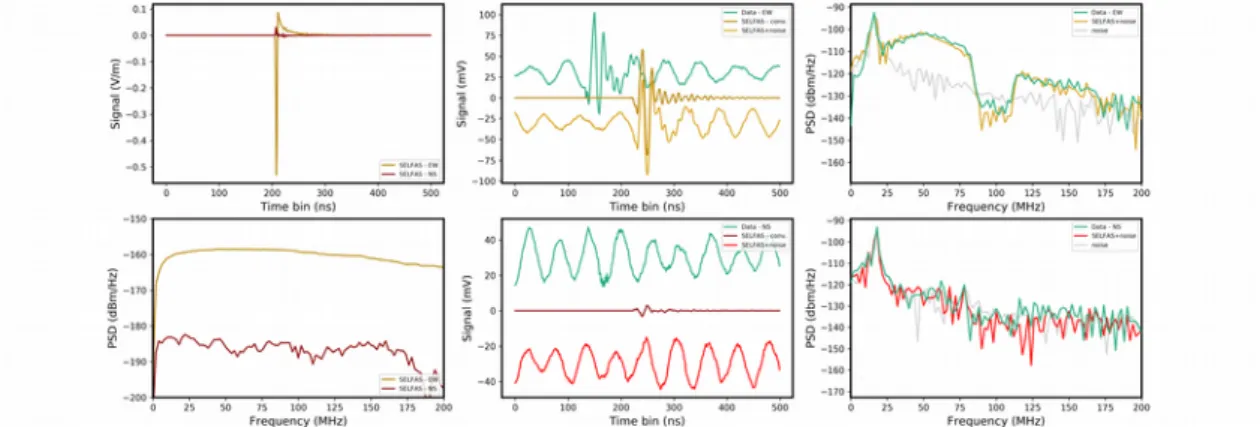
In order to do realistic comparisons, the full-band perfect radio-electric field must be convoluted with the full detection chain response and notably with the antenna response. This convolution is expressed in terms of a global transfer function which can be decomposed into the antenna transfer function, the analog chain transfer function and the digitizer transfer function allowing to convert a given three component electric field into digital values on specific ADC channels. The angular and frequency dependence of these transfer functions have been carefully measured using a network analyzer and calculated using the NEC antenna
Figure 4: Example of the convolution of SELFAS signals. Left: the EW (dark gold) and NS (dark red) transients and their power spectrum densities. Center: The convoluted waveforms (dark gold and dark red) with added noise (gold and red) are compared to real data (green). Right: the corresponding power spectrum density (gold and red) are compared to the experimental data (green).
PoS(ICRC2017)414
Cosmic ray measured by the CODALEMA experiment L.Martin
modeling code. An example of the convolution of SELFAS transients is illustrated in Figure 4. The very good agreement between the experimental data and the convoluted SELFAS transients is clearly obvious on the PSD.
5.2 Minimization procedure
The procedure used to deduce the cosmic-ray features from the simulations is inspired from the methodology developed in [8]. For each experimental event, the quadratic sum of the EW and NS amplitudes are calculated for all the real antenna in a given frequency band (typically 30-80 MHz or 30-200 MHz). For each simulation, a range of core locations and a range of multiplication factor (to cope for unknown energy) are tested. Convoluted amplitudes are calculated at the real antenna locations and a χ2 is built by summing up the square of the
amplitude differences. The best core location and best multiplication factor is determined from the smallest χ2. The results of the minimization for a particular event are illustrated on Figure 5
and Figure 6.
For each simulation, a core location, a multiplication factor and a χ2
min are determined. By
plotting the χ2
min versus the Xmax, the simulation best matching the experimental event is searched
for. The distribution usually exhibits a minimum more or less pronounced that can be interpreted as the most probable value of Xmax for the considered experimental event (Figure 6).
6
Figure 6: Left: χ2 map used to deduce the core location (here around x=-250m and y=30m) for a
simulation of the same experimental event (on the right of Figure 2) . Right: distribution of χ2
min versus
Xmax for the entire set of simulations.
Figure 5: Example of the SELFAS simulation producing the best match to the data (from the event on the right side of Figure 2). The SELFAS convoluted amplitudes are depicted as contour lines. Relative differences (in %) between the experimental data and the SELFAS values are shown as colored circles (left). Amplitudes are shown as a function of the distance to the core location (right) for experimental data (blue circles) and SELFAS simulation (red crosses).
PoS(ICRC2017)414
The overall features of the cosmic-ray are then accessible : the core location, the energy by combining the simulated energy and the multiplication factor, the Xmax and a particle
identification probability.
The minimum in the distribution of χ2
min versus Xmax is rather well formed for vertical
showers and becomes less evident for more horizontal showers. In some rare cases, no minimum emerges (besides abnormal and extreme Xmax values). In such cases, a detailed
inspection of the coincidence features usually reveals that the event is fortuitous or has very few chances to be a real EAS. Finally, a local minimum can eventually appears in the distribution which is associated to very different core location. Usually, in that case, polarization patterns exhibit very different variations and allow to select the correct core position (Figure 7). In addition, polarization pattern can be clearly a tool to distinguish between real cosmic ray events and parasitic noise events induced for instance by local static sources or aircrafts.
6. Comparison with the reconstruction in the particle detectors
The quality of the cosmic ray features deduced from the reconstruction combining the radio signals and the SELFAS simulations can be estimated by comparing them with the reconstructions in the scintillators. The energies deduced from the antennas Eradio are plotted
versus the energies derived from the scintillators Escint on the left panel of the Figure 8. The Escint
are systematically lower than the radio estimate Eradio. The surface covered by the autonomous
station array being much bigger than the surface covered by the scintillator array, most of the events fall outside the scintillator array and consequently their core location is not reliable and the energy estimate is underestimated (the reconstruction method trying to pull the core location inside the array limits). Using the core location provided by the radio signal reconstruction, the energy can be deduced again from the scintillators (Figure 8). The agreement is then clearly improved.
7. Conclusions
This preliminary analysis on a limited data set shows quite good agreements between the autonomous station signals compared to SELFAS simulations. First comparisons with the scintillator array are encouraging but still needs detailed work to improve the reconstruction in the particle detectors. These results suggest that the radio detection technique has the intrinsic
Figure 7: Polarization patterns represented for the experimental data (black lines) and for SELFAS predictions (red line) obtained for a core location close to the best match (left) and a core location producing a local minimal χ2 (right).The full virtual array is shown (orange dots).
PoS(ICRC2017)414
Cosmic ray measured by the CODALEMA experiment L.Martin
capabilities to infer the main properties of high energy cosmic rays. This ongoing work clearly needs improvement on several aspects : a larger set of data can be quickly processed, careful analysis of the various source of error must be done in order to determine the resolution for the core location, Xmax and energy values. Probabilities must be computed for a particle
identification estimate to study its variations over the energy range covered by CODALEMA. Extending this method to the low multiplicity and to the highly inclined events will increase the overall reconstruction efficiency and acceptance. A blind reconstruction can be undertaken to assess the cosmic ray detection efficiency and purity among the full set of recorded data. Finally, one can artificially lower the coincidence multiplicity (by ignoring some antennas) to estimate the resolution loss in a degraded mode which would be useful to anticipate the performances of a sparser antenna array.
References
[1] R.Dallier et al., ARENA 2016, Groningen, June 7-10, 2016. B.Revenu et al., this conference. S.Acounis et al., paper in preparation.
[2] A. Aab et al., Phys. Rev. D 93, 122005 (2016).
[3] P. Schellart et al., A&A, EDP Sciences, 2013, 560 (A98).
[4] R.Dallier et al., this conference. A.Lecacheux et al., this conference. A.Escudie et al., this conference.
[5] A.Belletoile et al., Astroparticle Physics, Elsevier, 2015, 69, pp.50-60 [6] V.Marin et al., Astroparticle Physics, Elsevier, 2012, 35, pp.733-741. [7] T. Pierog et al., Nucl. Phys. Proc. Suppl. 151-159 (2006).
[8] F.Gaté et al., ARENA 2016, Groningen, June 7-10, 2016.
8
Figure 8: CR energy deduced from the antennas versus the energy extracted from the scintillators (left). Energy deduced from the antennas versus the energy extracted from the scintillators with the core location taken from the radio signal analysis (right).