HAL Id: hal-00301691
https://hal.archives-ouvertes.fr/hal-00301691
Submitted on 28 Sep 2007
HAL is a multi-disciplinary open access
archive for the deposit and dissemination of
sci-entific research documents, whether they are
pub-lished or not. The documents may come from
teaching and research institutions in France or
abroad, or from public or private research centers.
L’archive ouverte pluridisciplinaire HAL, est
destinée au dépôt et à la diffusion de documents
scientifiques de niveau recherche, publiés ou non,
émanant des établissements d’enseignement et de
recherche français ou étrangers, des laboratoires
publics ou privés.
A statistical analysis of electric self-potential time series
associated to two 1993 earthquakes in Mexico
L. Flores-Márquez, J. Márquez-Cruz, A. Ramírez-Rojas, G. Gálvez-Coyt, F.
Angulo-Brown
To cite this version:
L. Flores-Márquez, J. Márquez-Cruz, A. Ramírez-Rojas, G. Gálvez-Coyt, F. Angulo-Brown. A
statisti-cal analysis of electric self-potential time series associated to two 1993 earthquakes in Mexico. Natural
Hazards and Earth System Science, Copernicus Publications on behalf of the European Geosciences
Union, 2007, 7 (5), pp.549-556. �hal-00301691�
www.nat-hazards-earth-syst-sci.net/7/549/2007/ © Author(s) 2007. This work is licensed under a Creative Commons License.
and Earth
System Sciences
A statistical analysis of electric self-potential time series associated
to two 1993 earthquakes in Mexico
L. Flores-M´arquez1,2, J. M´arquez-Cruz1, A. Ram´ırez-Rojas2, G. G´alvez-Coyt3, and F. Angulo-Brown4 1Instituto de Geof´ısica, UNAM, Circuito Exterior S/N, Cd. Universitaria, 04510 M´exico D.F., M´exico
2Area de F´ısica de Procesos Irreversibles, Universidad Aut´onoma Metropolitana Azcapotzalco, Avenida San Pablo 180´
Colonia Reynosa, Azcapotzalco, 02200, M´exico D.F., M´exico
3Departamento de Matem´aticas, Unidad Profesional Interdisciplinaria de Biotecnolog´ıa del Instituto Polit´ecnico Nacional,
Av. Acueducto S/N, Col. Barrio La Laguna Ticom´an, C.P. 07340, M´exico D.F., M´exico
4Departamento de Fisica, Escuela Superior de Fisica y Matem´aticas, Instituto Polit´ecnico Nacional, Edif. 9, U.P. Zacatenco,
07738, M´exico D.F., M´exico
Received: 16 July 2007 – Revised: 20 September 2007 – Accepted: 20 September 2007 – Published: 28 September 2007
Abstract. Recent studies related with earthquake prediction
involve statistical studies of the ground electric self-potential behavior. Published results about the complexity of this kind of processes encourage us to study the statistical behavior of the ground electric self-potential recorded in Guerrero state, Mexico. This region is characterized by high seismicity. The electric self-potential variations were recorded in the Aca-pulco station directly from the ground. The sampling period was four seconds and the data were stored from March to De-cember of 1993. Two significant earthquakes (EQs) occurred near this station, 15 May and 24 October whose magnitudes were Mw=6.0 and Mw=6.6 respectively. A preliminary pro-cessing was carried out consisting of a moving average of the original time series in order to filter the very high frequencies and to complete short lacks of data and outliers. Then, a vi-sual inspection of the complete filtered signal was performed to search some seismic electric signals (SES), which were ambiguously depicted. Subsequently, a detrending of µ=0 was applied with the windows of 3.3, 6.6 and 10 h. Later, the analysis of the spectral exponent β was made, showing changes during the total period examined, and the most evi-dent changes occurred during the preparation mechanism of the Mw=6.6 EQ. Fifteen days before the 24 October EQ, a Brownian-noise like behavior was displayed (β≈2), having a duration of about two days. In addition a Higuchi fractal method and wavelet analysis were made confirming the pres-ence of the β-anomaly.
Correspondence to: L. Flores-M´arquez ([email protected])
1 Introduction
Observations of changes in the electromagnetic field before earthquake (EQ) occurrences have been proposed as one of the possible methods in earthquake prediction (e.g. Honkura, et al., 1981, 2002; Varotsos and Alexopolous, 1984a, b; Varotsos and Sarlis, 2002, and references therein). However, observational evidence with a clear physical mechanism has not been defined, although some possible mechanisms have been proposed to account for ambiguous observational re-sults (Honkura et al., 2002). The electrokinetic effect (Mizu-tani et al., 1976; Ishido and Mizu(Mizu-tani, 1981; Gershenzon et al., 1993; Haartsen and Pride, 1997), the piezoelectric effect (Gershenzon et al., 1993), the piezomagnetic effect (Stacey and Johnston, 1972; Sasai, 1980), and the electromagnetic induction effect (Gershenzon et al., 1993; Iyemori et al., 1996; Honkura et al., 2000; Matsushima et al., 2002), have been considered as possible processes to explain those obser-vations.
Recent examples of clear electric field changes indicate that the arrival of electric signals to registering stations are sometimes synchronized with the arrival of seismic waves (Yamada and Murakami, 1982; Mogi et al., 2000; Nagao et al., 2000); others arrived before the EQ events (Varotsos and Alexopolous, 1984a, b; Varotsos et al., 1988, Ramirez-Rojas et al., 2004a, b), but a possibility also exists that the magnetic field shows changes and, moreover, it started before the ar-rival of seismic waves (Iyemori et al., 1996; Nikolopoulos et al., 2004). Then, the study of electromagnetic field changes is extremely valuable in searching for precursor signs associ-ated with EQs. The seismic electric signals (SES) were intro-duced by Varotsos and Alexopoulos (1984a, b). The named
550 L. Flores-M´arquez et al.: Statistical analysis of electric self-potential time series
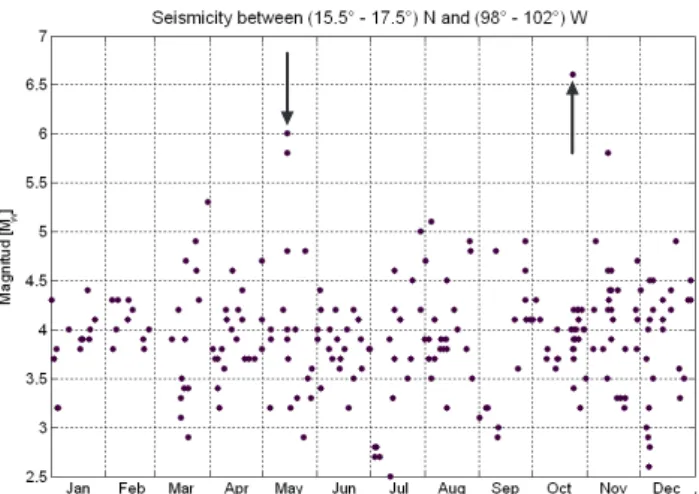
Fig. 1. Plot of EQs occurred in the studied region, whose distance between epicenter and the monitoring station (ACA) is between 100 and 200 km and their magnitude Mw>2.5. The two studied EQs were marked with arrows.
VAN group (acronym of Varotsos, Alexopoulos and Nomi-cos) proposed the methodology to register the SES, and sug-gested it as a method for searching for seismic precursors. In 2002, Varotsos and Sarlis published a review of the efforts on understanding the SES generation, their properties and how to interpret them. The VAN group proposed that the natu-ral electric self-potential (NESP) must be normalized by the distance between electrodes.
Some overall characteristics of electric and magnetic field changes were already shown (Honkura et al., 2000; Mat-sushima et al., 2002), and the attention has been focused on statistical processes of these changes to look for new find-ings.
Novel papers involving fractal methods have been ap-plied to electromagnetic field changes in order to provide some possible EQ precursory signature from scaling prop-erties. Some reports including the magnetic field data, are Hayakawa et al. (1999, 2000); Smirnova et al. (2001); Telesca et al. (2001); Gotoh et al. (2003), Ida et al. (2005); Ida and Hayakawa (2006) and for the electric signals, Ramirez-Rojas et al. (2004a, b); Varotsos et al. (2002, 2003a); Kapiris et al. (2003, 2004).
It has been found that the power spectrum of electric Ul-tra Low Frequencies (ULF) emissions, on average, exhibits a power-law behavior of the type S(f )αf−β, which is a fin-gerprint of typical fractal (self-affine) time series. In most of the cases, the spectral exponent β displays a tendency to decrease gradually when approaching the EQ date (Ramirez-Rojas et al., 2004b). Such a tendency shows a gradual evo-lution of the structure of the ULF noise towards a typical flicker noise structure (1/f noise-like) in the proximity of a large EQ. This behavior has been suggested as an EQ precur-sor signature (Hayakawa et al., 1999; Smirnova et al., 2001; Ramirez-Rojas et al., 2004a, b).
Ramirez-Rojas et al. (2004) made a spectral and multi-fractal analysis of NESP registered at the Acapulco station associated to the Mw=6.6 EQ, on 24 October 1993. They reported that the spectral and multifractal studies were made over the original NESP, just on the N-S time series, with-out any preliminary processing. However, they found an an-ticorrelation between the spectral exponent β and the mul-tifractal spectrum width. They also reported studies made by means of detrended fluctuation analysis (DFA) and mul-tifractal analysis, obtaining some additional properties of the NESP.
In this work we present a statistical study of self-potential electric time series monitored in 1993 at the Acapulco sta-tion (16.54◦N, 98.98◦W), introducing now a pre-processing of the data. Firstly, the higher frequencies were removed from the original time series by a moving average algorithm, and then a detrending procedure was applied. We show that the time series display a trend of SES probably associated to an EQ. Also, by using the spectral method, we carried out a statistical study of the spectral exponent β, from the pre-processed series, probably associated to the mechanism of EQ preparation. Finally, the statistical study of the NESP was complemented by means of a fractal analysis (Higuchi’s method) applied to the original preprocessed data and to the series transformed by means of wavelets.
2 Seismological and NESP data
Particularly, the western and southwestern coast of Mexico has had an important number of EQs per year due to the tectonic processes associated to the tectonic plates conflu-ence; the subduction zone along the Southwest coast and the Middle American Trench are the main triggerers of these EQs. The National Seismological Service (SSN, Servi-cio Sismol´ogico NaServi-cional dependent of the National Au-tonomous University of Mexico, UNAM), is in charge of monitoring the seismic and volcanic risk, and of producing the records of these events and also the reports of the specific parameters (magnitude, epicenter and depth). According to the SSN 1993 seismic catalogues, there were registered 238 events with Mw>2, within the Guerrero coast, between 15.5◦ and 17.5◦latitude N and between 98◦and 102◦longitude W. A selection of EQ events was done taken into account their magnitudes and the distance between the epicenter and the monitoring station (see Table1). Particularly, we are inter-ested in the events occurred on 15 May and 24 October be-cause the distance between the epicenter and the monitor-ing station is around 100 km and their magnitude Mw>5.5 (Fig. 1).
Electric self-potential data consist of the observation of the electric potential differences, 1V , between two electrodes buried 2 m of deep into the ground and separated by 50 m in distance. A couple of electrodes was oriented in the North-South direction (NS series) and other couple in the
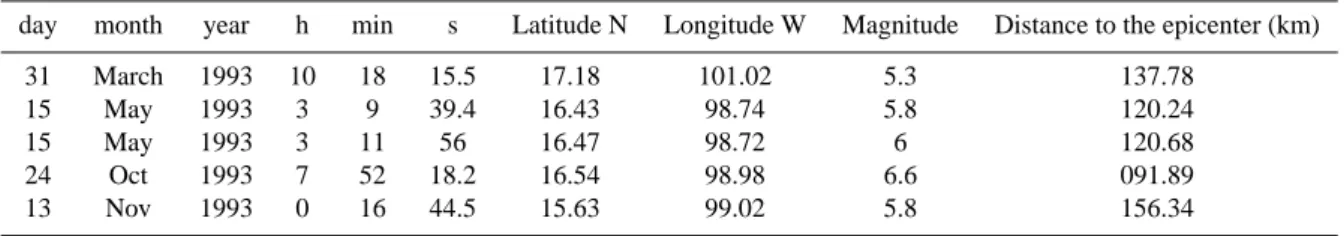
Table 1. Guerrero coast EQs whose distance to the monitoring station is around 100 km and Mw>5.
day month year h min s Latitude N Longitude W Magnitude Distance to the epicenter (km)
31 March 1993 10 18 15.5 17.18 101.02 5.3 137.78
15 May 1993 3 9 39.4 16.43 98.74 5.8 120.24
15 May 1993 3 11 56 16.47 98.72 6 120.68
24 Oct 1993 7 52 18.2 16.54 98.98 6.6 091.89
13 Nov 1993 0 16 44.5 15.63 99.02 5.8 156.34
Fig. 2. The total data recorded in 1993, some lacks of data and outliers can be observed.
West direction (EW series), following the VAN methodol-ogy (Varotsos and Alexopodus, 1984a, b; Varotsos et al., 1988). The survey project consisted of six monitoring sta-tions in charge of the Instituto Politecnico Nacional (IPN), from 1992 to 1996 (for details, see Yepez et al., 1995).
3 Data processing
The data considered in this study were obtained at the Aca-pulco station during the year 1993. The time series were recorded in both directions, with two different sampling rates, 1t=4 s and 1t=2 s, in different time intervals. The to-tal data recorded along the year are depicted in Fig. 2. Some problems in collecting the data inherent to the storage pro-cess can be observed, as some lacks of data and outliers, among others. The data were filtered by using a moving average each two minutes, so that more homogeneous data were obtained to minimize these problems (see Fig. 3). The higher frequencies were removed and small lacks were filled. Also, the elimination of outliers was done to have the same reference level.
An attempt was done to search SES, by a simple visual in-spection of Fig. 3, following the method proposed by VAN group. Varotsos and Lazaridou (1991) defined SES as a
fluc-Fig. 3. Pre-processed NS and EW series; filtered data by using moving average each two minutes are showed; the outliers were also removed.
tuation of the NESP in the ground having the following prop-erties: 1) Duration between 1/2 min and several hours; 2) the time lag for isolated events lies between 7 h and 11 days, and no longer than 22 days from the EQ date; 3) it may have a gradual and abrupt onset and/or cessation and 4) Large and small-scale properties of the earth’s crust play an impor-tant role in SES. Finally, the relation between SES amplitude (1V /L) and the EQ magnitude could be solely obtained in cases with several monitoring stations within 100 km of dis-tance of the EQ epicenter (Varotsos and Alexopoulos, 2006). The visual inspection of Fig. 3 shows some fluctuations of the electric self-potential along the year as well as some differences in these fluctuations that could be associated to EQ occurrences. Nevertheless the well-defined properties of SES, their detection depends of visual inspection, this is not adequate to decide which fluctuation really corresponds to a SES related to a future EQ, except perhaps for the biggest ones. Depending on the criterion adopted to select the SES, we can find a significant number of SES or none. Figure 4 shows a two days segment of the self-potential signal, that shows some fluctuations that could be identified as a SES, but we can not identify which of them are related with an EQ. Then we search for a systematic statistical alternative to characterize the electric self-potential signal.
552 L. Flores-M´arquez et al.: Statistical analysis of electric self-potential time series
Fig. 4. An example of a trend of possible SES is depicted in a window of six hours.
The standard spectral analysis has been applied for a statis-tical study of signals to characterize them in the ULF range. This considers that the power spectrum behaves as a power law: S(f ) ∝ 1
fβ. The spectral exponent β is estimated by
the slope of the best-fit straight line to ln S(f ) vs. ln(f ) and, according to Malamud and Turcotte (2001), β characterizes the temporal fluctuations of the time series. For example, a white noise-type has β=0, for a flicker noise or f1 noise, β=1, and for a Brownian motion β=2. Some applications of this methodology have been previously used in time se-ries analysis with encouraging results (Ramirez-Rojas et al., 2004a, b; Telesca et al., 2001).
Two approaches were followed to estimate the spectral ex-ponent β of our time series. Because of the size of the prob-able SES (Fig. 4) in the electric self-potential, three different windows were selected, corresponding to 3.3, 6.6 and 10 h, respectively. As a first approach, the β exponent was es-timated from a simple plot of ln(S) vs. ln(f ) of 1V -time series. In a second approach, the NESP has been normal-ized by the distance between electrodes obtaining (1V /L), following the normalization proposed by VAN group. Then, a detrending of µ=0 was applied in the selected windows. Finally, the spectral exponent β was computed over the de-trended signal. In the search of more consistent method-ologies for the analysis of possible SES, we also employed the calculation of the so called Higuchi’s fractal dimen-sion (Higuchi, 1988, 1990) of the NESP-time series an their wavelet transforms (Goswani and Chan, 1999; Resnikoff and Wells, 1998).
4 Results and discussion
The power spectrum S(f ) was calculated for the selected windows, and then the corresponding β exponent was esti-mated. We found that S(f ) shows two patterns, one
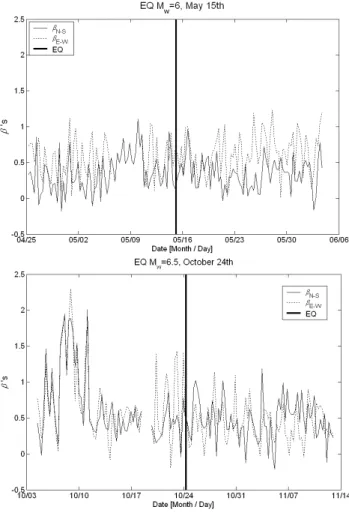
cor-Fig. 5. β exponent evolution computed from 20 days before until 20 days after of EQs occurred: (a) 15 May and (b) 24 October EQ. The EQs are marked with vertical lines.
responding to low frequencies (0.0001<f <0.004 Hz), and other for high frequencies f >0.004 Hz). Generally, very high frequencies are related to white noise behavior and β≈0 for frequencies higher than 0.004 Hz.
We can observe an evolution along the year in the value of the β exponent (0.5≤β≤1) that indicates a change in the behavior of the system showing correlations.
Now, we focused our attention on the periods before and after the occurrence of the selected EQs. Figure 5a shows the evolution of the β exponent 20 days after and 20 days before the EQ occurred on 15 May. Figure 5b depicts the evolution of the β exponent for the same interval for the 24 October EQ. We can observe the values of the β exponent between 0 and 1 in most of the cases, however fifteen days before the 24 October EQ we clearly observe an increase in the β exponent value, that rise up to β=2, this means a β exponent usually identified with a Brownian motion. Thus, the system has changed its behavior and has a different kind of organization.
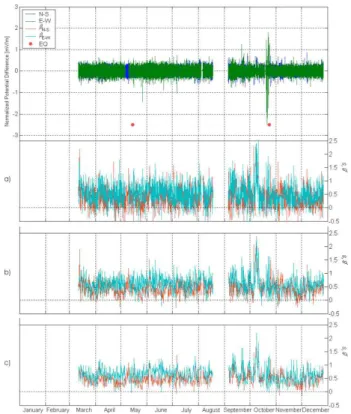
Fig. 6. The electric field (1V /L) vs. time. Detrended signal with six hours windows with µ=0; no remarkable features are evident. Vertical lines mark the dates of the two EQs. The lack of data in the series were filled by means of white noise (gray line).
Figure 6 shows the results of the second approach to pro-cess the NESP signals after being normalized (1V /L), and detrended (µ=0). The lacks of data were filled with white noise. It is possible to observe that no characteristic features are evident. However, it is possible to observe the variation of the computed β values along the year 1993 from March to December as depicted in Fig. 7a (for a 3.3 h window), es-pecially for the 24 October EQ, that rise up to 2, just fif-teen days before the EQ occurrence. This event could mean an organization of the system prior to the EQ or during the EQ preparation, coincident with the trend of SES depicted in Fig. 4.
We performed the same process for windows of 6.6 and 10 h, in order to determine if the size of the window influ-ences the computed values of β. The results are shown in Figs. 7b and c, where we see that the increase up to β=2 is also present fifteen days before the EQ occurrence for the two cases.
However, a complementary analysis is necessary to con-firm the possible presence of the SES anomaly observed in the β exponent behavior. We also calculated the fractal di-mension of the pre-processed NESP-time series by means of the Higuchi’s algorithm (1988, 1990). This method consisted in the calculation of the fractal dimension of the time series. This is done in terms of the straight-line slope that fits the length of the curve and the time interval (the k lag) in a dou-ble log plot. The length of the curve is calculated for several k time lags. If the average length <L(k)> depends on k as a power law, <L(k)>∝k−D, then D is its fractal dimension. Figures 8a (NS series) and 8b (EW series) depict the time evolution of D for the time series displayed in Fig. 6. At a first glance, there is not an evident SES where the β anomaly is located. However, if we calculate the cross-correlation be-tween both series, we find that all the D-points are weakly
Fig. 7. β exponent computed from March to December of 1993, after the treatment of the second approach. (a) window of 3.3 h, (b) window of 6.6 h and (c) window of 10 h. β values rise up to 2, fifteen days before the occurrence of the 24 October EQ in all cases.
Mar Apr May Jun Jul Aug Sep Oct Nov Dec
1.5 2.0
Jun Jul Aug Sep Nov Dec
1.5 2.0
Mar Apr May Oct
NS-channel
EW-channel (a)
(b)
Fig. 8. Computation of fractal dimension by Higuchi’s method. Evolution of D exponent computed from March to December of 1993, after the second approach of series (data lacks filled by white
noise, Fig. 6). (a) Higuchi exponent D for the NS series, (b)
Higuchi exponent D for the EW series. The occurrences of 15 May and 24 October EQs are also showed (vertical lines).
554 L. Flores-M´arquez et al.: Statistical analysis of electric self-potential time series 1.3 1.4 1.5 1.6 1.7 1.8 1.9 2 2.1 2.2 1.3 1.4 (a) 1.5 1.6 1.7 1.8 1.9 2 2.1 2.2 NS EW y = 0.8392x + 0.2811 R2 = 0.8022 1.4 1.5 1.6 1.7 1.8 1.9 2.0 2.1 1.3 1.4 1.5 1.6 1.7 1.8 1.9 2.0 2.1 2.2 EW NS (b)
Fig. 9. (a) The scatter plot between NS vs. EW Higuchi exponent along the year. (b) The scatter plot between the same signals but just for data corresponding to the β anomaly.
correlated (see Fig. 9a). Nevertheless, if we calculate the cross-correlation only for the points pertaining to the subset of the β anomaly, we find a cross-correlation with R2=0.80 (see Fig. 9b), which is, a reasonable high correlation between both signals. This suggests that during the SES time interval, an electromagnetic perturbation coming from a far source si-multaneously affects both signals. We have employed an ad-ditional approach for the SES analysis as follows: first, we obtain the wavelet transform of the pre-processed NESP-time series by using a Haar window at second level (Goswani and Chan, 1999; Resnikoff and Wells, 1998). Second, we applied again the Higuchi’s algorithm over the wavelet transformed series to calculate the fractal dimension D. The result of this procedure was completely similar to the previous one. It means that only the points corresponding to the SES have a significant cross-correlation for both NS and EW signals (see
Fig. 9). When we applied Higuchi’s method and wavelets transform over the surrogated NESP-data, we only find un-correlated data.
5 Concluding remarks
In general geophysical phenomena are very complex, es-pecially those underlying EQs. During the last years, the analysis of geophysical time series has been made mainly by methods involving statistical physics and non-linear dy-namics. Pre-processing techniques are convenient when the time series are very noisy with many undesirable influences present. In the present investigation we reported some statis-tical studies of self-potential time series possibly associated to EQ’s in the south-western Mexican coast (Yepez et al., 1995, Ramirez-Rojas et al., 2004a, b) with preliminary data processing. We have analyzed some electric time series pre-viously cleaned by means of a moving average algorithm and a detrending procedure, and no unambiguously SES signals were observed. However, the analysis of the spectral expo-nent β shows changes along the total period examined, and the most evident occurred during the preparation mechanism some days before of the occurrence of the 24 October EQ.
For the studied EQs during the year 1993 the results can be summarized as follows: It was not possible to distinguish a clear change in the behavior of the β exponent for the EQs corresponding to magnitudes Mw<6 (see Table 1) and epi-centers situated more than 100 km away from the monitoring station. In Fig. 7 some peaks with β≥1 are depicted that could be associated with EQs with magnitudes between 4.5 and 5.5. The 24 October EQ had a magnitude of Mw=6.6 and its epicenter was located 92 km away from the monitor-ing station. Before this EQ, we observed a trend of possible SES (Fig. 4), as well as an organization of the self-potential electric field, showing a correlation. The β exponent is on average 0.5, which is correlated with stationary data with weak persistence during the total monitoring time (Malamud and Turcotte, 2001). Fifteen days before the EQ, a behavior like a Brownian motion is displayed (β≈2), having a dura-tion around two days. In search of a more complete study of the possible β-anomaly fifteen days before the Mw=6.6 EQ, we also analyzed the whole 1993 data by means of both the Higuchi’s fractal dimension and the wavelet transform. In both cases we found that for the points corresponding to the possible β-anomaly in both series the cross-correlation (Koening, 1991) reached significant values (R2≈0.8), while for the rest of the time series the data remained weakly cor-related. This can suggest that during the SES time interval a distant electromagnetic perturbation arrived to both NS and EW lines. In summary, the present work shows some time series features possibly linked to EQ preparation processes, but with not enough clearness to assure that these features are seismic precursors.
Acknowledgements. Authors are indebted to the National
Seismo-logical Service (SSN, Servicio Sismol´ogico Nacional) dependent of National Autonomous University of Mexico (UNAM) for provided the 1993 EQ data. L. Flores-M. thanks the Universidad Autonoma Metropolitana for the sabbatical financial support. FAB and GGC thanks to COFAA and EDI-IPN for partial financial support. Edited by: P. F. Biagi
Reviewed by: two anonymous referees
References
Gershenzon, N. I., Gokhberg, M. B., and Yunga, S. L.: On the elec-tromagnetic field of an earthquake focus, Phys. Earth Planet. In-ter., 77, 13–19, 1993.
Gotoh, K., Hayakawa, M., and Smirnova, N.: Fractal analysis of the ULF geomagnetic data obtained at Izu Peninsula, Japan in relation to the nearby earthquake swarm of June–August 2000, Nat. Hazards Earth. Syst. Sci., 3, 229–236, 2003.
Goswani, J. C. and Chan, A. K., Fundamentals of wavelets: theory, algorithms, and applications, John Wiley, USA, 306 pp., 1999. Haartsen, M. W. and Pride, S. R.: Electroseismic waves from point
sources in layered media, J. Geophys. Res., 102, 24 745–24 769, 1997.
Hayakawa, M., Ito, T., and Smirnova, N.: Fractal analysis of ULF geomagnetic data associated with the Guam earthquake on 8 Au-gust 1993, Geophys Res. Lett., 26, 2797–2800, 1999.
Hayakawa, M. and Ito, T.: ULF electromagnetic precursors for an earthquake at Biak, Indonesia on 17 February 1996, Geophys Res. Lett., 27, 1531–1534, 2000.
Higuchi, T.: Approach to an irregular time series on basis of the fractal theory, Physica D., 31, 277–283, 1988.
Higuchi, T.: Relationship between the fractal dimension and the power law index for a time series: a numerical investigation, Physica D., 46, 254–264, 1990.
Honkura, Y.: Electric and magnetic approach to earthquake pre-diction, in: Current Research in Earthquake Prediction I, edited by: Rikitake, T., Center Academic Publications Japan, D. Reidel Publishing Company, 301–383, 1981.
Honkura, Y., Isikara, A. M., Oshiman, N., Ito, A., ¨Uc¸er, B., Baris, S., Tunc¸er, M. K., Matsushima, M., Pektas, R., C¸ elik, C., Tank, S. B., Takahashi, F., Nakanishi, M., Yoshimura, R., Ikeda, Y., and Komut, T.: Preliminary results of multidisciplinary observations before, during and after the Kocaeli (Izmit) earthquake in the western part of the North Anatolian Fault Zone, Earth Planets Space, 52, 293–298, 2000.
Honkura Y., Matsushima, M., Oshiman, N., Tunc¸er, M. K., Baris, S., Ito, A., Lio, Y., and Isikara, A. M.: Small electric and mag-netic signals observed before the arrival of seismic wave, Earth Planets Space, E-Letter, 54, e9–e12, 2002.
Ishido, T. and Mizutani, H.: Experimental and theoretical basis of electrokinetic phenomena in rock-water systems and its applica-tion to geophysics, J. Geophys. Res., 86, 1763–1775, 1981. Iyemori, T., Kamei, T., Tanaka, Y., Takeda, M., Hashimoto, T.,
Araki, T., Okamoto, T., Watanabe, K., Sumitomo, N., and Os-himan, N.: Co-seismic geomagnetic variations observed at the 1995 Hyogoken-nanbu earthquake, J. Geomag. Geoelectr., 48, 1059–1070, 1996.
Kapiris, P. G., Eftaxias, K. A., and Nomikos, K.: Evolving towards a critical point: A possible electromagnetic way in which the critical regime is reached as the rupture approaches, Nonlin. Pro-cesses Geophys., 10, 511–524, 2003,
http://www.nonlin-processes-geophys.net/10/511/2003/. Kapiris, P. G., Eftaxias, K. A., and Chelidze, T. L.: Electromagnetic
signature of prefracture critically in heterogeneous media, Phys. Rev. Lett., 92, 065702, doi:10.1103/PhysRevLett.92.065702, 2004.
Koening, D. M.: Control and Analysis of noisy processes, Engle-wood Cliffs, New Jersey, p. 12, 1991.
Malamud, B. D. and Turcotte D. L.: Self-Affine Time Series: I Gen-eration and Analyses, Sixth Workshop on Non-Linear Dynamics and Earthquake Prediction, H4.SMR/1330-22, 2001.
Matsushima, M., Honkura, Y., Oshiman, N., Baris, S., Tunc¸er, M. K., Tank, S. B., C¸ elik, C., Takahashi, F., Nakanishi, M., Yoshimura, R., Pektas, R., Komut, T., Tolak, E., Ito, A., Iio, Y., and Isikara, A. M.: Seimo-elecromagnetic effect associated with the Izmit earthquake and its aftershocks, Bull. Seismol. Soc. Am., 92, 350–360, 2002.
Mizutani, H., Ishido, T., Yokokura, T., and Ohnishi, S.: Electroki-netic phenomena associated with earthquakes, Geophys. Res. Lett., 3, 365–368, 1976.
Mogi, T., Tanaka, Y., Widarto, D. S., Arsadi, E. M., Puspito, N. T., Nagao, T., Kanda, W., and Uyeda, S.: Geoelectric potential dif-ference monitoring in southern Sumatra, Indonesia – Co-seismic change, Earth Planets Space, 52, 245–252, 2000.
Nagao, T., Orihara, Y., Yamaguchi, T., Takahashi, I., Hattori, K., Noda, Y., Sayanagi, K., and Uyeda, S.: Co-seismic geoelectric potential changes observed in Japan, Geophys. Res. Lett., 27, 1535–1538, 2000.
Nikolopoulos, S., Kapiris, P., Karamanos, K., and Eftaxias, K.: A unified approach of catastrophic events, Nat. Hazards Earth Syst. Sci., 4, 615–631, 2004,
http://www.nat-hazards-earth-syst-sci.net/4/615/2004/.
Ram´ırez-Rojas, A., Pav´ıa-Miller, C. G., and Angulo-Brown, F.: Sta-tistical behavior of the spectral exponent and the correlation time of electric self-potential time series associated to the Ms=7.4 September 14, 1995 earthquake in Mexico, Phys. Chem. Earth, 29, 4–9, 305–312, 2004a.
Ram´ırez-Rojas, A., Mu˜noz-Diosdado A. Pav´ıa-Miller, C. G., and Angulo-Brown, F.: Spectral and multifractal study of electro-seismic time series associated to the Mw=6.5 earthquake of 24 October 1993 in Mexico, Nat. Hazards Earth Syst. Sci., 4, 703– 709, 2004b.
Resnikoff, H. L. and Wells, R. O.: Wavelet Analysis the escal-able structure of information, Springer-Verlag, New York, USA, 435 pp., 1998.
Sasai, Y.: Application of the elasticity theory of dislocation to tectonomagnetic modeling, Bull. Earthq. Res. Inst., 55, 387–447, 1980.
Smirnova, N., Hayakawa, M., Gotoh, K., and Volobuev, D.: Scal-ing characteristics of ULF geomagnetic field at the GUAM seis-moactive area and their dymanics in relation to the eathquake, Nat. Hazards Earth Syst. Sci., 1, 119–126, 2001,
http://www.nat-hazards-earth-syst-sci.net/1/119/2001/.
Stacey, F. D. and Johnston, M. J. S.: Theory of the piezo-magnetic effect in titanomagentite-bearing rocks, Pure Appl. Geophys., 97, 146–155, 1972.
556 L. Flores-M´arquez et al.: Statistical analysis of electric self-potential time series
Telesca, L., Cuomo, V., Lapenna, V., and Macchiato, M.: A new ap-proach to investigate the correlation between geoelectrical time fluctuations and earthquakes in a seismic area of southern Italy, Geophys. Res. Lett., 28, 4375–4378, 2001.
Varotsos, P. and Alexopoulos, K.: Physical properties of the varia-tions of the electric field of the Earth preceding earthquakes, I. Tectonophysics (110), Elsevier Science Publishers, 1984a. Varotsos, P. and Alexopoulos, K.: Physical properties of the
varia-tions of the electric field of the Earth preceding earthquakes, II. Tectonophysics (110), Elsevier Science Publishers, 1984b. Varotsos, P. and Lazaridou, M. Latest aspects of the earthquake
prediction in Greece base don seismicelectric signals, Tectono-physics, 188, 321–347, 1991.
Varotsos, P. and Sarlis, M.: A review of the recent VAN efforts: the explanation of the SES physical properties, in: Seismo
Elec-tromagnetics: Lithosphere-Atmosphere-Ionosphere Coupling,
edited by: Hayakawa, M. and Mochanov, O. A., Terrapub Pub. Tokio, 131–140, 2002.
Varotsos, P., Sarlis, N., Skordas, E., and Lazaridou, M.: Additional evidence on some relationship between Seismic Electric Signals (SES) and earthquake focal mechanism, Tectonophysics, Else-vier Science Publishers, 412, 279–288, 2006.
Yamada, I. and H. Murakami, Self-potential variations associated with quarry blasts, Zisin, 35, 393–400, 1982 (in Japanese with English abstract).
Y´epez, E., Angulo-Brown, F., Peralta, J. A., Pav´ıa-Miller, C. G., and Gonz´alez-Santos, G.: Electric fields patterns as seismic pre-cursors, Geophys. Res. Lett. 22, 3087–3090. 1995.