HAL Id: insu-01289695
https://hal-insu.archives-ouvertes.fr/insu-01289695
Submitted on 17 Mar 2016
HAL is a multi-disciplinary open access
archive for the deposit and dissemination of
sci-entific research documents, whether they are
pub-lished or not. The documents may come from
teaching and research institutions in France or
abroad, or from public or private research centers.
L’archive ouverte pluridisciplinaire HAL, est
destinée au dépôt et à la diffusion de documents
scientifiques de niveau recherche, publiés ou non,
émanant des établissements d’enseignement et de
recherche français ou étrangers, des laboratoires
publics ou privés.
Distributed under a Creative Commons Attribution - NonCommercial - NoDerivatives| 4.0
International License
Ore Fragmentation Modelling for the Evaluation of the
Liberation Mesh Size
Olivier Rozenbaum, Julie Machault, Emmanuel Le Trong, Yvan George
Ngassa Tankeu, Luc Barbanson
To cite this version:
Olivier Rozenbaum, Julie Machault, Emmanuel Le Trong, Yvan George Ngassa Tankeu, Luc
Bar-banson. Ore Fragmentation Modelling for the Evaluation of the Liberation Mesh Size. 13th SGA
Biennal Meeting, The Society for Geology Applied to Mineral Deposits, Aug 2015, Nancy, France.
pp.1447-1450. �insu-01289695�
The textural context of the mineral results also needs to be taken into consideration when attempting to define geometallurgical domains. The depth registered high resolution imagery acquired by both systems, permits the spectro-mineralogical results to be viewed with the drill core imagery. Information on the distribution of the mineralogy can therefore be observed and context provided answering questions such as - is the tourmaline in the matrix, veins or clasts? The HyLogger-3 imagery can be viewed in TSG-Core with the mineral results loaded as logs adjacent or below the core imagery. The imaging nature of the HCI-3 spectrometer enables the mineral results to be essentially viewed in situ, overlain on the core imagery where the inter-relationships between the mineral results can be observed. Algorithms to automate the extraction of textural information from the drill core imagery are a desired improvement and are currently being investigated by the developers of both the HyLogger-3 and HCI-3.
7 Conclusion
This preliminary review of Corescan’s HCI-3 and the CSIRO-developed HyLogger-3 has demonstrated the application and utility of both automated hyperspectral core logging systems applied to mineral identification and domain characterisation for the development of appropriate geometallurgical flow design.
Minerals identified from the SWIR data collected by both core logging systems and confirmed by XRD analysis include: muscovite (sericite), tourmaline, gypsum, chlorite, phlogopite/biotite and trace kaolinite and montmorillonite. Quartz and feldspar were also logged by the HyLogger-3 TIR data.
Domains were characterised based on the spatial distribution and intensity of one or more key minerals. Within-domain variations were also logged that may prove useful for further domain subdivision or boundary revision.
Three main differences between the automated hyperspectral core logging systems are:
1) Wavelength range. In addition to the VNIR-SWIR spectral range common to both systems, the HyLogger-3 also has a thermal-infrared (TIR) capability necessary for logging anhydrous minerals (e.g. feldspars, quartz) and thus provides a more comprehensive suite of drill core mineralogy.
2) The ‘imaging’ nature of the HCI-3 spectrometer enables the VNIR-SWIR mineral results to be viewed in situ overlain on the drill core imagery where inter-relationships between various minerals can be observed. 3) Data delivery. HCI-3 drill core data is retained by Corescan and interpreted results made available via a secure online web delivery service. HyLogger-3 data (spectra and drill core imagery) is owned and retained by
the client for in-house or consultant-based analysis and interpretation within the commercially available TSG-Core software.
The spectro-mineralogical results are generated in preparation for more detailed studies on predictive comminution and geometallurgical modelling using automated hyperspectral core logging.
Acknowledgements
The authors would like to thank the staff at Anglo American Chile particularly Marcelo Rocha, Claudiav Castillot and the Geometallurgy department at the Los Bronces mine. Also Lew Whitbourn and Peter Mason from CSIRO; Andy Green from OTBC Pty Ltd; Kathryn Conroy, Ronell Carey and Neil Goodey from Corescan Pty Limited; Suraj Gopalakrishnan from the Queensland Geological Survey and Malcolm Powell and Cathy Evans from JKMRC, Sustainable Minerals Institute at The University of Queensland.
References
Deckart K, Clark AH, Celso AA, Ricardo VR, Bertens AN, Mortensen JK, Fanning M (2005) Magmatic and Hydrothermal Chronology of the Giant Río Blanco Porphyry Copper Deposit, Central Chile: Implications of an Integrated U-Pb and 40Ar/39Ar Database. Econ Geol 100:905-934
Frikken PH, Cooke DR, Walshe JL, Archibald D, Skarmeta J, Serrano L, Vargas R (2005) Mineralogical and Isotopic Zonation in the Sur-Sur Tourmaline Breccia, Rio Blanco-Los Bronces Cu-Mo Deposit, Chile: Implications for Ore Genesis. Econ Geol 100:935-961
Hollings P, Cooke D, Clark A (2005) Regional Geochemistry of Tertiary Igneous Rocks in Central Chile: Implications for the Geodynamic Environment of Giant Porphyry Copper and Epithermal Gold Mineralization. Econ Geol 100:887-904 Quigley M, Huntington JF, Whitbourn LB, Munday T, Yang K,
Schodlok MC (2009) HyLogging: Emerging core logging technologies heading to operational uptake, Annual General Meeting of the Geological Remote Sensing Group (GRSG) Conference - Exploration Remote Sensing: London, UK, p37 Serrano L, Vargas R, Stambuk V, Aguilar C, Galeb M, Holmgren
C, Contreras A, Godoy S, Vela I, Skewes AM, Stern CR (1996) The late Miocene to early Pliocene Río Blanco-Los Bronces copper deposit, central Chilean Andes. Society of Economic Geologists Special Publication 5:119-130
Vargas R, Gustafson L, Vukasovic M, Tidy E, Skewes MA (1999) Ore breccias in the Rio Blanco- Los Bronces porphyry copper deposit, Chile. In: Geology and Ore Deposits of the Central Andes, Skinner BJ (ed) Society of Economic Geologist Special Publication 7: 281-297
Vergara M, Charrier R, Munizaga F, Rivano S, Sepulveda P, Thiele R, Drake R (1988) Miocene volcanism in the central Chilean Andes (31º30’S-34º35’S). Journal of South American Earth Sciences 1:199-209
Warnaars FW, Holmgren DC, Barassi FS (1985) Porphyry copper and tourmaline breccias at Los Bronces-Rio Blanco, Chile. Econ Geol 80:1544-1565
Ore Fragmentation Modelling for the Evaluation of the
Liberation Mesh Size
Olivier Rozenbaum, Julie Machault, Emmanuel Le Trong, Yvan George Ngassa Tankeu, Luc Barbanson
Institut des Sciences de la Terre d’Orléans (ISTO), Université d’Orléans/CNRS-INSU/BRGM, UMR 7327, 1A rue de la Férollerie 45071 Orléans Cedex 2, France.
Abstract. For mineral processing, an ore can be defined
as the assemblage of useful mineral grains and gangue mineral grains. The first step of ore mineral processing involves crushing the material in order to achieve required mineral liberation. When it is achieved, in the ideal case, resulting fragments are formed: 1) only by useful minerals or 2) only by gangue minerals. This work consists to develop a numerical tool to determine the liberation mesh size of a given ore. With this aim, 1) a sample of the considered ore is modelled by a binary 3D image segmentation. Then, 2) a grinding process is modelled by a digital approximation of a Voronoi tessellation of the image, with random seeds. Each Voronoi cell represents a fragment of the ground ore sample. Fragments must meet several conditions so that they reproduce the characteristics of the crushing products in the mineral industry (e.g. the particle size distribution must follow a Rosin-Rammler law and the shape of the fragments must be close to spheres). This modelling allows obtaining the characteristics of the liberation mesh size. This is an important parameter to evaluate the feasibility of a mining project because the grinding operations are very expensive. This study would: 1) to evaluate and predict grinding costs from the bulk ore texture and 2) to provide an assessment tool downstream of the means of current observations and conventional analysis.
Keywords. Liberation mesh size, modelling, Voronoi cell,
grinding.
1 Introduction
For mineral processing, an ore can be defined as the assemblage of useful mineral grains and gangue mineral grains. The first step of ore mineral processing involves crushing this material in order to achieve required mineral liberation. The liberation mesh size of a mineral is the size below which a mineral particle is completely liberated, that is to say only constituted of mineral species to value (Fig. 1). In general, the mineral industry tolerates 20% of mixed particle (i.e. fragments compounded of useful minerals and gangue minerals) (Blazy 1970) but this depends on the commodities and cases. Obtaining the liberation mesh size is an important parameter to assess the feasibility of a mining project. The grinding operations are very costly in energy. Up to 70% of the expensed energy in a mine can be used for grinding. The evaluation of the minerals characteristics (size of each particle, average of particle size, particle shape, present minerals, modal mineralogy, chemical composition of minerals, distribution of valuable element between minerals, texture (grain size, mineral association), degree of liberation by size, associated minerals in particles, ...) is important to achieve the best possible treatment (Kelly and Spottiswood 1982; Gy
1967). But a rigorous description of such a product is time demanding and costly in evaluation and characterization of the resource.
The purpose of this work is to evaluate a liberation mesh size estimation to quantify the particle size of the ore in the early stages of mineral exploration, i.e. at the time when the samples of the studied mineralization have a volume at most some cubic decimeters.
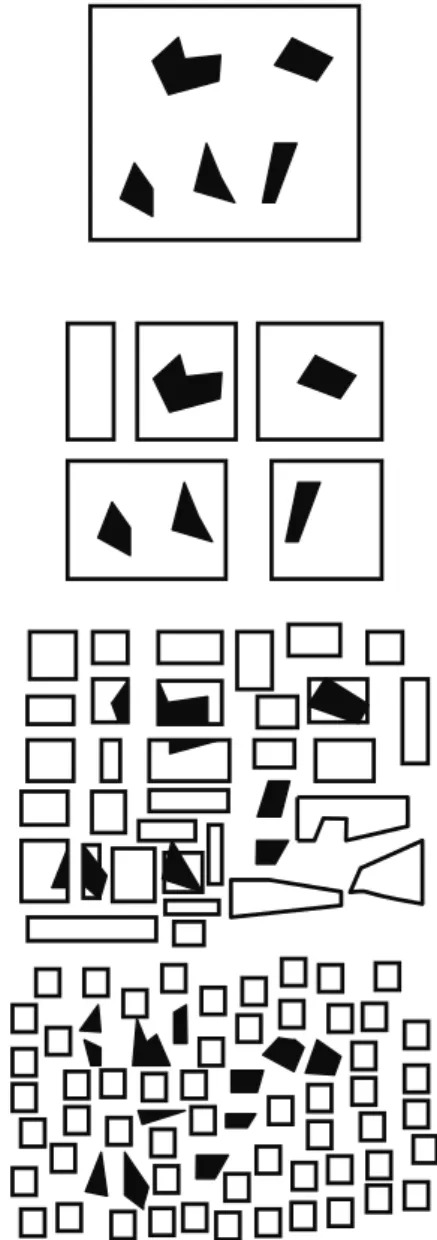
Figure 1. Schematic ore fragmentation. The top image
represents the bulk ore with useful minerals (in black) and gangue minerals (in white). The Three other images correspond to successive stages of fragmentation. Down, the ideal liberation of the useful minerals is achieved.
MINERAL RESOURCES IN A SUSTAINABLE WORLD • 13th SGA Biennial Meeting 2015. Proceedings, Volume 4
1448
2 An approach for the modelling of
liberation mesh size
Theoretical studies on the particle size of fragmented ore have highlighted the role of some parameters: shape factor, particle size distribution parameter, and texture of the initial product (i.e. bulk ore). A model of mineral liberation must take into account these characteristics. In other words, we state that if these characteristics evaluated on a numerical model are the same as that of a real crushed sample, this grinding model can be considered as satisfactory.
2.1 Shape factor
The shape factor is defined using the opening d of the smallest square mesh of the sieve capable of passing the fragment (Gy 1967). For ground products of the mineral industry, the shape factor (f = volume of the particle / d3) measures the deviation from a cubic shape (Gy 1967). The study of many crushed ores showed that for a fragment, f is usually close to 0.5 (Gy 1967), i.e. the shape of the fragments is close to sphere. In addition, the f parameter varies little from one mineral to another and for a given mineral, of a size to another (Gy 1967).
2.2 Particle size distribution parameter
It is useful to adjust the experimental data of the particle size measures to an analytical function. It consists in building a curve from mathematical functions and adjusting the parameters of this function to be closer to the experimental curve. These parameters will be handled so that the calculations with this function were easier than the calculations on experimental data. Different models are used for adjusting the particle size distributions (Allen 1981; Peleg 1996; Ouchterlony 2005). The most widely used model for the case of particle size data from the mineral industry is the Rosin-Rammler function. The model of Rosin-Rosin-Rammler can be considered as a Weibull distribution (Patel 1976; Outal 2006).
The particle size distribution parameter was defined as g = d95 / d5 > 4 for many ores (Gy 1967).
2.3 Texture of the bulk ore
In this study, we developed a new approach to model ore grinding and determine the liberation mesh size. Ore images were obtained by X-ray microtomography which is a nondestructive imaging technique that provides 3D images of the interiors of materials (e.g. Rozenbaum and Rolland du Roscoat 2014). Each voxel in the 3D image was characterized by its grey level (ranging from 0 to 255 for an 8-byte image), which depended on the X-ray attenuation coefficient of the element. This attenuation coefficient depends on material density and on the atomic number of the components. In other words, at each space position of the 3D image, a grey value corresponds to a given phase (gangue and useful minerals).
Prior to model grinding, the different phases have to be distinguished that is known as the segmentation step.
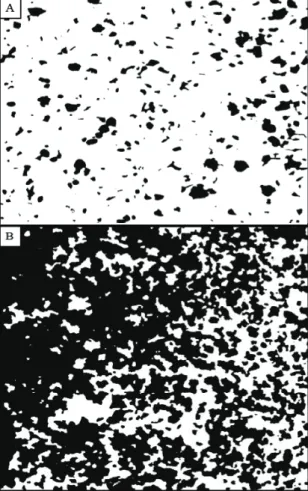
Segmentation is the process of partitioning the grey level voxels of the 3D image into distinct phases. Due to noise inherent to image acquisition, a preprocessing step was firstly applied consisting in a noise reduction (filtering). This preprocessing step was followed by a thresholding step (see Le Trong et al. 2008 for more details). As a result, the segmented 3D image is transformed to a binarised image as shown in Fig. 2. The ore used for this study is hosted in Aptian carbonate formations of the northern Spain from Reocin (MVT deposit type). Therefore, in white is represented dolomite and marcasite (gangue phase) and sphalerite and galena in black (useful minerals).
Figure 2. 2D images extracted from 3D binarised images. A.
image poor in useful mineral; B. image rich in useful mineral. The gangue phase is in white (dolomite and marcasite) while the useful mineral is in black (sphalerite and galena).
2.4 Fragmentation model
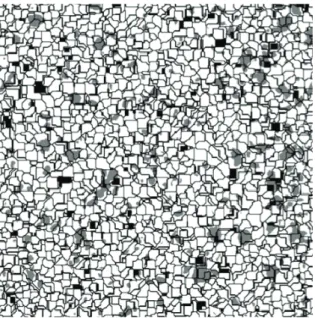
Outal (2006) has observed that its processed image shows particles of a fragmented rock whose particular shape can be assimilated to a Voronoi diagram (Fig. 3). Therefore, for this study, we propose to model grinding results by 3D Voronoi cell paving. Voronoi diagrams represent distance relationships between objects. All Voronoi regions are in shape of polyhedra and convex (Fig. 3) that looks like fragments from grinding in mineral industries. The grindability of all the ore component phases is considered identical.
Figure 3. An example of 2D Voronoi cells representation of
polyhedron and convex shape from germs (represented by the red points).
3. The proposed liberation model
To model the liberation mesh size, we numerically grind the 3D binarised image of bulk ore with 3D Voronoi cells up to the liberation mesh size (Fig. 4). For this, we must take into account: 1) the texture of bulk ore; 2) grinding; 3) the edge effects.
Figure 4. Grinding modelisation with Voronoi cells. For sake
of clarity only a 2D image extracted from the 3D image is represented here.
To build the Voronoi cells, a set of random points is generated within the 3D binarised image (Fig. 5). These points are called germs. Then, a computer code developed by authors allows Voronoi cell formation (cells expand until they touch other cells in each direction in space). This simulates the grinding as each dilated cell forms a fragment. For each fragment, we get its size, its useful mineral content and its shape factor. Note that the density of germs controls the shape of the granulometric curve. The edge effect is controlled by removing all the cells that are on the boundary of the image.
Figure 5. Building of Voronoi cells: a) germs generated
within the 3D image; b) cells expanded; c) cells touching other cells and forming fragments.
From a real bulk ore, we choose two binary 3D images: one rich in useful mineral and the other one poor in useful mineral (Fig. 2). For each image, we generate several quantities of germs (10000, 50000, 100000 and 200000) (Fig. 5). For each amount of germs, we study the size distribution of all fragments and the size distribution of fragments having at least 80% of useful mineral (obtaining practical liberation mesh size) (Fig. 6). These distributions are, in fact Rosin-Rammler distributions.
To validate our breakage ore model, we will compare the results of the modelling work with real measurements on mining product during grinding in the Reocin mine. This will validate the model or change it if does not describe well enough the reality.
Figure 6. Comparison of size distribution of fragments having
at least 80% of useful mineral. Cells diameters are in voxels (modified after Ngassa Tankeu 2014).
4. Conclusion
The purpose of this study is to make an estimate of the liberation mesh size with the data available in the early stages of mineral exploration. This is to allow estimating the energy cost of grinding to liberation mesh size and provide an assessment tool downstream current means of observation (HyChips, Qemscan, X-ray tomography) and conventional analysis. For this, we simulated a bulk ore grinding from Voronoi cells. The particle size distribution of these fragments is similar to a Rosin-Rammler distribution. The results are encouraging.
The ultimate goal of this study is to build a 3D diagram in which the particle size curve and for each size fraction, the liberation degree within the particle size fraction, are plotted.
2 An approach for the modelling of
liberation mesh size
Theoretical studies on the particle size of fragmented ore have highlighted the role of some parameters: shape factor, particle size distribution parameter, and texture of the initial product (i.e. bulk ore). A model of mineral liberation must take into account these characteristics. In other words, we state that if these characteristics evaluated on a numerical model are the same as that of a real crushed sample, this grinding model can be considered as satisfactory.
2.1 Shape factor
The shape factor is defined using the opening d of the smallest square mesh of the sieve capable of passing the fragment (Gy 1967). For ground products of the mineral industry, the shape factor (f = volume of the particle / d3) measures the deviation from a cubic shape (Gy 1967). The study of many crushed ores showed that for a fragment, f is usually close to 0.5 (Gy 1967), i.e. the shape of the fragments is close to sphere. In addition, the f parameter varies little from one mineral to another and for a given mineral, of a size to another (Gy 1967).
2.2 Particle size distribution parameter
It is useful to adjust the experimental data of the particle size measures to an analytical function. It consists in building a curve from mathematical functions and adjusting the parameters of this function to be closer to the experimental curve. These parameters will be handled so that the calculations with this function were easier than the calculations on experimental data. Different models are used for adjusting the particle size distributions (Allen 1981; Peleg 1996; Ouchterlony 2005). The most widely used model for the case of particle size data from the mineral industry is the Rosin-Rammler function. The model of Rosin-Rosin-Rammler can be considered as a Weibull distribution (Patel 1976; Outal 2006).
The particle size distribution parameter was defined as g = d95 / d5 > 4 for many ores (Gy 1967).
2.3 Texture of the bulk ore
In this study, we developed a new approach to model ore grinding and determine the liberation mesh size. Ore images were obtained by X-ray microtomography which is a nondestructive imaging technique that provides 3D images of the interiors of materials (e.g. Rozenbaum and Rolland du Roscoat 2014). Each voxel in the 3D image was characterized by its grey level (ranging from 0 to 255 for an 8-byte image), which depended on the X-ray attenuation coefficient of the element. This attenuation coefficient depends on material density and on the atomic number of the components. In other words, at each space position of the 3D image, a grey value corresponds to a given phase (gangue and useful minerals).
Prior to model grinding, the different phases have to be distinguished that is known as the segmentation step.
Segmentation is the process of partitioning the grey level voxels of the 3D image into distinct phases. Due to noise inherent to image acquisition, a preprocessing step was firstly applied consisting in a noise reduction (filtering). This preprocessing step was followed by a thresholding step (see Le Trong et al. 2008 for more details). As a result, the segmented 3D image is transformed to a binarised image as shown in Fig. 2. The ore used for this study is hosted in Aptian carbonate formations of the northern Spain from Reocin (MVT deposit type). Therefore, in white is represented dolomite and marcasite (gangue phase) and sphalerite and galena in black (useful minerals).
Figure 2. 2D images extracted from 3D binarised images. A.
image poor in useful mineral; B. image rich in useful mineral. The gangue phase is in white (dolomite and marcasite) while the useful mineral is in black (sphalerite and galena).
2.4 Fragmentation model
Outal (2006) has observed that its processed image shows particles of a fragmented rock whose particular shape can be assimilated to a Voronoi diagram (Fig. 3). Therefore, for this study, we propose to model grinding results by 3D Voronoi cell paving. Voronoi diagrams represent distance relationships between objects. All Voronoi regions are in shape of polyhedra and convex (Fig. 3) that looks like fragments from grinding in mineral industries. The grindability of all the ore component phases is considered identical.
Figure 3. An example of 2D Voronoi cells representation of
polyhedron and convex shape from germs (represented by the red points).
3. The proposed liberation model
To model the liberation mesh size, we numerically grind the 3D binarised image of bulk ore with 3D Voronoi cells up to the liberation mesh size (Fig. 4). For this, we must take into account: 1) the texture of bulk ore; 2) grinding; 3) the edge effects.
Figure 4. Grinding modelisation with Voronoi cells. For sake
of clarity only a 2D image extracted from the 3D image is represented here.
To build the Voronoi cells, a set of random points is generated within the 3D binarised image (Fig. 5). These points are called germs. Then, a computer code developed by authors allows Voronoi cell formation (cells expand until they touch other cells in each direction in space). This simulates the grinding as each dilated cell forms a fragment. For each fragment, we get its size, its useful mineral content and its shape factor. Note that the density of germs controls the shape of the granulometric curve. The edge effect is controlled by removing all the cells that are on the boundary of the image.
Figure 5. Building of Voronoi cells: a) germs generated
within the 3D image; b) cells expanded; c) cells touching other cells and forming fragments.
From a real bulk ore, we choose two binary 3D images: one rich in useful mineral and the other one poor in useful mineral (Fig. 2). For each image, we generate several quantities of germs (10000, 50000, 100000 and 200000) (Fig. 5). For each amount of germs, we study the size distribution of all fragments and the size distribution of fragments having at least 80% of useful mineral (obtaining practical liberation mesh size) (Fig. 6). These distributions are, in fact Rosin-Rammler distributions.
To validate our breakage ore model, we will compare the results of the modelling work with real measurements on mining product during grinding in the Reocin mine. This will validate the model or change it if does not describe well enough the reality.
Figure 6. Comparison of size distribution of fragments having
at least 80% of useful mineral. Cells diameters are in voxels (modified after Ngassa Tankeu 2014).
4. Conclusion
The purpose of this study is to make an estimate of the liberation mesh size with the data available in the early stages of mineral exploration. This is to allow estimating the energy cost of grinding to liberation mesh size and provide an assessment tool downstream current means of observation (HyChips, Qemscan, X-ray tomography) and conventional analysis. For this, we simulated a bulk ore grinding from Voronoi cells. The particle size distribution of these fragments is similar to a Rosin-Rammler distribution. The results are encouraging.
The ultimate goal of this study is to build a 3D diagram in which the particle size curve and for each size fraction, the liberation degree within the particle size fraction, are plotted.
MINERAL RESOURCES IN A SUSTAINABLE WORLD • 13th SGA Biennial Meeting 2015. Proceedings, Volume 4
1450
An opportunity of improvement for this work is the introduction of preferential fragmentation i.e. the grindability of the different phases constituting the ore is no longer considered to be identical.
References
Allen T (1981) Particle size measurement. Chapman and Hall, London, 678 pp
Blazy P (1970) La valorisation des minerais – manuel de minéralurgie. Presses universitaires de France, Paris, 416pp Gy P (1967) L’échantillonnage des minerais en vrac. Tome 1 :
théorie générale. Revue de l’industrie minérale, Paris, 186 pp Herbulot A (2007) Mesures statistiques non-paramétriques pour la
segmentation d’images et de vidéos par contours actifs. Thèse de 3ème cycle de l’Université de Nice - Sophia Antipolis, 176
pp
Kelly EG, Spottiswood DJ (1990) Introduction to minerals processing. 516 pp
Le Trong E, Rozenbaum O, Rouet JL, Bruand A (2008) A simple methodology to segment x-ray tomographic images of a multiphasic building stone. Image Anal Stereol 27:175-182
Ngassa Tankeu YG (2014) Modélisation de la fragmentation d’un minerai en vue de l’évaluation de la “maille de liberation”. Rapport de Master 2 de l’Université d’Orléans et de Yaoundé 1, 31 pp
Ouchterlony F, Niklasson B, Abrahamsson S (1990) Fragmentation monitoring of production blasts at Mrica. Third International Symposium on Rock Fragmentation by Blasting. The Australian Institute of Mining and Metallurgy 283-289 Outal S (2006) Quantification par analyse d'images de la
granulométrie des roches fragmentées : amélioration de l’extraction morphologique des surfaces, amélioration de la reconstruction stéréologique. Thèse de 3ème cycle de l’Ecole
des Mines de Paris, 217 pp
Patel JK, Kapadia CH, Owen DB (1976) Handbook of Statistical Distributions. Marcel Dekker, New York, 302 pp
Peleg M (1996) Determination of the parameters of Rosin-Rammler and beta distributions from their mode and variance equation-solving software. Powder technology 87(2):181-184. Rozenbaum O and Rolland du Roscoat S (2014) Representative
elementary volume assessment of 3D x-ray microtomography images of heterogeneous materials: application to limestones. Physical Review E89:053304
QEMSCAN
®
Applied to Zn(Pb) Nonsulfide Ores:
Advantages and Limitations
Licia Santoro, Maria Boni
Università degli studi di Napoli, Federico II, Dipartimento di Scienze della Terra, dell’Ambiente e delle Risorse, Via
Mezzocannone 8, Napoli, IT, licia.santoro@unina.it, L.Santoro@nhm.ac.uk; boni@unina.it
Gavyn Rollinson
Camborne School of Mines, University of Exeter, Penryn, Cornwall, UK, g.k.rollinson@exeter.ac.uk
Abstract. The mineralogy of supergene Zn(Pb)
nonsulfides is difficult to characterize, due to the complex association of mineral species in these deposit types. Since these ores are commonly treated by hydrometallurgy, the lack of accurate mineralogical results can cause several problems in both processing and metallurgical stages. QEMSCAN® analyses have been carried out, in order to improve accuracy of nonsulfide ores characterization, in term of mineralogy, petrography, chemistry and quantitative amount. Three nonsulfide deposits with different grades of mineralogical complexity have been considered for this purpose: Hakkari Zn(Pb) in Turkey; Jabali Zn-Pb(Ag) in Yemen; Reef Ridge Zn in Alaska. Previous studies, which used traditional analytical methods were used as a basis to develop the QEMSCAN® analytical routine for the three deposits. The QEMSCAN® study, though confirming the main findings of previous research, has also added new information (e.g. the amount of trace minerals, amorphous phases, impure phases etc.) that traditional technologies were not able to provide. SEM-EDS validation analysis was also necessary, in order to avoid misleading data. In conclusion, it was possible to understand the advantages and limitations of using the QEMSCAN® method for the choice of the best routine during feasibility study.
Keywords. Supergene nonsulfides Zn(Pb), Hakkari,
Jabali, Reef Ridge, mineralogy, QEMSCAN®.
1 Introduction
Supergene Zn(Pb) nonsulfide deposits form from the oxidation of sulfide-bearing concentrations by meteoric waters (Hitzman et al. 2003). Their mineralogy, generally consisting of an association of many mineral species (i.e. Zn/Pb-carbonates, Zn-(hydro)silicates, Fe-(hydr)oxides, Fe/Pb-sulfates, Zn/Pb-phosphates and remnants of primary sulfides), is complex to characterize. For this reason, the economic value of nonsulfide zinc ores is strictly dependent not only on the geological knowledge of each deposit, but also in the specific characteristics of its mineralogical association (Boni and Mondillo 2015). The mineralogical charac-terization of these deposit types, the definition of the mineral association, their textural parameters, and the element deportment, are all very important issues to predict the metal (Zn-Pb) recovery, and hence the sustainability of an orebody. Accurate and reliable information is needed to avoid misleading data that can cause several problems in the processing and metallurgical stages (recovery issues, penalties at the smelter, poor metal quality, and environmental damage).
The best methods known so far to characterize an orebody from the quantitative point of view, are “Automated Mineralogy” technologies such as QEMSCAN® (Quantitative Evaluation of Minerals by Electron Microscopy), which allow accurate information about several ore parameters to be obtained: modal mineralogy, element deportment, particle images, mineral association, theoretical grade recovery, shape and particle size and mineral liberation. This technique has been only sporadically used for the characterization of nonsulfide ores: the first published attempt was carried out on the Accha prospect (Peru) (Rollinson et al. 2011). Here we report the application of QEMSCAN® technology on three mineralogically different nonsulfide Zn(Pb) deposits: Hakkari Zn(Pb) in Turkey; Jabali Zn-Pb(Ag) in Yemen; Reef Ridge Zn in Alaska. These deposits were already subjected to mineralogical, petrographic and geochemical characterization by more traditional analytical techniques (OM, CL, XRD, SEM-EDS, WDS, ICP/MS). This study was carried out partly as a PhD Thesis by L. Santoro at the University of Napoli Federico II (Italy).
The Hakkari nonsulfide zinc deposit (estimated resources of about 10 Mt @ 15% Zn, MSA Group Ltd., 2013) is situated at the southeastern border of Turkey, ~60 km east of Hakkari and Sirnak Provincial boundary. The ore concentrations, mainly consisting of smithsonite and hemimorphite, mixed with Fe–Mn-(hydr)oxides and remnant sphalerite, are hosted in Jurassic carbonate rocks (Cudi Group) within the northern border of the Arabian Platform (Santoro et al. 2013). The Jabali Zn– Pb(Ag) nonsulfide deposit (resources of about 8.7 Mt @ 9.2% Zn, ZincOx resources plc. 2007) is located about 110 km east of Sana'a (Yemen). The rock hosting the ore is a dolomitized carbonate platform of the Jurassic Shuqra Formation (Al Ganad et al. 1994). Smithsonite is the most abundant economic mineral in the nonsulfide deposit, and is associated with minor hydrozincite, hemimorphite, acanthite and greenockite. Cerussite and anglesite also occur as main lead minerals. Goethite, hematite, and Mn-(hydr)oxides are common in the mining area; Ag-sulfide and native silver are also present locally (Mondillo et al. 2014). The small Reef Ridge prospect is located in the Yukon-Koyukuk region of west central Alaska (USA), hosted in Devonian carbonate rocks of the Farewell Terrane (Decker et al. 1994). The most abundant Zn mineral is smithsonite, replacing both sphalerite and the host carbonates, and also occurring as cement in vugs and fractures.