Publisher’s version / Version de l'éditeur:
Materiaux et constructions. Materials and Structures, 34, pp. 1-8, 1973-07
READ THESE TERMS AND CONDITIONS CAREFULLY BEFORE USING THIS WEBSITE. https://nrc-publications.canada.ca/eng/copyright
Vous avez des questions? Nous pouvons vous aider. Pour communiquer directement avec un auteur, consultez la première page de la revue dans laquelle son article a été publié afin de trouver ses coordonnées. Si vous n’arrivez pas à les repérer, communiquez avec nous à [email protected].
Questions? Contact the NRC Publications Archive team at
[email protected]. If you wish to email the authors directly, please see the first page of the publication for their contact information.
NRC Publications Archive
Archives des publications du CNRC
This publication could be one of several versions: author’s original, accepted manuscript or the publisher’s version. / La version de cette publication peut être l’une des suivantes : la version prépublication de l’auteur, la version acceptée du manuscrit ou la version de l’éditeur.
Access and use of this website and the material on it are subject to the Terms and Conditions set forth at
Frost action in cement paste
Litvan, G. G.
https://publications-cnrc.canada.ca/fra/droits
L’accès à ce site Web et l’utilisation de son contenu sont assujettis aux conditions présentées dans le site LISEZ CES CONDITIONS ATTENTIVEMENT AVANT D’UTILISER CE SITE WEB.
NRC Publications Record / Notice d'Archives des publications de CNRC:
https://nrc-publications.canada.ca/eng/view/object/?id=99d72f31-9b59-4903-909c-37bb8fcfcb15 https://publications-cnrc.canada.ca/fra/voir/objet/?id=99d72f31-9b59-4903-909c-37bb8fcfcb15
Frost action in cement paste
G.G. LITVANFrost action in cement paste
G.G. LITVAN (I)
An earlier theory of frost action is further developed and its implications consideled, particularly with regard to testing. Factors determining durability of paste, dimensions of sample, degree of saturation and rate of cooling are discussed. It is shown that cumulative residual expansion is a good indicator for testing frost resistance : samples can be evaluated after 10
to 15 freeze-thaw cycles. The results are discussed in relation to existing tcsts.
A theory of frost action in cement paste has been proposed in previous publication [l, 21. Some impli- cations of ths mechanisms associated with it, with particular reference to testing, are considered in the present paper.
The basic element of the mechanism is the discovery that water adsorbed on the surface or contained in the capillaries of porous solids does not freeze without redistribution. Failure of solidification is, presumably, due to the action of surface forces restricting the mobility of the water molecules and preventing them from arranging themselves in an order required for crystal lattice formation.
Experiments also show that adsorbed water unfro- zen below 0 O C has the same properties as supercooled water. It should be noted, however, that freezing of
(I) Ph.D., Research Officer, Materials Section, Division of Building Research, National Research Council of Canada, Ottawa, Canada.
adsorbed supercooled water, in contrast with bulk supercooled water, cannot be initiated by nucleation. From this it should follow that when a water saturated sample of cement enclosed in a container is cooled to below 0 O C , say to
-
1 O C , liquid water in the paste and ice crystals on the walls of the vessel will be pre- sent simultaneously. Because undercooled water has a higher vapor pressure than ice, however, this is not an equilibrium state and cannot be maintained without violating the fundamental laws of nature. As the vapor pressure difference cannot be eliminated by solidifica- tion of the liquid, equilibrium is reached by a different mechanism.Cement paste can be in equilibrium at any relative humidity below 100
%
by appropriate adjustment of water content. Indeed, by expelling some water a paste can equilibrate with the ice crystals in the envi- ronment that maintain relative humidity with reference to bulk water below 100%.
The exuded water, once outside the pore system, promptly freezes so that ice accumulates on the external surface of the specimen or on the container wall. Equilibrium conditions are now established, and the newly formed ice crystals are indistinguishable from those on the container walls; at the same time, the partially desiccated cement paste is in equilibrium with the external ice.Any further cooling, for example to
-
2 O C , upsets equilibrium because the difference in vapor pressures of ice and supercooled water is not constant but increases with decreasing temperature. At the newTABLE I - Amount of water lost by fully saturated cement samples on decrease of relative humidity from
100 to 80 %
TABLE I1 - Desorption time of half the amount of water lost by non-air entrained cement samples on decrease
of relative humidity from 100 to 80 %
w / c Ratio Non-Air Entrained 1 Expressed in g water Per g / of saturated
j
0.0168 (0.4 paste,
W/C paste)1
Air Entrained I g water per g saturated pastelower temperature, therefore, an additional amount of water is expelled by the paste to reduce its vapor pressure to that of the external, bulk ice. Continuing reductions in temperature cause continuing expulsion of water that results in accumulation of ice in the surroundings of the paste and desiccation of the paste itself.
This mechanism can damage cement or concrete in several ways. If a flaw in the solid is surrounded by sound concrete, any water from the undamaged portion will migrate, on cooling, to the crack, filling it comple- tely; on solidifying it causes the fissure to propagate. On the following cooling portion of the freeze-thaw cycle the wider crack draws more water and freezing results in further damage. This mechanism operates, with increasing severity, until complete destruction occurs. Characteristically, damage is concentrated in the weakest part of the system, and the strong, sound portions are protected at the expense of weak, susceptible areas.
Damage also occurs when the required rate of water expulsion usually necessitated by rapid cooling is so high that it cannot be realized in the paste. In such cases some of the passage ways presumably become blocked by ice and internal pressure is generated.
FACTORS AFFECTING FROST RESISTANCE
For purposes of testing and design it is essential to specify the parameters that control the mechanism of frost action. The implications of the proposed theory are now considered in three groups relating to paste, water and environment.
Pore structure
The pore structure of the cement matrix and the stone is perhaps the most important property affecting durability. Ideally, porosity should be very low in order to reduce water content. In any case, very large and very small pores are preferable to those of medium size because large pores are seldom full and the small ones become involved in the freezing mechanism only at very low temperatures.
- -
Half Time
Ratio in multiples of
in seconds
/
2600 (0.4 W/C)The features of the pore system of cement paste are determined mainly by the water-cement ratio (W/C). The amount of water that has to be removed to maintain equilibrium during the traversing of a given temperature range is of importance. This quantity depends on porosity. Ease of flow, characterized by permeability, is also of prime interest. Table I shows the approximate amount of water lost by fully satu- rated cement pastes of different W/C ratios when the relative humidity is reduced from 100 to 80
%.
The amounts of water are approximately equal to the quantities that saturated specimens expel when cooled from 0 OC to - 25 OC. According to these values the amount of water that has to leave a paste with a W/C ratio of 0.8 when it is cooled by 25 C degrees is approximately 6.5 times greater than that from a paste with a W/C ratio of 0.4.Reduction of water content is, of itself, not detri- mental, but when the process is impeded damage ensues. Low permeability, i.e. resistance of the pore structure to water flow, may create such a condition. Cement pastes with high W/C ratios (owing to their higher water content) require higher permeability if damage is to be avoided. In a series of exploratory experiments the " half times " were determined for
desiccation of various cement pastes when the rela- tive humidity was reduced from 100 to 80
%.
(The term, half time, is used because it gives the time neces- sary for desorption of half the amount required to establish equilibrium.) The values shown in Table I1 indicate that under these conditions the rate of drying of cement pastes of different W/C ratios is similar. For example, paste with a W/C ratio of 0.8 lost 6.5 times the amount of water desorbed from paste with a W/C ratio of 0.4, and the half times have a ratio of 1 to 7.5. This is somewhat surprising because it would be not unreasonable to expect that the rate of drying would increase as the pore volume (porosity) increases.The essentially unchanged rate of drying begins to explain frost susceptibility of pastes with high W/C ratios : with increase in W/C ratio the amount of water to be exuded increases sharply without the benefit of increased permeability. The mechanism by which air entrained bubbles protect cement paste is clear. Barring unusual circumstances, the large cavities pro- vided by bubbles serve as reservoirs into which, with
cooling, expelled water can escape. Short distances between bubbles eliminate the need for migration of water to distant external surfaces.
Degree of Saturation
This is the second factor affecting durability. The total volume of the pores in the cement paste and their size distribution after hydration are given and remain unchanged. Whether voids are filled with water or remain partially empty is determined by external conditions : relative humidity, and the geometric design of the structure.
Relative humidity in the atmosphere over concrete in the field cannot readily be altered so that essen- tially nothing can be done along this line to prevent frost damage. On the other hand, concrete may contain water from wetting by rain, from groundwater or ina- dequate drainage. Good architectural and engineering design can greatly improve durability by minimizing the time of exposure to water.
Relative Humidity and Temperature
These factors are the most important among those that define environmental conditions with regard to frost action. The absolute value of the minimum temperature below 0 OC determines the fraction of pores involved in the freezing mechanism. Perhaps not fully realized is the significance of the rate of temperature change. If the rate is slow enough, desorp- tion can take place in an orderly fashion but rapid cooling by only a few degrees can result in damage.
TEST FOR EVALUATION OF FROST RESISTANCE
Several authors have raised the possibility of assessing durability by residual length change, viz. the difference in length after a complete cycle deter-
mined at a fixed temperature above 0 OC, for example
+
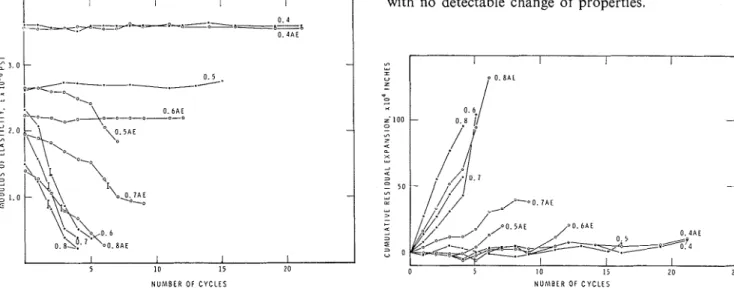
5 OC (2, 3, 4, 5). The present research is based on the hypothesis that residual length change is a sensitive indicator of frost susceptibility, that poor correlation, if experienced in the past, was due to insufficient control of the decisive factors (such as degree of saturation) affecting residual length change.Specimens were evaluated in the conventional freeze- thaw test and in a simplified one referred to as the modified freeze-thaw test. The details of fabrication of the specimens and the test procedures are given in the Appendix (6). The dynamic modulus of the specimens decreased with the number of freeze-thaw cycles (fig. 1). Increase in length of the specimens after each freeze-thaw cycle, expressed as the difference related to the original length, is termed cumulative residual expansion and these values are shown in figure 2. The following points may be noted.
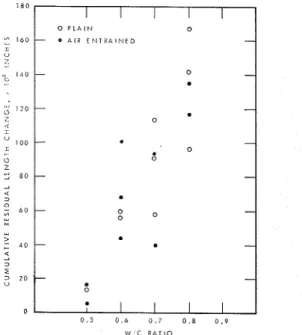
(1) Dynamic modulus of elasticity (E) is not a more sensitive measure of frost resistance than cumulative residual expansion. On plotting the two quantities against each other (fig. 3), deviation from the linear relation, if it occurs at all, is in the direction of length change, indicating greater sensitivity of this property. (2) Residual expansion, just as E, once started, changes monotonously until failure occurs. The values of the critical residual expansion as a function of W/C ratio are shown in figure4.
(3) The curves for E and residual expansion versus cycle number do not level off after having started to change, but they may start to change after only a few cycles. The cause of the " incubation period " is not clear, but it is probable that increase in the degree of saturation during the first few freeze-thaw cycles is the factor that renders the freezing process damaging.
(4) If cumulative residual expansion remains zero for at least 10 to 15 freeze-thaw cycles no damage can be expected to occur, regardless of the number of cycles, so long as the characteristic features of the cycle remain unaltered. At present, two specimens (W/C ratios 0.4) have so far endured more than 150 freeze-thaw cycles in the conventional apparatus with no detectable change of properties.
NUMBER O F CYCLES NUhlBER O F CYCLES
Fig. 1.
-
Change of modulus of elasticity with number of freeze- Fig. 2. - Change of cumulative residual expansion of specimens thaw cycles. The W/C ratio of the specimens is indicated with the number of freeze-thaw cycles. The W/C ratio of the on the curves. AE designates air entrainment. Vertical bars specimens is indicated on the curves. AE designates air entrain- indicate 40 per cent reduction in modulus. ment.I 0 P L A I N 0 I
D E C R E A S E I N M O D U L U S O F E L A S T I C I T Y . Z
Fig. 3. - Plot of cumulative residual expansion versus percentage decrease in modulus of elasticity. The W/C ratio of the spe- cimens is indicated on the curves. AE designates air entrainment.
These results suggest that frost resistance may be assessed in 10 to 15 cycles, with no need for expensive apparatus. It must be emphasized, however, that test specimens were 14 months old and that further work is required to establish the validity of the findings for younger, i.e. 28-day samples.
ASSESSMENT OF FROST RESISTANCE
In the light of the proposed mechanism of frost action a few comments may be appropriate regarding current testing procedures. Almost two decades ago, Powers [3] specified the factors that determine frost susceptibility, that must be determined or at least controlled in testing : degree of saturation, sample dimensions, and cooling rate. Experience has confirmed these conclu- sions, which are now explicable by the present proposed theory.
If the paste is partially instead of completely satu- rated, a fraction of the large pores are not filled; thus, less water has to be exuded ar,d the partially empty pores can act as reservoir that accommodate the water expelled from neighboring capillaries involved in the freezing process. Sample dimensions may determine the length of the migration path of water on wetting and, through this, affect the degree of saturation for a given soaking time and the expansion on freezing. Rate of cooling affects the required rate of desorption. The specifications of ASTM test C666 [7] are not rigorous for these important aspects. Rate is specified only by stating that " the time required for the tempe- rature at the center of any single specimen to be reduced from 37 to 3 O F shall be not less than one half
of the length of the cooling period, " which must be longer than 2 and less than 4 hours. The sample dimen- sions are permitted to vary from 3 to 5 in. in width and from 14 to 16 in. in length (only the smallest dimension is of significance because this determines the minimum length of the migration path). The importance of the degree of saturation is emphasized, but considerable change in water content can take place depending on the operator's interpretation of the procedural requi- rements.
Fig. 4. - Cumulative residual length change of various W/C ratio cement samples before failure.
The lack of agreement in the results obtained by the various testing laboratories is probably mainly caused by inadequately controlled moisture content. In this respect, the design of the cooling chamber has a decisive effect. The standard test permits a difference of 50 F degrees between the surface and center temperatures and does not restrict the magnitude of the difference between the temperature of the specimen surface and that of the wall. The existence of such large tempera- ture differences causes desiccation resulting from distillation or sublimation. It would be difficult to overestimate the importance of regulating this feature. The tentative test method for critical dilation (ASTM 671-71T) [7] specifies determination of the immersion time required to obtain critical dilation on slow tem- perature cycling. Dilation is the vertical distance measured on the length change versus time curve from a straight line projection of the prefreezing and maximum expansion. Critical dilation is considered to have been obtained when the numerical difference between dilations increases by a factor of 2 or more from one cycle to the next.
The rate of cooling is specified, 5 F degrees per hr, but the test seems to suffer from two weaknesses :
1) lack of specification regarding curing and condi- tioning prior to testing, and 2) extremely long testing time (one cycle per 14 days).
Previous investigations [l] showed that the magni- tude of dilation is affected by porosity, permeability, cooling rate and degree of saturation. If cooling rate is constant, increased dilation of a given solid can be caused by either gain in water content or altered permeability and porosity resulting from frost action. No easily performed test is available for identifi- cation of the cause of dilation. The tentative test procedure utilizes the fact that the rate of dilation originating from rising water content decreases until it levels off, while the rate of expansioil due t o frost action increases until total destruction sets in. Temper-
ature cycling is carried to an advanced degree of deterioration to eliminate this uncertainty regarding the cause of dilation, but it lengthens testing time. Increased accuracy of the length change measurement does not shorten testing time since the temperature cycling has to be continued until the magnitude of dilation increases by a factor of 2.
Whereas dilation for most materials is non-zero and positive values are detrimental only if expansion is non-elastic, non-zero value for residual expansion is always a manifestation of damage unless change in water content has occurred. If, therefore, adequate saturation can be achieved prior to the test and maintained for its duration, any non-zero residual expansion will be indicative of frost susceptibility under a given test condition. Saturation can be aided by reduction of sample dimensions and avoidance of even temporary desiccation during curing and handling. Increased accuracy of the length change determination now either shortens the testing time or improves the quality of the results for the number of cycles. Theoretically, it is possible to assess frost resistance in a single freeze-thaw cycle. In practice, however, allowance has to be made for the possibility of inadequate saturation prior to testing, so that 10 to 15 cycles are required by the proposed procedure. At least one cycle can be performed in 24 hours, and more if automatic equipment is available.
In evaluating frost durability of rock samples Dunn and Hudec [8] concluded that smaller percentages of contained water froze in frost susceptible rocks than in frost resistant rocks. The amount of frozen water was estimated from the amount of heat liberated
(DTA). Although experimentally confirmed 191, this finding gave rise to considerable controversy. It is, however, consistent with theory; rocks that have large pores and high permeability can expel excess water; when the exuded water freezes on the external surface, a large heating effect is evident in a single pulse, indicating the formation of a large amount of ice. On the other hand, rocks with low permeability cannot lower their water content to the desired level; ice for- matior?_ in the non-equilibrium state is not sudden but continuous, with little noticeable elevation of temper- ature.
CONCLUSION
A new mechanism of frost action can serve as a basis for improvement of current test methods for frost resistance and for the development of a simpler and more rapid new test.
ACKNOWLEDGEMENT
The excellent technical assistance of H. Schultz, R. Lacroix and R. Myers (fabrication of specimen) and E.C. Quinn (determination of air-void content) is gratefully acknowledged.
This paper is a contribution from the Division of Building Research, National Research Council of Canada, and is published with the approval of the Director of the Division.
APPENDIX
-
EXPERIMENTALPreparation of Samples TABLE A-1.
-
AIR CONTENT OF SPECIMENSAll samples were manufactured during a period of 14 days using the same type I cement, 1000 g in each batch and appropriately adjusting the amount of water according to the desired W/C ratio. For air-entraining a commercial product was used in the recommended proportion. Mixing was done accord- ing to ASTM standard C305. From each mix four prisms (1 by 1 by 12 in.) and two cylinders (1.25 by 6 in.) were manufactured in plastic (methyl metha- crylate) molds according to the method of Sereda and Swenson (6). The molds were rotated until setting had occurred, the low W/C pastes usually for 24 hours, the high W/C mixes for over two days. Following demolding, the samples were placed at once in poly- ethylene bags containing 10 ml water and sealed. They were cured for 14 months.
he
amount of air entrained in the samples with meeze-
Thaw Testhigh W/C ratio was far below the desired level (see
able
A-1). It is apparent, however, that the 'air The samples were removed from the bags, cut tocontent of the air entrained samples is still higher 11 114-in. length, drilled, fitted with gage studs,
than that of non-air entrained samples. which were glued with epoxy cement, and placed
Spacing Factor
-
0.012 0.035 0.00675 0.022 0.030 0.032 W/C Air Volume,Ratio Per Cent
0.4 plain 0.4 entrained 0.5 plain 0.5 entrained 0.6 entrained 0.7 plain
-
0.00 2.16 0,63 4.50 1.04 C.00 0.7 entrained 0.4 0.8 plain 0,OO 0.8 entrained 1.86in a fog-room for three days followed by storage in placed in a controlled temperature
( r
0.1 OC) and lime water. The automhtic freeze-thaw apparatus humidity (& 1%)
glove box. Relative humidity completed two cycles in 24 hours. The specimens of 80 per cent was maintained with an intermittently were tested for changes in fundamental transverse and stirred, saturated (NH4)2S04 solution and monitored longitudinal frequency (ASTM C 490) and in weight with an electric hygrometer. The rate of weight lossafter every cycle. was continuously and automatically recorded by
means of a vacuum electro balance in conjunction
Modified Freeze
-
Thaw Test with an X-Y recorder.Specimens were prepared as described for the standard test, then placed on a wire screen approxi- mately 0.5 in. above the bottom of a plastic container. The specimens were immersed in water at room temperature for 7 hours, drained and stored in the closed container. At the end of a 30-min draining period the closed container was placed in a cold room (- 18 OC) for 16.5 hours. The same parameters were measured as for the standard freeze-thaw test after 4 hours of soaking at room temperature and the prisms were replaced in the water immediately following the test.
Rate of Evaporation
Wafers 0.050 in. thick were cut from hydrated paste and stored in lime water for 14 days. Prior to testing they were wiped with paper tissues and
Determination of Water Adsorption Isotherm
The amount of water desorbed for a given and known decrease in relative humidity was determined by the so-called desiccator method. The samples were exposed to constant relative humidity maintained by a saturated solution of the appropriate salts. In some instances it took two months to achieve constant weight.
Determination of Air-Void Content in Hardened Cement Samples
Air content and the spacing factor of the air- entrained voids were determined by the linear traverse method according to the standard ASTM method C 457.
L'action du gel sur la plte de ciment. - L'auteur
itudie plus h fond une thiorie de ['action du gel imise auparavant et en discute les implications. La structure des pores, le degri de saturation, l'l~umiditi relative et la temperature sont des facteurs qui influencent la risis- tance au gel. La structure des pores est diterminie sur- tout par le rapport eau-ciment. O n a constark que [a vitesse de dessiccation pour des prites possidant d ~ f i r e n t s rapports eau-ciment itait semblable. Ainsi les prites fort poreuses requi6rent plus de temps pour se dessicher et sont susceptibles d'endommagement par le gel pour une plus Iongue piriode. On a trouvi que ['absence de dila-
tation liniaire risiduelle itait un indice valable de la resistance au gel, et que si sa valeur se maintenait a ziro p o w au moins 10 ri 15 cycles de gel et digel, aucun dommage n'en risultait. I1 est suggiri que le manque de conformiti entre les risultats obtenus utilisant divers appareils pour les essais de gel et de digel est dfi h l'in- sufJisance de contr6le de la teneur en humiditi des ichan- tillons soumis h l'essai. Les ditails de priparation doivent ttre pricisb davantage et les chambres de congilation concues de sorte que la dessiccation due ci la sublimation verb les serpentins de refroidissement
soit tninimisie.
REFERENCES
[I] LITVAN G.G. - J. Coll. Interface Sci., 38, 75, 1972. [6] SEREDA P.J. and SWENSON E.G. - Mats. Res. and Standards, 7, 152, 1967.
[2] LITVAN G.G. - J. Am. Ceram. Soc., 55, 38, 1972. [7] 1971 Annual Book of ASTM Standards, Part 10.
[3] POWERS T.C., Proc. ASTM, 55, 1132, 1955. American Society for Testing and Materials, Phila-
delphia, 1971. . .
[4] VALORE, R.C., JR. - ACI Journal, P~oc., 46, 417, [g] DUNN J.R. and HUDEC P.P. - Bureau of Physical
1969. Research, New York State Department of Public
[5] WILLS, M.H., JR., LEPPER H.A., JR., GAYNOR R.D. Works Report RR 65-5, September 1965, p. 138. and WALKER S. - Proc. ASTM, 63, 946, 1963. [9] CADY, P.D. - J. Mat. 4, 294, '1969.