HAL Id: hal-02415172
https://hal.archives-ouvertes.fr/hal-02415172
Submitted on 7 Jan 2021
HAL is a multi-disciplinary open access
archive for the deposit and dissemination of
sci-entific research documents, whether they are
pub-lished or not. The documents may come from
teaching and research institutions in France or
abroad, or from public or private research centers.
L’archive ouverte pluridisciplinaire HAL, est
destinée au dépôt et à la diffusion de documents
scientifiques de niveau recherche, publiés ou non,
émanant des établissements d’enseignement et de
recherche français ou étrangers, des laboratoires
publics ou privés.
What Thermal Analysis Can Tell Us About Melting of
Semicrystalline Polymers: Exploring the General
Validity of the Technique
Alexey Melnikov, Martin Rosenthal, Dimitri Ivanov
To cite this version:
Alexey Melnikov, Martin Rosenthal, Dimitri Ivanov. What Thermal Analysis Can Tell Us About
Melting of Semicrystalline Polymers: Exploring the General Validity of the Technique. ACS Macro
Letters, Washington, D.C : American Chemical Society, 2018, 7 (12), pp.1426-1431.
�10.1021/acs-macrolett.8b00754�. �hal-02415172�
What thermal analysis can tell us about melting of semicrystalline
polymers: exploring the general validity of the technique
Alexey P. Melnikov,
†,a,bMartin Rosenthal,
†,*,cand Dimitri A. Ivanov
*,a,b,da Lomonosov Moscow State University, Faculty of Fundamental Physical and Chemical Engineering, GSP-1, 1-51 Leninskie
Gory, Moscow, Russian Federation;
b Moscow Institute of Physics and Technology (State University), Institutskiy per. 9, Dolgoprudny, Russian Federation; c European Synchrotron Radiation Facility (ESRF), 6 rue Jules Horowitz, 38043 Grenoble, France
d Institut de Sciences de Matériaux de Mulhouse-IS2M, CNRS UMR 7361, Jean Starcky, 15, F-68057 Mulhouse, France.
KEYWORDS: semicrystalline morphology, ultrafast chip calorimetry, X-ray scattering, multiple melting, semirigid-chain polymers, poly(trimethylene terephthalate).
ABSTRACT: Thermal characterization of semicrystalline polymers can constitute a difficult task due to the metastable nature of
polymer crystals. It is well documented that polymer structure can reorganize during the thermoanalytical experiment. It has become also clear that thermal analysis alone cannot discriminate the reorganization processes from multiple melting events. Therefore, in-stead of studying the initial sample state the measurements may simply reflect the structural evolution uncontrollably occurring during the experiment. Here an original setup combining in-situ ultrafast chip calorimetry with millisecond time-resolved X-ray scattering is used to find the structural signature of the reorganization processes. The information is further used to construct the Heating-Rate
versus Crystallization-Temperature Reorganization (HR-CT-R) diagram. The diagram allows designing experiments in which one
can completely exclude uncontrolled evolution of the semicrystalline structure. For a typical aromatic polyester, poly(trimethylene terephthalate), the critical heating rate above which all reorganization processes cease to exist can reach 1,000K/s and more.
The thermal characterization of semicrystalline polymer ma-terials can constitute a difficult experimental task due to the metastable nature of the semicrystalline polymer structure.[1,2] For the classical lamellar systems, polymer structure is com-posed of several-nanometer-thick crystalline lamellae interwo-ven with amorphous regions of a comparable thickness. One of the main problems in performing thermal studies on such sys-tems is due to the fact that the semicrystalline structure can evolve in the course of the measurement. Therefore, instead of studying the initial sample state the experimental results may simply reflect the structural evolution uncontrollably occurring during the experiment. The problem has been recognized early on in studies of semirigid-chain semi-crystalline polymers such as poly(ethylene terephthalate), PET. The DSC heating traces of PET showed two and more melting peaks [3] that were inter-preted as a manifestation of a melting-reorganization process operating during the experiment. Accordingly, the authors of work [3] pointed out that “the high temperature peak is due to a recrystallization and melting process taking place while the ma-terial is being scanned. Hence the DSC peaks are not a direct reflection of the state of the material at room temperature prior to the scan.” In the following years, numerous studies of the thermal behavior of semirigid-chain polymers confirmed the
general character of the double- or even multiple-melting be-havior. Moreover, it was realized that “recrystallization is ob-served over the whole interval between Tc and Tm”.[2] Apart
from the works on PET [4-5], the complex DSC traces with multiple exothermic and endothermic peaks have been recorded on many other polymers such as poly(ether ether ketone), PEEK [6-9], poly(trimethylene terephthalate), PTT [10-11], etc. Since it was not always known if the structural reorganization takes place during the reported experiments, the results of these stud-ies remain ambiguous. It is therefore compulsory to rank the experimental conditions for example on a basis of a state dia-gram to appreciate if any structural reorganization operates dur-ing heatdur-ing. Clearly, only experiments completely excluddur-ing such reorganization can provide information relevant to the in-itial sample state. Such diagram can then serve as a practical guide for materials scientists to define the conditions of mean-ingful thermal measurements.
In the past, several diagrams have been proposed to reflect the changes of material’s state or structure in the course of iso-thermal annealings, as well as constant-rate heatings and cool-ings. They include Time-Temperature-Transformation (TTT)[12], Continuous Heating Transfor-mation (CHT), and Continuous Cooling Transformation (CCT) [13-14] diagrams
and Temperature vs. heating rate transformation diagram [15], which were put forward to analyze the thermosetting resins hardening, solidification of metals and alloys, etc. In the case of semicrystalline polymers the critical experimental parameter is the heating rate. On the other hand, the pace at which the struc-tural reorganization occurs for a given polymer at a given tem-perature is mainly dependent on the crystallization temtem-perature, Tc. Therefore, the diagram in question should allow evaluating
the critical heating rate for a chosen Tc. In the following, the
critical heating rate stands for the smallest heating rate at which the reorganization ceases to operate during heating up to the fi-nal melting region. A meaningful thermoafi-nalytical experiment has to be conducted at heating rates equal or higher than the critical heating rate corresponding to particular processing con-ditions. Hence, the discussed diagram should display the critical rate in the heating-rate versus crystallization-temperature coor-dinates, which makes it logical to be termed as Heating-Rate
versus Crystallization-Temperature Reorganization Diagram
(HR-CT-R).
The main problem in establishing such a diagram consists in the fact that the double- or multiple-melting patterns observed in the DSC traces of semicrystalline polymers require additional information for their interpretation. In this case, the calorimetry data alone is largely insufficient for such analysis. Moreover, in most instances the conventional calorimetry cannot provide the heating rates high enough to bypass the reorganization. This makes the use of the MEMS-based calorimetry, or nanocalo-rimetry [16], practically compulsory. Recently, we designed and tested an experimental setup combining in-situ ultrafast chip calorimetry and microfocus X-ray scattering.[17-20] Such real-time combination became possible thanks to the advent of a new-generation single-photon-counting fast X-ray detectors, which allowed to significantly accelerate this notoriously slow technique. We showed that the double-melting pattern per se does not yet mean that the reorganization occurs.[21] The
dou-ble-melting behavior can be in many instances just a manifesta-tion of the complex thermodynamics of polymer crystals that strongly interact with the neighboring amorphous regions.[22-23] This can cause for example a significant depression of their melting transition temperatures due to the negative pressure ef-fects.[24-25]
In the present work, the HR-CT-R diagram will be estab-lished for a typical semirigid-chain semicrystalline polymer, PTT, the complex supramolecular organization of which has been recently addressed.[26-28]. The scheme of the experi-mental setup combining ultrafast chip calorimetry and millisec-ond-time-resolved X-ray scattering is shown in Figure 1.
Figure 1. Schematics of the combined ultrafast chip calorimetry /
micro-focus X-ray scattering setup installed at the ID13 microfocus beamline of ESRF. The incident X-ray beam is focused on the ac-tive region of the nanocalorimetric sensor down to the size of 14 x 17 µm2.
The setup was designed and installed at the micro-focus branch (EH3) of the ID13 beamline (ESRF, Grenoble). A cus-tom-made modular nanocalorimeter sensor holder (cf. Figure 1) was positioned in the beam using sample translation stage al-lowing controlled and independent motion along X, Y and Z-axes with a step of less than 0.5 µm. Further experimental de-tails can be found in our previous publications [17-20] and SI.
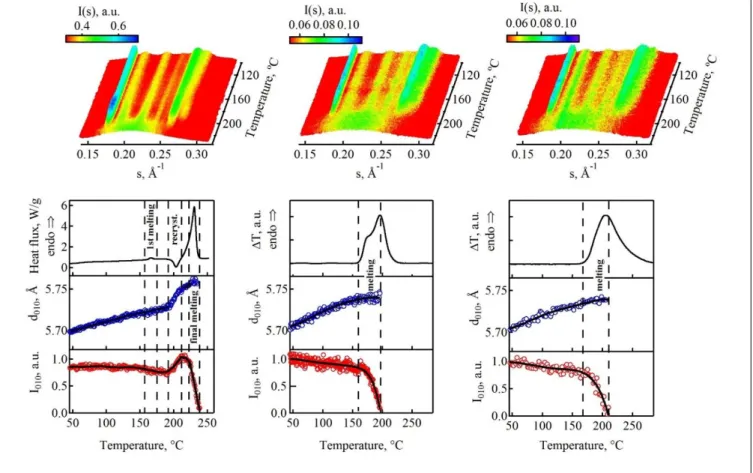
Figure 2. Top row: Temperature-dependent WAXS profiles corresponding to heating ramps of a PTT sample preliminarily
melt-crystal-lized for 15 minutes at 150°C. The sample was scanned at heating rates of 1.0°C/s (left column), 500°C/s (middle column) and 1400°C/s (right column). The corresponding intensity and d-spacing of 010 peak, as well as heat flux is given in the bottom rows.
Figure 2 displays variable-temperature WAXS data together with the corresponding DSC and nanocalorimetric traces rec-orded during heating ramps at different heating rate. Im-portantly, all the experiments have been carried out on the sam-ples isothermally melt-crystallized at 150°C. The heating rates applied in the experiments increase from the left to right side of the figure. It can be seen that the recorded calorimetric curves crucially depend on the heating rate applied, which means that the experimentalist in this case is challenged to choose the con-ditions to acquire meaningful thermal data.
It is noteworthy that during the experiments with slow heat-ing (i.e. at 1.0°C/s), the nanocalorimeter was operated in a tem-perature-modulation mode with a small temperature amplitude. For the sake of comparison, the graph displays an ex-situ meas-urement performed at the same rate on a power-compensated Perkin-Elmer DSC 8000 device. The DSC heating curve shown in the left column of the figure reveals low-temperature melting event followed by an exothermic recrystallization and final melting peak. The central and right columns contain in-situ nanocalorimetric data. The heating rates used in these columns are clearly beyond the reach of any classical DSC instrument and, therefore, required employment of a custom-built in-situ nanocalorimeter.[17]
The time- and temperature-resolved WAXS profiles shown in the top row of Figure 2 reveal a difference in the behavior of
the strongest 010 peak of PTT located at 0.175 Å-1. Thus, for
the slowest heating ramp (cf. the top left panel of the figure) the intensity of the peak abruptly increases at ca. 200°C, i.e. just before entering the final melting region. The temperature inter-val corresponding to this increase coincides with the recrystal-lization peak visible in the corresponding DSC trace. To better appreciate the behavior of the 010 peak, the temperature de-pendence of its intensity and d-spacing (d010) is displayed in the
two bottom rows of the figure. It can be seen that the reorgani-zation event observable in the DSC trace coincides with the in-crease of the intensity and the corresponding d-spacing of the 010 peak. It is clear that these features reflect the formation of a new population of crystals stable at higher temperatures and each them can constitute the structural signature of a reorgani-zation process.
The presence of reorganization during heating at 1.0°C/s means that for Tc of 150°C this heating rate is below the critical
heating rate. In contrast, fast heating at 500°C/s and 1400°C/s do not exhibit signs of reorganization. For example, at these heating rates the temperature evolution of d010 follows an
oppo-site trend, i.e. the d010 values display normal thermal expansion
followed by leveling off in the melting region. Importantly, for a heating rate of 500°C/s the nanocalorimetric trace reveals a complex shape typical of the classical double-melting behavior. The low-temperature melting peak is in this case visible as a shoulder of the main endotherm. Since there is no reorganiza-tion taking place at this heating rate, one can safely conclude
that the complex shape of the melting peak such as the presence of two melting peaks does not necessarily imply structural re-organization. This confirms the general conclusions of our pre-vious publications.[17,19,21] It is noteworthy that for the heat-ing rate of 1400°C/s the shape of the meltheat-ing peak remains rem-iniscent of the double melting, i.e. asymmetric, but more smeared in comparison with the one at 500°C/s. This can be explained by convolution of the thermal signal with the time-response function of the nanocalorimetric sensor, which be-comes more noticeable at higher heating rates.
Figure 3 displays the 1D SAXS curves (left column) meas-ured during the in-situ experiments displayed in Figure 2. The corresponding 1D auto-correlation functions (CFs) are shown in the right column of the figure. The curves correspond to room temperature, onset of melting and a temperature near the maxi-mum of the main melting peak. One can appreciate the shift of the main SAXS interference maximum to lower s-values with temperature, which reveals the changes occurring in the mor-phological parameters on heating.
Figure 3. Selected SAXS curves (left) measured during the same
experiments as in Figure 2. The applied heating rates are 1.0°C/s (top), 500°C/s (middle) and 1400°C/s (bottom). The corresponding normalized 1D CFs are displayed in the right column of the figure.
The structural evolution can be further characterized with the help of the SAXS CFs. One can see that in the self-correlation triangle the CFs corresponding to the two fast heating rates be-have similarly, whereas this is at variance for the slowest heat-ing rate. The slopes of the CFs in the self-correlation triangle are in direct relationship to the smallest of the two SAXS dis-tances, i.e. either crystal or amorphous layer thicknesses. Since PTT is a low-crystallinity polymer, the smallest SAXS distance is pertinent to crystal thickness. Therefore, the crystals remain invariable in thickness over the whole temperature range at heating rates of 500 and 1400°C/s. By contrast, crystal thick-ness increases with temperature for the heating rate of 1.0°C/s, which confirms that reorganization is indeed taking place in this case.
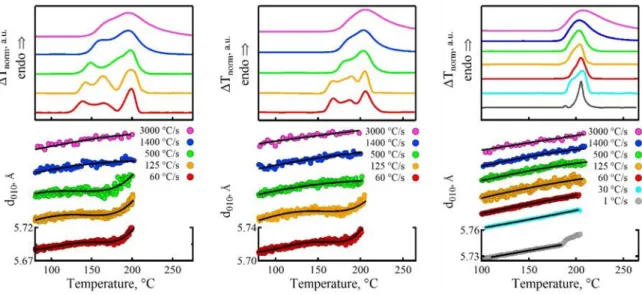
To find out the critical heating rates corresponding to other Tc’s some additional experiments have been carried out. Figure
4 displays the in-situ nanocalorimetric curves measured for PTT melt-crystallized at 120, 150 and 180°C. In these experiments, heating rates of 1, 30, 60, 125, 500, 1400 and 3000°C/s were applied. The bottom panels of the figure show the d010 values
for each of the heating rates. For the sake of clarity, all nanocal-orimetric curves and d-spacings are offset vertically with the respect to the curves measured at the lowest heating rate. To sort out the ramps for which the reorganization took place one can use the criterion of a rapid increase of d010. This feature is
present in three slowest heating ramps for the left column and two slowest ramps of the middle column. Finally, only the slow-est ramp displayed in the right column reveals the structural sig-nature of reorganization. Interestingly, the cases where the re-organization did not happen correspond to the nanocalorimetric curves with just double melting. This holds for the curves for Tc
of 180°C in which the two melting peaks are located close to each other. In contrast, the cases with reorganization correspond to the nanocalorimetric curves revealing a pattern, which is more complex than just usual double melting. However, since none of the nanocalorimetric curves exhibits an exothermic event on heating, it would be anyhow problematic to identify the runs during which the reorganization did occur in the ab-sence of the complementary in-situ X-ray data.
Figure 4. Nanocalorimetric curves (top panels) measured during heating of PTT samples isothermally melt-crystallized at 120 (left), 150
(middle) and 180°C (right) at different heating rates. The corresponding temperature dependencies of d010 are displayed in the bottom panels. For the sake of clarity, the nanocalorimetric curves and d-spacing dependencies are offset vertically with the respect to the curves measured at the lowest heating rate. For the sake of comparison, the calorimetric curve at 1.0°C/s was measured ex situ on a power-compensated Perkin-Elmer DSC 8000.
All the obtained data can be now merged on the HR-CT-R diagram shown in Figure 5. The filled and empty symbols mark the zones of the diagram where the reorganization is present and absent, respectively. The border between the zones is empha-sized with a solid line, which constitutes the Tc-dependence of
the critical heating rate. It can be seen that the latter signifi-cantly decreases with Tc, which can be explained by the fact that
the reorganization rate significantly slows down when ap-proaching the final melting. Eventually, at the highest Tc’s the
reorganization will not happen even at conventional-DSC heat-ing rates. The proposed HR-CT-R diagram can be also estab-lished for any other semicrystalline polymer to be used as a guide in choosing proper conditions of thermal analysis experi-ments.
Figure 5. HR-CT-R diagram for isothermally melt-crystallized
PTT. The border between the zones where the reorganization is pre-sent and abpre-sent corresponds to the critical heating rate.
In conclusion, based on a new technology of simultaneous millisecond time-resolved micro-focus X-ray scattering and ul-tra-fast chip scanning calorimetry we put forward a Heating-Rate versus Crystallization-Temperature Reorganization Dia-gram. The main motivation of this work stems from the fact that the semicrystalline polymer structure can rapidly reorganize on heating. This drastically affects the measurable thermodynamic properties as they vary in the course of the run. The experimen-talist would completely exclude such sample reorganization
during the measurement but calorimetry alone cannot always discriminate the processes of reorganization from multiple melting. In contrast, the described on-time structural and ther-mal measurements using a MEMS-based platform make it pos-sible to detect the processes of reorganization and identify their signature. The proposed HR-CT-R diagram can be established for any semicrystalline polymer in order to help designing ther-mal analysis experiments in which the one can rule out any un-controlled evolution of the semicrystalline structure.
ASSOCIATED CONTENT
The Supporting Information is available free of charge on the ACS Publications website at DOI: .
Materials, instrumentation, data reduction and analysis (PDF).
AUTHOR INFORMATION
†Authors equally contributed to this work
Corresponding Author
* Dimitri A. Ivanov: dimitri.ivanov@uha.fr
* Martin Rosenthal:martin.rosenthal@esrf.fr
ORCID
Alexey P. Melnikov: 0000-0003-2277-9644 Martin Rosenthal: 0000-0001-6014-6050 Dimitri A. Ivanov: 0000-0002-5905-2652
Notes
The authors declare no competing financial interest
ACKNOWLEDGMENT
The author greatly thanks the Ministry of education and science of the Russian Federation (contract # 14.616.21.0072 from 28 July 2016 (RFMEFI61616X0072)) for financial support. The authors acknowledge excellent technical support provided by D. Hermida at the BM26B beamline of ESRF (Grenoble).
SAXS, Small-angle X-ray scattering; WAXS, Wide-angle X-ray scattering, DSC, Differential scanning calorimetry.
REFERENCES
(1) Strobl, G. The Physics of Polymers: Concepts for Understanding Their Structures and Behavior. Springer-Verlag Berlin Heidelberg, 2007. DOI: doi.org/10.1007/978-3-540-68411-4.
(2) D. A. Ivanov, "1.11 Crystalline polymers" in: Comprehensive Polymer Science Encyclopedia, Edt. By F. Kremer, A. Khokhlov and M. Moeller. Elsevier. 2012 ISBN: 9780444533494.
(3) Holdsworth, P.J.; Turner-Jones, A. The melting behaviour of heat crystallized poly(ethylene terephthalate). Polymer 1971, 12, 195-208.
(4) Groeninckx, G.; Reynaers, H. Morphology and melting behavior of semicrystalline poly(ethylene terephthalate). II. Annealed PET.
Journal of Polymer Science Part B: Polymer Physics 1980, 18(6),
1325-1341.
(5) Yagfarov, M.Sh.; Mitrofanova, E.P. Recrystallization and sec-ondary crystallization in polymers. Polymer Science USSR 1986, 28(5), 1011-1017.
(6) Bassett, D.C.; Olley, R.H.; Al Raheil, I.A.M. On Crystallization Phenomena in PEEK. Polymer 1988, 29, 1745-1754.
(7) Lee, Y.; Porter, R.S. Double-melting behavior of poly(ether ether ketone). Macromolecules 1987, 20, 1336–1341.
(8) Ivanov, D.A.; Jonas, A.M. Isothermal growth and reorganization upon heating of a single poly(aryl-ether-ether-ketone) (PEEK) spheru-lite, as imaged by atomic force microscopy". Macromolecules 1998,
31, 4546-4550.
(9) Ivanov, D.A.; Jonas, A.M.; Legras, R. The crystallization of poly(aryl-ether-ether-ketone) (PEEK). Reorganization processes dur-ing gradual reheatdur-ing of cold-crystallized samples. Polymer 2000, 41 3719-3727.
(10) Huang, J.-M.; Ju, M.-Y.; Chu, P.P.; Chang, F.-C. Crystalliza-tion and melting behaviors of poly(trimethylene terephthalate). Journ.
Polym. Res. 1999, 6(4), 259–266.
(11) Srimoaon, P.; Dangseeyun, N.; Supaphol, P. Multiple melting behavior in isothermally crystallized poly(trimethylene terephthalate).
Eur. Polym. J. 2004, 40, 599–608.
(12) Chan, L.C.; Nae, H.N.; Gillham, J.K. Time-Temperature-Transformation (TTT) Diagrams of High Tg Epoxy Systems: Compe-tition Between Cure and Thermal Degradation. Journ. Appl. Polym.
Sci. 1984, 29, 33074327.
(13) Wisanrakkit, G.; Gillham, J.K. Continuous Heating Transfor-mation (CHT) Cure Diagram of an Aromatic Amine/ Epoxy System at Constant Heating Rates. Journal of Applied Polymer Science 1991, 42, 2453-2463.
(14) Nürnberger, F.; Grydin, O.; Schaper, M.; Bach, F.-W.; Koczur-kiewicz, B.; Milenin, A. Microstructure Transformations in Tempering Steels during Continuous Cooling from Hot Forging Temperatures.
Steel Research Int. 2010, 81(3), 224-233.
(15) Lu, K.; Lück, R.; Predel, B. Temperature vs. heating rate trans-formation diagram for a transition from the amorphous to the nanocrys-talline state. Journal of Alloys and Compounds 1993, 201, 229-234.
(16) Lai, S.L.; Ramanath, G.; Allen, L.H. High‐speed (104 °C/s)
scanning microcalorimetry with monolayer sensitivity (J/m2). Appl.
Phys. Lett. 1995, 67, 1229-1231.
(17) "Design of an in-situ setup combining nanocalorimetry and nano- or micro-focus X-ray scattering to address fast structure for-mation processes" M. Rosenthal, A.P. Melnikov, A.A. Rychkov, D. Doblas, D.V. Anokhin, M. Burghammer, and D.A. Ivanov. In: Fast Scanning Calorimetry edt. by C. Schick and V. Mathot, Springer Inter-national Publishing, Switzerland 2016, ISBN 978-3-319-31327-6.
(18) Rosenthal, M.; Doblas, D.; Hernandez, J.J.; Odarchenko, Ya.I.; Burghammer, M.; Di Cola, E.; Spitzer, D.; Antipov, A.E.; Aldoshin, L.S.; D.A. Ivanov. High-Resolution Thermal Imaging with a Combi-nation of Nano-Focus X-ray Diffraction and Ultra-Fast Chip Calorim-etry. Journal of Synchrotron Radiation 2014, 21, 223-228.
(19) Melnikov, A.P.; Rosenthal, M.; Rodygin, A.I.; Doblas, D.; Anokhin, D.V.; Burghammer, M.; Ivanov, D.A. Re-exploring the dou-ble-melting behavior of semirigid-chain polymers with an in-situ com-bination of synchrotron nano-focus X-ray scattering and nanocalorim-etry. Eur. Polym. J. 2016, 81, 598-606.
(20) Riekel, C.; Di Cola, E.; Burghammer, M.; Reynolds, M.; Rosen-thal, M.; Doblas, D.; Ivanov, D.A. Thermal Transformations of Self-Assembled Gold Glyconanoparticles Probed by Combined Nanocalo-rimetry and X‑ray Nanobeam Scattering. Langmuir 2015, 31, 529–534.
(21) Rosenthal, M.; Melnikov, A.P.; Burghammer, M.; Ivanov, D.A. Reorganization of semicrystalline polymers on heating: analyzing com-mon misconceptions in the interpretation of calorimetric data. Re-sponse on the “Comment on “Re-exploring the double-melting behav-ior of semirigid-chain polymers with an in-situ combination of syn-chrotron nanofocus X-ray scattering and nanocalorimetry” by Dimitri A. Ivanov et al. [European Polymer Journal 81 (2016) 598–606.]”. Eur.
Polym. J. 2017, 94, 517-523.
(22) G. Vigier, J. Tatibouet, A. Benatmane, R. Vassoille, Amor-phous phase evolution during crystallization of poly(ethylene-tereph-thalate), Colloid and Polym. Sci. 1992, 270(12), 1182-1187.
(23) Ivanov, D.A.; Legras, R.; Jonas, A.M. The crystallization of poly(aryl-ether-ether-ketone) (PEEK). Interdependence between the evolution of amorphous and crystalline regions during isothermal cold-crystallization, Macromolecules 1999, 32, 1582-1592.
(24) Ivanov D.A., Hocquet S., Dosiére M., Koch M.H.J. Exploring the melting of a semirigid-chain polymer with temperature-resolved small-angle X-ray scattering. Eur. Phys. J. E. 2004, 13, 363-378.
(25) Ivanov, D.A.; Bar, G.; Dosière, M.; Koch, M.H.J. A Novel View on Crystallization and Melting of Semirigid Chain Polymers: The Case of Poly(trimethylene terephthalate). Macromolecules 2008, 41, 9224-9231.
(26) Rosenthal, M.; Portale, G.; Burghammer, M.; Bar, G.; Samul-ski, E.T.; Ivanov, D.A. Exploring the origin of crystalline lamella twist in semi-rigid chain polymers: the model of Keith and Padden revisited.
Macromolecules 2012, 45(18), 7454-7460.
(27) Rosenthal, M.; Burghammer, M.; Bar, G.; Samulski, E.T.; Ivanov, D.A. Switching Chirality of Hybrid Left–Right Crystalline Helicoids Built of Achiral Polymer Chains: When Right to Left Be-comes Left to Right. Macromolecules 2014, 47(23), 8295–8304.
(28) Rosenthal M.; Ivanov D.A. Microstructure of Banded Polymer Spherulites: New Insights from Synchrotron Nanofocus X-Ray Scat-tering. Adv. Polym. Sci. 2017, 277, 95-126.
7
What thermal analysis can tell us about melting of semicrystalline
polymers: exploring the general validity of the techniqueThermal
Analysis of Semicrystalline Polymers: Exploring the General
Valid-ity of the Technique
Alexey P. Melnikov,
†,a,bMartin Rosenthal,
†,*,cand Dimitri A. Ivanov
*,a,b,da Lomonosov Moscow State University, Faculty of Fundamental Physical and Chemical Engineering, GSP-1, 1-51 Leninskie
Gory, Moscow, Russian Federation;
b Moscow Institute of Physics and Technology (State University), Institutskiy per. 9, Dolgoprudny, Russian Federation; c European Synchrotron Radiation Facility (ESRF), 6 rue Jules Horowitz, 38043 Grenoble, France