Comparison of Natural Language Processing
Algorithms for Medical Texts
by
Michelle W. Chen
S.B., Massachusetts Institute of Technology (2014)
Submitted to the Department of Electrical Engineering and Computer
Science
in partial fulfillment of the requirements for the degree of
Master of Engineering in Electrical Engineering and Computer Science
at the
MASSACHUSETTS INSTITUTE OF TECHNOLOGY
June 2015
c
○ Massachusetts Institute of Technology 2015. All rights reserved.
Author . . . .
Department of Electrical Engineering and Computer Science
May 21, 2015
Certified by . . . .
Peter Szolovits
Professor of Electrical Engineering and Computer Science
Thesis Supervisor
Accepted by . . . .
Albert R. Meyer
Chairman, Masters of Engineering Thesis Committee
Comparison of Natural Language Processing Algorithms for
Medical Texts
by
Michelle W. Chen
Submitted to the Department of Electrical Engineering and Computer Science on May 21, 2015, in partial fulfillment of the
requirements for the degree of
Master of Engineering in Electrical Engineering and Computer Science
Abstract
With the large corpora of clinical texts, natural language processing (NLP) is growing to be a field that people are exploring to extract useful patient information. NLP applications in clinical medicine are especially important in domains where the clin-ical observations are crucial to define and diagnose the disease. There are a variety of different systems that attempt to match words and word phrases to medical ter-minologies. Because of the differences in annotation datasets and lack of common conventions, many of the systems yield conflicting results. The purpose of this thesis project is (1) to create a visual representation of how different concepts compare to each other when using various annotators and (2) to improve upon the NLP methods to yield terms with better fidelity to what the clinicians are trying to express.
Thesis Supervisor: Peter Szolovits
Acknowledgments
I would like to thank my advisor, Pete Szolovits, for his contributions and support throughout the development of this project. I appreciate all of the helpful insights and will miss the stories discussed during our weekly meetings.
I would like to thank the people in the Clinical Decision Making Group (Yuan, Marzyeh and Tristan) for encouraging me and welcoming me into their various dis-cussions.
I would like to thank the cTAKES community who helped me, including Pei Chen, Sean Finan and Timothy Miller, Ph.D.
Thank you to my friends who have been here for me. I appreciate the time that we have spent together in Taekwondo, running and life in general. I have been able to participate in so many random spontaneous activities these past few years including thesis writing parties. I could not have done it without you guys.
Lastly, I would like to thank my family for their support. My parents, Margaret and Peter, have been with me for every step of the journey. They have supported me through all my decisions. They have taught me how to laugh and love life. I would also like to thank my brother, Michael, who always advocates for me.
I have been honored and blessed to be able to study here at MIT and will always cherish the memories from these past few years.
Contents
1 Introduction 13
1.1 Problem . . . 13
1.2 Existing Software . . . 13
1.3 Background . . . 14
1.3.1 Unified Medical Language System○R . . . . 14
1.3.2 UMLSBase . . . 14
1.3.3 MetaMap . . . 15
1.3.4 Apache cTAKESTM . . . 15
1.3.5 Numerics . . . 15
1.3.6 William J. Long’s Parser . . . 15
1.3.7 Other methods . . . 16
1.3.8 Terminologies . . . 17
1.3.9 Comparison of semantic types . . . 18
1.4 Goals . . . 19 2 System Overview 21 2.1 Overall Design . . . 21 2.2 Visual Representation . . . 21 2.2.1 Features . . . 22 2.2.2 Components . . . 23
2.3 Batch Processing Overview . . . 27
2.3.1 Pipeline . . . 27
2.4 Components . . . 29 2.4.1 Input Selection . . . 29 2.4.2 Processing . . . 30 2.4.3 Output Format . . . 30 2.5 Implementation of ThesMap . . . 31 2.5.1 Overall Implementation . . . 31 2.5.2 Database . . . 33
3 Results and Analysis 35 3.1 Texts Processed . . . 35
3.2 Analysis of the System . . . 35
3.2.1 Effectiveness of the GUI . . . 35
3.2.2 Computation Time . . . 36
3.2.3 Annotator Comparison . . . 40
3.2.4 Subset of Semantic Types . . . 41
4 Applications 45 4.1 Autism Spectrum Disorder . . . 45
4.2 Other Potential Applications . . . 45
5 Conclusion 47 5.1 Future Work . . . 47
5.1.1 Overall Design Improvements . . . 47
5.1.2 GUI Improvements . . . 49
5.1.3 Batch Improvements . . . 50
5.1.4 Testing . . . 51
5.2 Summary . . . 52
List of Figures
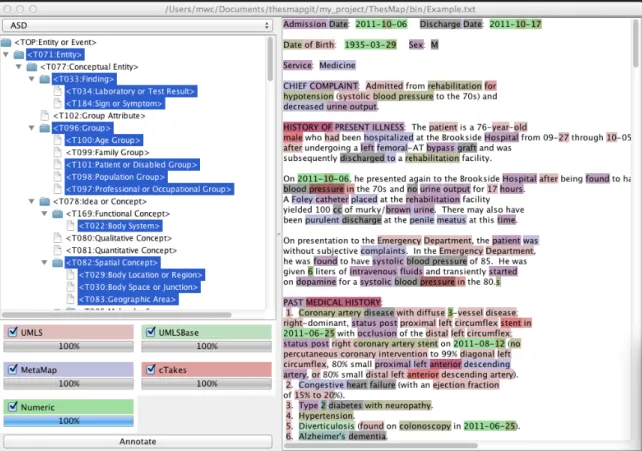
2-1 Main GUI Window. This window contains 4 main components: 1. TUI subgroupings selection (top left), 2. TUI selection (middle left), 3. annotator selection (bottom left) and 4. input for free-form text
(right). . . 24
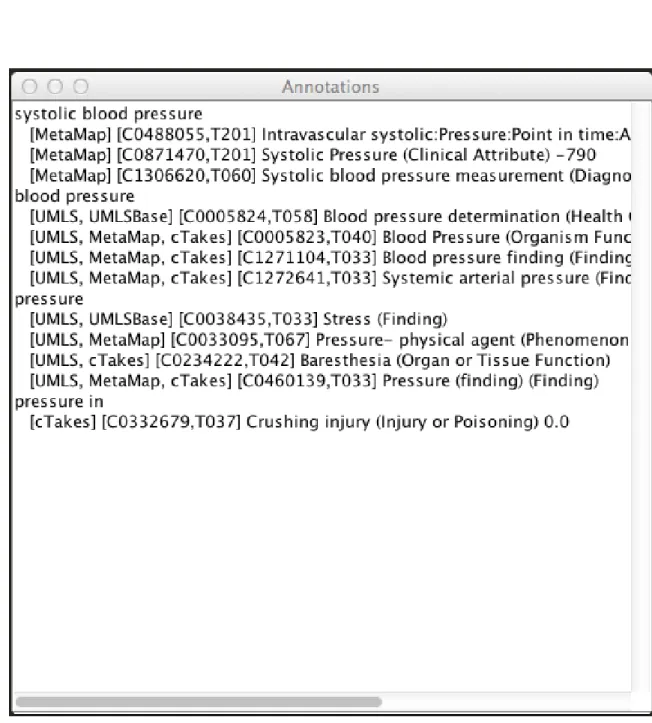
2-2 Annotations Window. . . 26
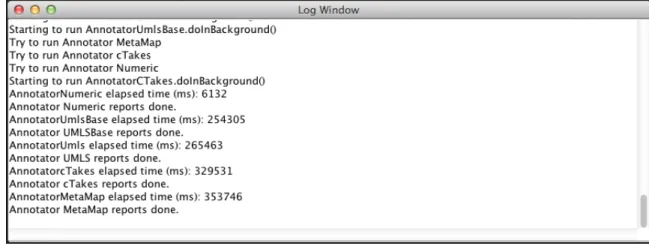
2-3 Log Window. . . 27
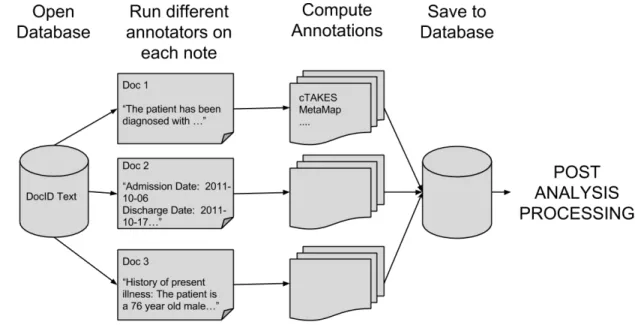
2-4 Batch processing pipeline overview. . . 28
2-5 Batch Processing Window. (Left: Browse by Directory for Input. Right: Use text from database for input.) . . . 30
3-1 Graph comparing annotators over the course of multiple runs in the same instance of running the GUI version. . . 38
3-2 Venn Diagram comparing how the different annotators match up by running on five text files from the MIMIC II table noteevents. Each entry in the Venn Diagram detail the number of annotations that were in the particular intersection. . . 39
3-3 Comparison of results for all 3869 annotations regardless of annota-tion done by one or more annotators. This was run over a subset of annotations by running on 5 text files from MIMIC II. . . 42
List of Tables
2.1 Description of the columns in the annotations table in the database. 33
3.1 Average Time needed to run annotators when all annotators are run-ning. Average is calculated by running over the example note on five separate occasions. This note contains 353 lines of text, which is about fifteen thousand characters and 2,250 words. . . 37 3.2 Comparison of annotations by running on 5 text files from MIMIC II 38 3.3 Comparison of a subset of annotations by running on 5 text files from
MIMIC II. Note: This table differs from 3.2 in which a smaller subset of TUIs was chosen. . . 43
Chapter 1
Introduction
1.1
Problem
In the realm of Natural Language Processing (NLP) algorithms, there are currently quite a few limitations in the application to clinical texts. Some of the challenges in-clude the lack of access to shared data, lack of annotated datasets, lack of user centered development, and insufficient common conventions and standards for annotations [3]. One of the key problems that is explored in my research is the insufficient mapping of annotations across different applications. Generally, the annotated datasets are unique to the community that generated the information. As explored by Chapman et al., these barriers cause the development to be slow, thus preventing the application of NLP in clinical texts to be beneficial to end users.
1.2
Existing Software
Prior to starting my work, Professor Szolovits had started working on creating a Java Graphical User Interface (GUI) version to compare a few different NLP algorithms. For my work, I built on this work and expanded the interface to better accommodate various annotators. The system known as Thesaurus Map (ThesMap) is designed to compare the annotators.
1.3
Background
To better understand the problem, I will begin by discussing the various types of NLP annotators that are typically used for medical texts and were utilized in ThesMap. Terminologies will then be described in detail.
1.3.1
Unified Medical Language System
○RUnified Medical Language System○R(UMLS) is a system dedicated to integrating dif-ferent key terminologies, classifications and coding standards with a few difdif-ferent com-ponents such as the Metathesaurus [7]. The Metathesaurus is a vocabulary database with information regarding biomedical and health related concepts. This database is organized by concepts or meanings to link alternative names. Most NLP applica-tions to clinical texts build upon this multi-lingual vocabulary database to find key concepts. Within ThesMap, most of the annotators leverage the Lexical Variant Gen-eration (LVG) tools to standardize the spelling and inflection among various other aspects.
The usage of UMLS is mainly to find alternative names for concepts and map them to a single concept. Continuing forwards, UMLS will be referenced as the annotator that is created based on using the tools within UMLS rather than the entire system. The 2014ab version of UMLS was used for this version of the annotator.
1.3.2
UMLSBase
UMLSBase is an annotator that searches through a subset of the terminology from the UMLS 2014ab’s version of Metathesaurus. This subset of UMLS, also known as the Clinical Observations Recording and Encoding (CORE) Problem Subset of SNOMED CT ○R, provides a more tailored version of terminology that is relevant to clinical care. CORE Problem List Subset is derived from the consolidation of datasets from seven different medical institutions in order to establish SNOMED CT as the main coding terminology [14].
1.3.3
MetaMap
MetaMap is a configurable program created by the National Library of Medicine (NLM) [1, 2] to map the biomedical text to the UMLS 2013aa terminology found in the Metathesaurus. After normalizing key terminology, this program finds the corresponding unique UMLS Concept Unique Identifier (CUI) [15].
1.3.4
Apache cTAKES
TMApache clinical Text Analysis and Knowledge Extraction System (cTAKESTM) is a natural language processing system designed to take clinical texts and extract clin-ically named entities from various dictionaries such as UMLS. The clinical pipeline is designed to be customized for different purposes such as inclusion of medication, smoking or other components. Originally developed with the Mayo Clinic, cTAKES has received more traction in being used to understand clinical texts especially after its adoption as a top level project by the Apache Software Foundation. In 2013, cTAKES received the award for the highest number of citations that contributed to the Journal of the American Medical Informatics Association [5].
1.3.5
Numerics
The Numerics matcher, coded by Peter Szolovits, utilizes an algorithm that matches for dates, time, phone and other potential numerical aspects in the clinical text using regular expressions. Because this algorithm only matches for numerical patterns, it does not require extra resources such as UMLS and allows for a quick scan of the text document.
1.3.6
William J. Long’s Parser
Dr. William Long created a LISP-based parser that analyzes the text by running the text on a server that is accessed by a URL. The parser is based on a specialized dictionary that focuses on identifying the concepts that are most useful by using
a select subset of the UMLS 2014ab concepts, which include diagnoses, laboratory measurements, signs and symptoms, procedures and medications.
1.3.7
Other methods
Negation
An important task in natural language analysis of clinical text is determining that a concept is negated (e.g., "The patient did not have a heart attack"), that its status is uncertain, or that it applies to someone other than the patient, such as a family member. Many systems, including cTAKES, Long’s parser and MetaMap, use a variation on the NegEx algorithm [4]. Other researchers have explored alternative approaches such as dependency based negation using syntactic context [13] rather than the regular expression pattern matching used in NegEx.
Entity Relationships
In additional to methods of identifying negation concepts, people have also developed tools to identify relationships among concepts. As explored by Sibanda, there are various ways that concepts can relate to each other such as relationships between diseases and treatments, between diseases and tests, and between symptoms and treatments [11]. cTAKES and Long’s version both have implementations that find the relationships by identifying how certain entities relate in the context of the text.
Combined Systems
Other people have attempted similar programs of combining certain algorithms, such as putting together MetaMap and cTAKES to yield better results [15]. Xia et al. cre-ated a system that performed better than the annotators running independently. Their pipeline first runs MetaMap, which yields higher precision, and then runs cTAKES, which has higher recall. However, there is no simple method of compar-ing the similarities and differences from the annotations that result from Xia et al.’s improved system. The system did yield better results in terms of annotations, but
it was difficult to determine what terms are exact matches and how to modify the system.
1.3.8
Terminologies
For more background, I have provided a brief list of terminology used by the United States National Library of Medicine [7].
Unified Medical Language System (UMLS)○R – A compilation of files and software to create standards and unified vocabularies with three main sources of the Metathesaurus, Semantic Network and SPECIALIST Lexicon and Lexical Tools.
Atom – The smallest unit of naming in a source.
Concept – A term that represents one meaning and contains information about any other method of expressing that meaning, whether formal or casual, verbose or abbreviated. All of the atoms within a concept are synonymous. Each concept is assigned at least one semantic type.
Concept Unique Identifier (CUI) – A unique method of describing a con-cept that has a single meaning in the Metathesaurus.
Concept Name – A string chosen to represent the concept as a whole.
Concept View – A specific subset of the Metathesaurus that includes entities that are identified as being useful for a particular purpose. An example is the NLP Content View that determines which terms would be useful for NLP analysis.
International Classification of Disease Tenth Revision (ICD-10) – A system created and maintained by the World Health Organization to promote international standard in processing, classifying and presenting infor-mation regarding diseases, symptoms and injuries [6].
Lexical Variant Generation (LVG) – A lexical tool within UMLS designed to combine lexical transformations to text such as punctuation or determining word order in multiple-word terms. The commands within LVG are commonly utilized by various annotator pipelines such as cTAKES and MetaMap [8].
Metathesaurus – One of the three UMLS Knowledge Sources that consists of vocabularies, code sets and standards such as ICD-10, MeSH○R and SNOMED CT.
Semantic Network – One of the three UMLS Knowledge Sources that consists of the broad categories (semantic types) and relationships (semantic relations).
SNOMED CT○R(Systematized Nomenclature of Medicine – Clin-ical Terms) – A comprehensive clinClin-ical terminology maintained by the Inter-national Health Terminology Standards Development Organization (IHTSDO), which is used in the electronic exchange of clinical health information [12].
Type Unique Identifier(TUI) – A description of the specific semantic type that the concept belongs in, which are divided into entity and event con-cepts. Some examples include "T184" = "Sign or Symptom" or "T059" = "Laboratory Procedure".
1.3.9
Comparison of semantic types
UMLS integrates over three million biomedical concepts that can be characterized into 133 semantic types. Based on the work by McCray et al. [9], these semantic types (characterized by TUIs) can be reduced into a set of 15 subgroupings, which allow for a coarser grain subset. The subgroups allows for a reduction in conceptual complexity and allows for each concept to be properly partitioned. In theory, the system should extract entities corresponding to certain semantic types to ensure that only the semantic types of interest should be kept.
As a result of this previous work, I was interested in exploring how changing the subset of TUIs changes the overlapping annotations. My work explores how using the
subgroups proposed by McCray et al. and my own customized subsets for particular data sets changes the annotations or the overlap in annotations.
1.4
Goals
There are two main goals:
1. Create a system that easily compares the different annotations of medical notes when using various NLP algorithms.
2. Analyze the annotations to determine which combination of NLP annotators results in the most relevant set for the medical notes.
Chapter 2
System Overview
2.1
Overall Design
ThesMap is a system designed to read through clinical notes and to apply various different annotators to the text. After applying the annotators, the results will be visually displayed to show the differences in annotations or (in a batch mode) stored in a database for subsequent analysis.
ThesMap consists of two main components:
1. Graphical User Interface (GUI): A visual representation to show how the anno-tations from different NLP algorithms compare to each other.
2. Batch Processing Window: A pipeline that takes multiple files from a directory or remote database, processes the text, and then stores the annotations in a separate database.
The high level overview of the system in use will be described before the description about the implementation of the system.
2.2
Visual Representation
The GUI combines versions of the UMLS, UMLSBase, MetaMap, cTAKES, Numerics and Long’s annotators with a visual representation.
2.2.1
Features
Key aspects considered in the design of the GUI were:
∙ Usability
∙ Customization
∙ Conciseness
Usability
Like the design for any interface, a key component to consider is how the user will interact with the system. ThesMap was designed to allow the user to easily glance and determine the pertinent information identified by annotators. Highlighting helps to identify which words in the text are annotated with a particular NLP annotator. Annotations are collapsed into one if they had matching CUIs and TUIs. For example, if a word is tagged by UMLS, UMLSBase and cTAKES, the annotation will be saved as one annotation with information regarding the CUI and TUI rather than three annotations for the three different annotators. Users are able to avoid some of the complexity of the various annotators and only need to see the relevant information.
Customization
ThesMap allows the user to manipulate and change different parameters according to the required needs for a particular dataset. Users can modify which annotators to select for annotations in the event that the user wants to see only particular annotators. It is simple to toggle the checkboxes and to have certain annotators show up for the highlighting. Users can also create and select the TUI sublist of choice.
Conciseness
The user should be able to easily see all of the information necessary without being overwhelmed. Similarly to what was mentioned in usability, annotations with match-ing overlappmatch-ing CUIs and TUIs are collapsed. It allows for the user to be able to
see which annotators overlap for a particular terminology. No excessive information should be presented. For example, the user uses a mouse to hover over a particular word in the text to see the annotations rather than be overwhelmed with seeing all of the annotations at once.
2.2.2
Components
In the GUI version, ThesMap has three windows:
1. Main Window
2. Annotations Window
3. Log Window
Main Window
When the user first opens up the program, the user interacts with the main window as seen in Figure 2-1.
In the right panel, the user can copy and paste any plain free-form text to be analyzed. An example of such text can be seen in Appendix A.
In the top left panel, the user selects from a dropdown list of various pre-populated TUI sublists. This is designed to test out how different semantic type subgroupings change the number and types of annotations shown. By default, all of the semantic types are selected.
Beneath the TUI dropdown selection, there is a panel for the user to interact and select the particular TUI(s) to be annotated. This differs from the dropdown list because it shows how selected TUIs annotate the text. Users can select each TUI to determine which semantic types are useful and then potentially create a subset to be saved as a pre-populated TUI subgrouping for later. The user can simply save a .txt file that contains a list of the TUI numbers. An example use case is when dealing with a new dataset that the user is unfamiliar with. This setting panel allows the
Figure 2-1: Main GUI Window. This window contains 4 main components: 1. TUI subgroupings selection (top left), 2. TUI selection (middle left), 3. annotator selection (bottom left) and 4. input for free-form text (right).
user to determine which TUIs are relevant, especially because different datasets have different foci.
On the bottom left, the user can select the annotator(s) to run by simply clicking on a particular checkbox. The progress bars assist the user in determining the status of each annotator because the different annotators take different amounts of time to finish processing.
After pressing the "Annotate" button on the bottom left, the user has to wait for the processing to finish. The button will display "Annotating" during this wait period. When completed, the text on the right panel is highlighted if a particular word or phrase matches a concept found in the Metathesaurus. The color of the highlighting corresponds to a particular annotator. Darker highlighting means that more annotators have found a matching concept. The user can then hover over a particular word or phrase to learn more about the associated annotations. The results are displayed in the Annotations Window.
Annotations Window
Figure 2-2 shows the second window that the user can interact with. As mentioned in the previous section, when the user hovers over a particular phrase, ThesMap displays more information about the concept associated with the phrase. The Annotations Window will show all possible CUIs and the corresponding text. For example, in this case, the user hovered over the word "pressure." The concepts of "systolic blood pressure", "blood pressure", "pressure" and "pressure in" are all highlighted as potential annotations for what the "pressure" in the original text could reference. Annotations are collapsed into one if the concepts have exact matches with the same CUI and TUI value. This is helpful to identify the various interpretations of a phrase made by different annotators. A particular term could also have multiple CUIs and TUIs associated, and these are grouped based on the key word or phrase.
The format of each of the annotations displayed is:
Figure 2-3: Log Window.
[ A n n o t a t o r 1 Name , A n n o t a t o r 2 Name , ... , A n n o t a t o r k name ] [ CUI # , TUI #] p r e f e r r e d text ( s e m a n t i c type )
Log Window
As seen in Figure 2-3, the Log Window serves as an additional method of representing status updates and debugging in case anything becomes stalled during the process-ing of the text. Some messages displayed include "Wrong username/password for the database", "Note 1 has been annotated and saved to the database", or "AnnotatorcTakes elapsed time(ms): 329531."
2.3
Batch Processing Overview
2.3.1
Pipeline
The purpose of the batch process pipeline is to create an easy method of annotating multiple text files. Figure 2-4 gives a high level overview of the entire system starting from the input to the output of annotations in the database.
2.3.2
Features
Figure 2-4: Batch processing pipeline overview.
∙ Parallelism
∙ Customization
∙ Efficiency
Parallelism
A feature of batch processing for ThesMap is the ability for multiple annotators to run concurrently across different text files. There are limitations, depending on the resources of the host machine, to determining how many files can be processed at once, but ThesMap will create the appropriate number of threads depending on the annotators for the different files. More details about how the annotators are implemented is described in Section 2.5.1.
Customization
As mentioned above, the user is able to specify what the input and output formats are. Different scenarios might require the runs to be in different environments such as using text files from a directory or free form texts from a database. The user also has
the option to determine what is or is not useful in evaluating the different annotators. There is also the option to select the TUI sublist and which annotator(s) to run.
Efficiency
One advantage to the batch processing pipeline is efficiency during the annotation process. A user has the potential to use the GUI version to annotate each individual text file, but this could potentially take a long time if dealing with thousands of notes in a database. The batch processing allows for a faster method of processing and presents the result in a MySQL database format. ThesMap will spin up the threads necessary to annotate a certain selection of files at the same time.
2.4
Components
2.4.1
Input Selection
As shown in Figure 2-5, the user is presented with two options for running the batch process pipeline in a screen similar to the GUI version. As seen in the left screenshot from Figure 2-5, the user can select a particular directory, the TUI sublist and the annotators to run. ThesMap runs on the .txt files within the selected directory.
In the right picture, the user can specify a particular remote MySQL database to read the files from. The system is designed to accept input in the format of a free-form text and a document identifier for the particular text such as "Note 1". An example of the SQL command is
S E L E C T text , t i t l e FROM n o t e e v e n t s W H E R E t i t l e is not null ; Users need to enter in the proper information regarding the MySQL database including the name of the database, name of the table, username and password.
For the following description about the batch processing pipeline, it is assumed that the user selects the option of reading from a MySQL database instead of the file directory. In the current version of the system, ThesMap only works with MySQL databases.
Figure 2-5: Batch Processing Window. (Left: Browse by Directory for Input. Right: Use text from database for input.)
2.4.2
Processing
After the user specifies the input method, ThesMap then runs the annotators behind the scenes. The Batch Processing Window will display the overall progress of the multiple files with the progress bar while the Log Window will display the progress of the annotators. After the annotators are completed, the annotations are saved in the specified format. More information about the system implementation will be described in Section 2.5.
2.4.3
Output Format
The user can select what format the output will be in. By default, the annota-tions will be stored in a pre-specified MySQL database that can be modified in the ThesMap.properties file. The user can also save the annotations in a .csv or .txt output file format.
Once the free form text is processed and saved, the user can easily analyze and process the result.
2.5
Implementation of ThesMap
2.5.1
Overall Implementation
ThesMap.java, the main file that initializes the program, loads local and remote resources about the different annotators such as UMLS Metathesaurus or MetaMap’s server using the configuration specified in the ThesMap.properties file. Depending on what the user specifies, ThesMap will either run the interactive window called UMLSWindow or the batch processing window called BatchWindow.
Annotators
ThesMap utilizes an object pool pattern for the annotators which keeps objects in use rather than reallocating them on demand. This design pattern was used to improve performance because it reduces the amount of time needed to initialize all of the different components for the annotators. Often, annotators use the same resources for each document processed, but take considerable time to initialize and then access the database, such as in the case of the UMLS annotator. Re-using connections and taking advantage of caching of previously-computed results can speed up this process. Annotators are initially set up and registered by ThesMap to ensure that the annotators are consistently mapped so that they would be easier to reference. Each annotator is mapped to an integer to be used for various purposes such as matching the colors for the highlighted annotations to the annotator. The registration of annotators happens at the beginning of each run to make sure that all of the resources are in place before trying to run the annotator.
A key component of the system was figuring out how to consolidate multiple anno-tators in a consistent schema. ThesMap combines the different annoanno-tators of UMLS, UMLSBase, MetaMap, cTAKES, Numerics and Long’s parser. These annotations are flagged within ThesMap using a method similar to the content view flag used in the Metathesaurus. If a particular annotator has a valid annotation, then the bit asso-ciated with the annotator becomes 1 using the integer as a flag field. For example, if the particular word is annotated by UMLS, MetaMap and cTAKES, then those
three bits at their particular locations are flipped. In this case, the value saved would be 3328 (110100000000) because UMLS corresponds to 256, MetaMap to 1024 and cTAKES to 2048. The flag count begins at 256 to emulate how the Content View Flag is encoded within UMLS Knowledge Sources.
GUI Implementation
UMLSWindow is the framework that operates the three main windows that are part of the GUI. As previously mentioned, there are three windows are Main Window, Annotations Window and Log Window. The main window is created using various Java Swing components such as JTextArea, JScrollPane, and JPanel.
When the user clicks on the Annotate button, the annotators are started in the background. Components on the UMLSWindow listen for the annotators to send a property change event announcing that the processing has been completed for the particular annotator.
Every time the annotators send a message announcing "complete", the UMLSWindow checks to see if the annotator has been flagged as a selected option. ThesMap keeps track of which annotators have been completed. A progress bar under each annota-tor’s check box updates according to how much of the text has been annotated by the particular annotator. Depending on the annotator, the progress bar might display results slightly differently. For example, MetaMap and UMLS both rely on breaking up the text into smaller chunks before progressing so it is easier to show the update on how much of the document has been processed. However, cTAKES’ pipeline is slightly different so the entire text is processed before the UMLSWindow is notified and appropriately updated. During processing, the progress bar just shows as a "barber’s pole" and acts an indeterminate progress bar with only a motion to indicate progress is being made.
After interacting with the graphical interface, the user can save the annotations to a .csv file or to a table in a database using options from the main menu. ThesMap goes through the entire list of annotations and saves it in the .csv format which can then be uploaded to a database later.
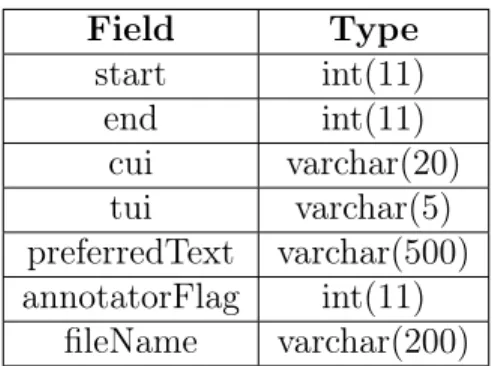
Field Type start int(11) end int(11) cui varchar(20) tui varchar(5) preferredText varchar(500) annotatorFlag int(11) fileName varchar(200)
Table 2.1: Description of the columns in the annotations table in the database.
Batch Processing Implementation
The BatchWindow opens up an UMLSDocument in a method similar to the GUI version after the user specifies the exact input for the text. A new UMLSDocument is created for each new document. Each UMLSDocument operates similarly to the UMLSWindow, in which it spins up individual threads to begin the processing for each annotator on each file. The processing happens in a sequential manner in which the program will start as many threads as possible for each file and then process it before moving onto the next file to open. This approach is the initial implementation of how processing is done across multiple files. Section 5.1.3 describes possible alternatives to this approach that allows for better resource distribution.
2.5.2
Database
The output of ThesMap is stored in a database table format as seen in Table 2.1. For each annotation, the start and end positions within the text are stored so that the user can retrieve information about the original words using the location in the text. The following three fields (CUI, TUI and preferred text) are all information that are relevant to describing the particular annotation. The annotator flag is the flag field that keeps track of which annotators were flagged with the exact same CUI and TUI values (as discussed in 2.5.1). Finally, the file name keeps track of which document the text file is located so that the user can refer back to the exact document that contains the annotations. In this version, only the file name was saved, but in
practice (as mentioned in the future work section), each entry would have to save both the source database as well as an identification number. This will eliminate the chance for collisions to happen between entries that could potentially have the same document name.
Chapter 3
Results and Analysis
3.1
Texts Processed
In order to have a better understanding of how well ThesMap works, I initially started with processing on an example note using the GUI version (see Appendix A for the example note). The screenshots in Chapter 2 (Figures 2-1,2-2, 2-3) demonstrate the results from processing. All subsequent analysis in this chapter was also completed using the example note.
After doing the analysis on the example text, I then used the batch processing method to analyze note events from the MIMIC II (Multiparameter Intelligent Moni-toring in Intensive Care) databases [10]. MIMIC II was used because the information was easy to access, publicly and freely available for use upon accepting a data use agreement. MIMIC consists of a comprehensive set of data including numerous clin-ical notes about a large population of ICU patients.
3.2
Analysis of the System
3.2.1
Effectiveness of the GUI
In order to analyze the visual representation, one can look at how effectively the system represents each annotation result.
In the general case, the highlighting allows the user to easily see which annota-tors have annotated a particular key word or phrase, but becomes confusing as the number of annotators increase. Although certain phrases become darker with more annotations, certain colors become more difficult to distinguish because there are too many combinations of annotators.
ThesMap allows the users to be able to see which key words are flagged and annotated, but falls short in presenting how the different entities relate to one another. As explored in Section 5.1, the relationships between entities would be useful in better understanding the concepts and the annotators. When looking at the Annotation Window, the user can see all of the consolidated annotations for the key word, but it is difficult to distinguish among what the different CUIs and TUIs represent for the preferred word. This detracts from the usability perspective for the user because the user would need to look up what all of the different CUI and TUIs correspond to. There is a trade-off between presenting too much about the CUI/TUIs for the annotation and not presenting enough.
3.2.2
Computation Time
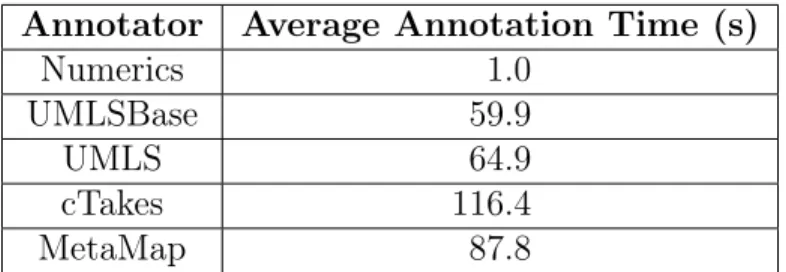
In order to have a relative comparison of how the annotators ran against each other, I ran ThesMap on an iMac (Intel Core i5 2.7 GHz), which has one processor with four cores, to compare the relative computation times. In general, the annotators took longer to annotate the text when multiple annotators are running in parallel because multiple threads were running at the same time. The comparison of the run times for various annotators on the example document can be seen in Table 3.1. The results agree with what is expected, in which the annotators that require extra resources take longer. For example, on average, Numerics finished processing in roughly one second while an annotator such as cTAKES (which requires more computation) took almost two minutes to finish running. cTAKES and MetaMap took longer to process than all of the other annotators because they require look up from UMLS. UMLS and UMLSBase finished at relatively the same time because both annotators relied on the same annotation scheme, but just loaded a different subset for the dictionary.
Annotator Average Annotation Time (s) Numerics 1.0 UMLSBase 59.9 UMLS 64.9 cTakes 116.4 MetaMap 87.8
Table 3.1: Average Time needed to run annotators when all annotators are running. Average is calculated by running over the example note on five separate occasions. This note contains 353 lines of text, which is about fifteen thousand characters and 2,250 words.
cTAKES requires almost double the amount of time necessary to compute compared to any of the other annotators because of the complexity involved in the pipeline.
This analysis basically shows the relative computation times needed rather than an absolute time for processing since computations differ for different machines. Some of the parameters of the annotators can be slightly modified to generate faster compu-tation times, such as modifications to cTAKES’ configuration, but I did not explore the effect of such variations.
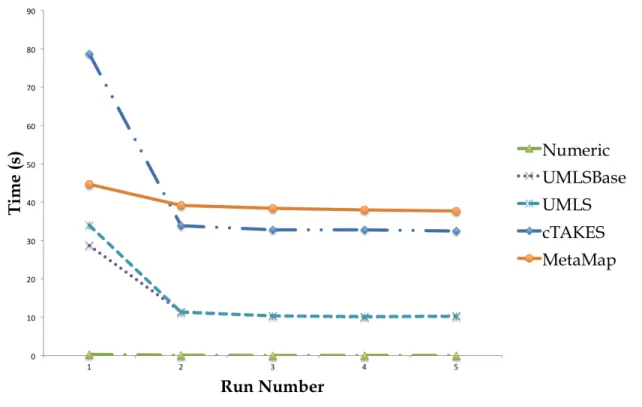
To better understand how caching affected the annotations, I reran the annotators on the same example text five times in the same main window. As seen in Figure 3-1, the run times decrease after the first run because some of the intermediate steps done by each annotation pipeline were cached. For example, UMLS and UMLSBase annotators store the processing done by lvg on substrings as well as the normalized terms in the mrxns_eng (the normalized string index table), which reduces the number of look up access to the database.
The annotators require a consistent amount of time to look up existing anno-tations. Even though the times were not negligible after the first run, they were fairly constant even after multiple runs. This is to be expected because once the intermediate results are cached, there is no longer further improvements on run time.
Figure 3-1: Graph comparing annotators over the course of multiple runs in the same instance of running the GUI version.
List of Annotators Number of an-notations Percentage (out of all annotations) UMLS 3123 49.37% UMLS, UMLSBase 210 3.32% MetaMap 241 3.81% UMLS, MetaMap 803 12.69% UMLSBase, MetaMap 2 0.03%
UMLS, UMLSBase, MetaMap 26 0.41%
cTAKES 15 0.24%
UMLS, cTAKES 49 0.77%
UMLSBase, cTAKES 1 0.02%
UMLS, UMLSBase, cTAKES 22 0.35%
MetaMap, cTAKES 27 0.43%
UMLS, MetaMap, cTAKES 91 1.44% UMLS, UMLSBase, MetaMap, cTAKES 64 1.01%
Numerics 90 1.42%
UMLS
MetaMap
cTAKES
UMLSBase
3123
241
210
803
27
15
1
22
91
26
64
Numerics
90
Figure 3-2: Venn Diagram comparing how the different annotators match up by running on five text files from the MIMIC II table noteevents. Each entry in the Venn Diagram detail the number of annotations that were in the particular intersection.
3.2.3
Annotator Comparison
As seen in Table 3.2, segments of text could be annotated by any combination of the annotators that were incorporated. There are multiple combinations of annotators that were flagged for the text. For the five different annotators, there could be up to 32(25) different combinations of annotations, but only the combinations shown in the table occurred. Looking over the results, it can be noted that the Numerics annotator was only flagged by itself rather than in combination with the other annotators. This is because Numerics annotates text only by looking for numeric patterns, and determines the CUI and TUI for the particular annotation based on which pattern is matched. The most common pattern is just a numeric constant, which is assigned the CUI “C0449788” (“Count of entities”) and TUI “T081”, which is the semantic type for “Quantitative Concept”. Numerics also tries to check to see if there is a more specific match to numeric patterns, but for the most part, the annotations are noted as this Quantitative Concept. Other possible annotations created by Numerics are for dates, with CUI “C0011008” (“Date in time”) and TUI “T079” (“Temporal Concept”), and times, with CUI “C0040223” (“Time”) and TUI “T079”.
By looking at Figure 3-2, one can see how much overlap occurred between the different annotators. When looking over all of the annotators, over half of the anno-tations were from single annotators such as only annoanno-tations from UMLS or MetaMap. For example, the annotator UMLS by itself accounted for 49% of annotations. Be-sides the single annotators, the intersections are crucial to comparing the different annotators. UMLSBase mostly has annotations that lie within UMLS which is to be expected because UMLSBase has a subset of UMLS’ dictionary. Of all of the annota-tions by UMLSBase, only one annotation happened to lie outside of the intersection with UMLS, which leads to the understanding that UMLSBase can most likely yield a similar set of annotation as UMLS, but much more selectively. To understand how useful UMLSBase is, it is interesting to note when UMLS overlaps with the other an-notators, but not UMLSBase. There was a significant amount where UMLS intersects MetaMap and cTAKES outside of the realm of UMLSBase. Therefore, UMLSBase is
overly selective when compared to these other annotators.
Besides the annotations done by only one annotator, the intersections with the most annotations are UMLS with MetaMap, UMLS with MetaMap and cTAKES, and the intersection of all four annotators (UMLS, UMLSBase, MetaMap and cTAKES). UMLS and MetaMap have the most overlapping annotations, which probably means that they yield relatively similar results. Although the overlaps are fairly low in terms of numbers, these overlaps indicate that these are most likely to be terms that are a relatively accurate representation of what the proper annotations are. The next step to investigate is to use a gold standard to confirm the precision of the results.
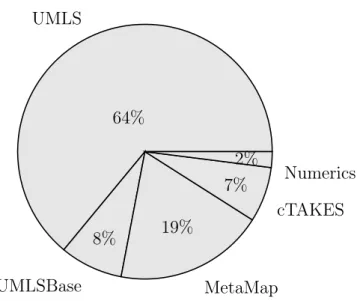
Figure 3-3 demonstrates how each annotator individually compares to the other annotators rather than comparing combinations of annotators. In order to determine the percentage, I summed together all of the annotations that were flagged by the particular annotator. For example, UMLS was calculated by adding together all of the annotations from the subsets of UMLS such as the sets of [UMLS] and [UMLS, MetaMap, cTAKES]. By looking at each individual annotator, UMLS accounts for 64% of the total annotations meaning that it was the most commonly flagged anno-tator. MetaMap is second in terms of number of total annotations. These results provide a general understanding of how the annotations compare rather than any absolute measure of the precision of the terms found. To understand the big picture, UMLS seems to be contributing the most to the overall annotations, though it may be over-interpreting the text.
3.2.4
Subset of Semantic Types
After comparing the annotations from the different annotators, I then looked at how the annotators compared in terms of overlap when using a smaller subset of TUIs. For this particular run, I picked a set of TUIs that seemed to be relevant for the data. If one compares Table 3.2 (with all TUIs) and Table 3.3 (with subset of TUIs), one will notice that the overlapping annotations remain fairly constant. The smaller subset of TUIs helped to eliminate the annotations that were not relevant from UMLS. The number of annotations flagged by UMLS decreased by almost half from 3123
UMLS 64% UMLSBase 8% MetaMap 19% cTAKES 7% Numerics 2%
Figure 3-3: Comparison of results for all 3869 annotations regardless of annotation done by one or more annotators. This was run over a subset of annotations by running on 5 text files from MIMIC II.
to 1652 annotations. The overlap between different annotators such as the [UMLS, UMLSBase, MetaMap, cTAKES] combination remained fairly similar. This seems to suggest that the overlapping terminology are fairly consistent with each other. The terminologies might not be accurate and relevant to the text, but are more precise because the annotations have been confirmed by multiple annotators.
List of Annotators Number of an-notations Percentage (out of all annotations) UMLS 1652 42.7% UMLS,UMLSBase 209 5.4% MetaMap 120 3.1% UMLS, MetaMap 377 9.74%
UMLS, UMLSBase, MetaMap 28 0.72%
cTAKES 15 0.39%
UMLS, cTAKES 47 1.21%
UMLSBase,cTAKES 1 0.03%
UMLS, UMLSBase, cTAKES 21 0.54%
MetaMap, cTAKES 23 0.59%
UMLS, MetaMap, cTAKES 93 1.63% UMLS,UMLSBase, MetaMap, cTAKES 63 1.63%
Numerics 90 2.33%
Table 3.3: Comparison of a subset of annotations by running on 5 text files from MIMIC II. Note: This table differs from 3.2 in which a smaller subset of TUIs was chosen.
Chapter 4
Applications
4.1
Autism Spectrum Disorder
I am currently planning on using ThesMap to run on clinical texts at the Boston Children’s Hospital to better understand Autism Spectrum Disorder (ASD). Due to issues with setup and the processing time, I have not been able to determine and analyze the results.
The hope is that we can retrieve a more relevant set of annotations with the smaller subset of TUIs. Previously, Professor Szolovits and one of his students had encountered the problem where the children were being flagged for symptoms relating to cancer, which did not make sense during the analysis of autism. The subset of TUIs was determined by limiting semantic types that are not as relevant to the ASD data such as the entities of "Animal" or "Occupation or Discipline." The TUIs for other concepts such as "Laboratory or Test Result" or "Behavior" were retained. There is potential for these annotations to yield better results.
4.2
Other Potential Applications
Besides using ThesMap to understand ASD, there is potential for this system to be run to analyze various other disorders. ThesMap analyzes any type of free form medical texts. For example, in the previous chapter, I was able to easily switch to annotating
the MIMIC II data by changing the MySQL database in the batch processing window and the subset of TUIs. Different subsets can be created depending on the application to influence the resulting annotations.
Chapter 5
Conclusion
5.1
Future Work
Due to time constraints, not all of the features were able to be fully implemented, but here are some recommendations for possible improvements to making a more cohesive and efficient ThesMap.
5.1.1
Overall Design Improvements
Parameter Modification
One aspect that can be improved is the ability for users to specify the parameters needed for each annotator. Most of the annotators can be modified with different parameters to increase efficiency or other purposes. For example, cTAKES can be modified to be using different libraries or different pipelines. In this version of the implementation, only the default cTAKES fast pipeline was used. MetaMap can be modified to take a different size word chunks for the processing. In a more compre-hensive system, ThesMap could present the user with the parameters that can be tweaked rather than forcing the users to dig through code to modify how the annota-tor would work. The ability to change the parameters in a GUI format would reduce some of the complexities that are normally associated with the various annotators. It would all the annotators to be taken as black boxes that can be tweaked for specific
purposes rather than complicated annotators.
Settings
On a similar note, the user could be presented with a "Settings" menu where he or she could modify all of the components involved whether it is the parameters of the annotators or the output format. Instead of the current method of directly saving to the database, the user can specify using different methods of output. In this case, the location of the output would be specified whether it is a table in a database or a .csv file.
Command Line (non-GUI version)
Another possible modification is to give the user the option of running ThesMap via command line within a console. This could potentially be easier to run for certain use cases such as in the case of batch processing. The information about the databases and the SQL command would have to be specified through the command line, but overall, it could simplify the runs. The advantage of this approach would be to allow the user to run the program remotely via SSH or other means without the need to open the GUI. Resources could be saved and utilized on the actual processing rather than opening a GUI window.
Annotation Flag Field
The schema for the flag field that keeps track of the annotators could be improved depending on how many annotators are added to the system. The current schema requires the user to specify the values of each annotator such as 256 for UMLS. The schema allows the user to easily modify the values according to the type of annotators, but could lead to problems with collaborations. These values could be inconsistent among users because it is not universal. A possible solution is to create a hash function that creates a value for each annotator instead of specifying the values in the ThesMap.properties file. This would ensure consistency because the hash
function would make sure that the annotators map to the same value and does not collide with the bits from other annotators.
5.1.2
GUI Improvements
There are a few modifications that can be made to the visual approach for a better ThesMap.
Scaling up Annotators
One modification is figuring out how to display annotations when scaling up the number of annotators. It is not entirely obvious what the ideal user interface would be. In order to represent 𝑘 annotators, there would be 2𝑘 options for whether or not an annotator has been flagged. Color choices for highlighting would become more difficult to visualize. At that point, highlighting might not be the ideal method of visualizing the annotations.
TUI lists
Ideally, there should be a simpler method to creating the list of the TUI subset from the GUI. Currently, the user has to determine the TUIs from the left panel, manually create a .txt file, and then, save the file to the project folder. One solution is to give the users the ability to export the highlighted terminologies from the semantic tree on the left into the proper format of the .txt file so that the user would be able to easily reload it in the future. This exporting feature could be added to the "Settings" menu mentioned previously.
Entity Relationships
Another possible improvement to the system is to find a way to represent the relation-ships between different annotations. All of the terminologies that are highlighted are single entity concepts rather than the relationships of the entities. The relationships could be useful for better understanding the annotators. For example, there should
be a method of denoting the negation of a concept or how one disease relates to the treatment.
5.1.3
Batch Improvements
Parallelism
For the batch processing, one aspect that can be improved upon is a better method of parallelizing the processing for the different annotators. Most NLP algorithms are time and memory intensive so it is slow to run multiple annotators at once. The system can be better optimized according to the constraints of the computer that the annotators are being run on. ThesMap can be more adaptive to split up tasks for ma-chines with more cores or processors. If one annotator takes more time than another annotator, ThesMap should run the first annotator with more resources because it is a slower annotator. More resource should be spent on the slower annotator. For example, if cTAKES runs twice as slowly as MetaMap, then two documents can be analyzed in parallel, with two threads running cTAKES, but only one thread doing the MetaMap analysis sequentially over the two documents. This will ensure that the machine could be using as close to 100% of capacity.
Another possible approach to solving this problem is to run each annotator inde-pendently. One annotator would run through all of the files before another annotator begins. All of the resources could be spent entirely on one annotator so that there would be less down time in switching between resources for annotators. The downside of this approach would be the need to access the database multiple times and modify certain entries for the overlapping annotations from different annotators.
Security
One aspect that was not thoroughly explored in this project was security. This is an important feature that should be improved on for future iterations. The current method of handling SQL command is to ensure that the user is only using "SELECT" commands with access to read-only tables in the original database. In the use case
with the MIMIC II database, the table "note events" was set with the read-only status. However, it should not be up to the owner of the table to ensure that the SQL commands are valid. For example, there should more checks in place to ensure that proper SQL commands are being processed to not corrupt the existing database whether through the user’s error or an external threat.
Patient data needs to be handled carefully whether or not it is de-identified. It might also be necessary to encrypt certain data if need be. For example, the post processing would have to be trusted to being secure.
Database Changes
To accommodate some of the suggestions earlier, the format of the database should be altered. For example, in order to reflect the semantic relationships (rather than just the concepts), there would need to be a secondary table or another way of storing how each entry relates to another entry in the table. Concepts such as negation could be added to the table format by adding an additional field for negation. File name could be modified in the event that the read-only database does not necessarily have unique naming scheme. For example, "Note 1" might be unique within one table for one set of data, but repeated in another dataset. The table would then be storing annotations both under the identifier "Note 1", with no distinction about which dataset the note originated from. More information could be stored to reduce the likelihood of overlap to happen between data sets.
5.1.4
Testing
ThesMap could benefit from user testing as well as load testing. To confirm the effec-tiveness of the GUI system, I would ideally be testing with people who are interested in analyzing annotators and seeing what is more efficient. It would mostly be useful for researchers who are interested in understanding the various annotators.
ThesMap could also benefit from more load testing to see what happens in the extreme cases such as figuring out what is the maximum number of files that it can
handle from a database. More testing would be done to determine how computation-ally expensive using multiple annotators are compared to running a single annotator.
5.2
Summary
My work enhances the applications of Natural Language Processing algorithms to clinical texts. Through the work with Professor Szolovits, I created a system that integrates multiple annotators together. ThesMap allows for a visual representation of one text document and the batch processing pipeline for large quantities of files in a database. Some of the work done on the GUI include making sure the highlighter works consistently and collapsing the annotations into single entries. Another aspect of my work was the ability for the user to read text files from a database, batch annotate those files and then save results to another database. These two aspects allowed for the processing and comparison of various annotators to see which ones overlap and which ones should be ignored.
Appendix A
Example medical note
Admission Date : 2011−10−06 D i s c h a r g e Date : 2011−10−17 Date o f B i r t h : 1935−03−29 Sex : M
S e r v i c e : M e d i c i n e
CHIEF COMPLAINT: Admitted from r e h a b i l i t a t i o n f o r h y p o t e n s i o n ( s y s t o l i c b l o o d p r e s s u r e t o t h e 70 s ) and d e c r e a s e d u r i n e o u t p u t .
HISTORY OF PRESENT ILLNESS : The p a t i e n t i s a 76− year−o l d male who had been h o s p i t a l i z e d a t t h e B r o o k s i d e H o s p i t a l from
09−27 t h r o u g h 10−05 o f 2002
a f t e r u n d e r g o i n g a l e f t f e m o r a l −AT b y p a s s g r a f t and was s u b s e q u e n t l y d i s c h a r g e d t o a r e h a b i l i t a t i o n f a c i l i t y .
On 2011 −10 −06 , he p r e s e n t e d a g a i n t o t h e B r o o k s i d e H o s p i t a l a f t e r b e i n g found t o have a s y s t o l i c
b l o o d p r e s s u r e i n t h e 70 s and no u r i n e o u t p u t f o r 17 h o u r s . A F o l e y c a t h e t e r p l a c e d a t t h e r e h a b i l i t a t i o n f a c i l i t y
y i e l d e d 100 c c o f murky/ brown u r i n e . There may a l s o have been p u r u l e n t d i s c h a r g e a t t h e p e n i l e meatus a t t h i s t i m e . On p r e s e n t a t i o n t o t h e Emergency Department , t h e p a t i e n t was
w i t h o u t s u b j e c t i v e c o m p l a i n t s . I n t h e Emergency Department , he was found t o have s y s t o l i c b l o o d p r e s s u r e o f 8 5 . He was g i v e n 6 l i t e r s o f i n t r a v e n o u s f l u i d s and t r a n s i e n t l y s t a r t e d on dopamine f o r a s y s t o l i c b l o o d p r e s s u r e i n t h e 8 0 . s
PAST MEDICAL HISTORY :
1 . Coronary a r t e r y d i s e a s e w i t h d i f f u s e 3− v e s s e l d i s e a s e ; r i g h t −dominant , s t a t u s p o s t p r o x i m a l l e f t c i r c u m f l e x s t e n t i n 2011−06−25 w i t h o c c l u s i o n o f t h e d i s t a l l e f t c i r c u m f l e x ; s t a t u s p o s t r i g h t c o r o n a r y a r t e r y s t e n t on 2011−08−12 ( no p e r c u t a n e o u s c o r o n a r y i n t e r v e n t i o n t o 99% d i a g o n a l l e f t c i r c u m f l e x , 80% s m a l l p r o x i m a l l e f t a n t e r i o r d e s c e n d i n g a r t e r y , o r 80% s m a l l d i s t a l l e f t a n t e r i o r d e s c e n d i n g a r t e r y ) . 2 . C o n g e s t i v e h e a r t f a i l u r e ( w i t h an e j e c t i o n f r a c t i o n o f 15% t o 20%) . 3 . Type 2 d i a b e t e s w i t h n e u r o p a t h y . 4 . H y p e r t e n s i o n . 5 . D i v e r t i c u l o s i s ( found on c o l o n o s c o p y i n 2011−06−25) . 6 . Alzheimer ’ s dementia . 7 . H i s t o r y o f g a s t r o i n t e s t i n a l b l e e d ( w h i l e t h e p a t i e n t was t a k i n g e p t i f i b a t i d e ) . 8 . C a r d i a c r i s k f a c t o r s ( w i t h a b a s e l i n e c r e a t i n i n e o f 1 . 4 t o 1 . 6 ) . 9 . H y p e r c h o l e s t e r o l e m i a . 1 0 . H i s t o r y o f m e t h i c i l l i n −r e s i s t a n t S t a p h y l o c o c c u s a u r e u s and Pseudomonas growth i n wound c u l t u r e s .
1 1 . S e v e r e p e r i p h e r a l v a s c u l a r d i s e a s e ; s t a t u s p o s t l e f t f e m o r a l −AT b y p a s s g r a f t on 2011 −09 −27.
1 2 . C h r o n i c n o n h e a l i n g f o o t u l c e r s . 1 3 . Recent r i g h t p e d a l c e l l u l i t i s .
ALLERGIES : The p a t i e n t has no known drug a l l e r g i e s . MEDICATIONS ON ADMISSION : 1 . Vancomycin 1 g i n t r a v e n o u s l y q . 2 4 h . f o r a l e v e l o f l e s s than 15 ( s t a r t e d on 2011−09−20) . 2 . L e v o f l o x a c i n 250 mg p . o . q . d . ( s t a r t e d on 2011−09−20) . 3 . M e t r o n i d a z o l e 500 mg p . o . q . 8 h . ( s t a r t e d on 2011−09−20) . 4 . H e p a r i n 5000 u n i t s s u b c u t a n e o u s b . i . d . 5 . S i m v a s t a t i n 40 mg p . o . q . d . 6 . L i s i n o p r i l 5 mg p . o . q . d . 7 . Furosemide 40 mg p . o . q . d .
SOCIAL HISTORY : The p a t i e n t i s r e t i r e d and had been l i v i n g a t home w i t h h i s w i f e p r i o r t o h i s a d m i s s i o n t o t h e h o s p i t a l on 2011 −09 −27; he had been l i v i n g a t Johnson Rehab H o s p i t a l
f o r t h e day p r i o r t o a d m i s s i o n . He i s a
s o c i a l d r i n k e r and has a 40−pack−y e a r smoking h i s t o r y ; a l t h o u g h , he q u i t smoking 20 y e a r s ago .
Bibliography
[1] A. Aronson et al. National Library of Medicine (NLM) MetaMap. http:// metamap.nlm.nih.gov/. Accessed: 2014-10-25.
[2] A. Aronson et al. An overview of MetaMap: historical perspective and recent advances. Journal of American Medical Informatics Association, 2010.
[3] W. Chapman et al. Overcoming barriers to NLP for clinical texts: the role of shared tasks and the need for additional creative solutions. Journal of American Medical Informatics Association, 2011.
[4] W. Chapman et al. Extending the NegEx lexicon for multiple languages. Pro-ceedings of the 14th World Congress on Medical & Health Informatics, 2013. [5] Highest number of citations. https://ctakes.apache.org/
relatedresources.html. Accessed: 2014-11-22.
[6] International statistical classification of diseases and related health prob-lems source information. http://www.nlm.nih.gov/research/umls/ sourcereleasedocs/current/ICD10/index.html. Accessed: 2015-03-15. [7] C. Lindberg. Unified Medical Language System (UMLS). http://www.nlm.nih.
gov/research/umls/. Accessed: 2014-10-25.
[8] Lexical Variant Generation (LVG). http://www.nlm.nih.gov/research/umls/ new_users/online_learning/LEX_004.htm.
[9] A. McCray et al. Aggregating UMLS semantic types for reducing conceptual complexity. Studies in health technology and informatics, 2001.
[10] MIMIC II database. http://physionet.org/mimic2/index.shtml. Accessed: 2015-02-11.
[11] Tawanda Carleton Sibanda. Was the patient cured? Understanding semantic cat-egories and their relationships in patient records. Master’s thesis, Massachusetts Institute of Technology, 2006.
[12] SNOMED Clinical Terms (SNOMED CT○R). http://www.nlm.nih.gov/ research/umls/Snomed/snomed_main.html. Accessed: 2015-03-15.
[13] S. Sohn et al. Dependency parser-based negation detection in clinical narratives. AMIA Summits on Translational Science Proceedings, 2012.
[14] The CORE problem list subset of SNOMED CT○R. http://www.nlm.nih.gov/ research/umls/Snomed/core_subset.html. Accessed: 2014-12-04.
[15] Y. Xia et al. Combining MetaMap and cTAKES in disorder recognition: THCIB at CLEF eHealth Lab 2013 Task 1. In Proceedings of the ShaRe/CLEF Evalua-tion Lab, 2013.