Publisher’s version / Version de l'éditeur:
Vous avez des questions? Nous pouvons vous aider. Pour communiquer directement avec un auteur, consultez la première page de la revue dans laquelle son article a été publié afin de trouver ses coordonnées. Si vous n’arrivez pas à les repérer, communiquez avec nous à [email protected].
Questions? Contact the NRC Publications Archive team at
[email protected]. If you wish to email the authors directly, please see the first page of the publication for their contact information.
https://publications-cnrc.canada.ca/fra/droits
L’accès à ce site Web et l’utilisation de son contenu sont assujettis aux conditions présentées dans le site LISEZ CES CONDITIONS ATTENTIVEMENT AVANT D’UTILISER CE SITE WEB.
4th International Symposium on Underwater Technology [Proceedings], 2004
READ THESE TERMS AND CONDITIONS CAREFULLY BEFORE USING THIS WEBSITE. https://nrc-publications.canada.ca/eng/copyright
NRC Publications Archive Record / Notice des Archives des publications du CNRC :
https://nrc-publications.canada.ca/eng/view/object/?id=bfeef665-541b-4c05-8b79-2855517b90e5
https://publications-cnrc.canada.ca/fra/voir/objet/?id=bfeef665-541b-4c05-8b79-2855517b90e5
Archives des publications du CNRC
This publication could be one of several versions: author’s original, accepted manuscript or the publisher’s version. / La version de cette publication peut être l’une des suivantes : la version prépublication de l’auteur, la version acceptée du manuscrit ou la version de l’éditeur.
Access and use of this website and the material on it are subject to the Terms and Conditions set forth at
Underwater gliders: recent developments and future applications
Underwater Gliders: Recent Developments and
Future Applications
R. Bachmayer
∗, N. Ehrich Leonard
†, J. Graver
†, E. Fiorelli
†, P. Bhatta
†and D. Paley
†∗
National Research Council - Institute for Ocean Technology
Kerwin Place, St. John’s, A1B 3T5 NL, Canada
Tel.: +709-772-7986; Fax: +709-772-2462
E-mail: [email protected]
†
Department of Mechanical and Aerospace Engineering
Princeton University, Princeton, NJ 08544, USA
E-mail: naomi{jggraver, eddie, pradeep, dpaley}@princeton.edu
(Invited Paper)
Abstract— Autonomous underwater vehicles, and in particular
autonomous underwater gliders, represent a rapidly maturing technology with a large cost-saving potential over current ocean sampling technologies for sustained (month at a time) real-time measurements.
In this paper we give an overview of the main building blocks of an underwater glider system for propulsion, control, communication and sensing. A typical glider operation, consist-ing of deployment, plannconsist-ing, monitorconsist-ing and recovery will be described using the 2003 AOSN-II field experiment in Monterey Bay, California.
We briefly describe recent developments at NRC-IOT, in particular the development of a laboratory-scale glider for dynamics and control research and the concept of a regional ocean observation system using underwater gliders.
I. INTRODUCTION
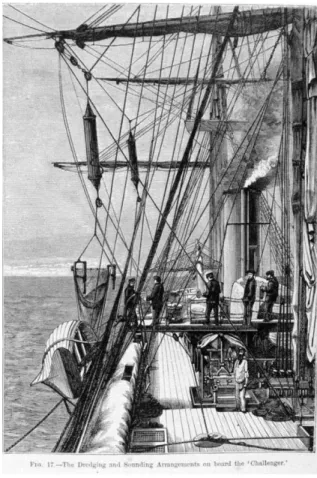
Sampling the oceans has traditionally been conducted from ships, with the first global oceanographic research cruise by Sir Wyville Thomson on the HMS Challenger from 1872-1876, Figure 1, which led to numerous discoveries such as the mid-Atlantic ridge and the Challenger Deep in the Mariana Trench to name only a few. It took over 23 years to compile the results from this cruise.
Today with increasing use of remote sensing techniques from satellites and airplanes more and more data becomes available and needs to be processed. Current remote sensing technologies, airborne or from space, do not penetrate very far below the ocean’s surface. In order to gain more insight into the temporal and spatial processes below the surface we were until recently still depending on ship based measurements and moorings. Over the last decades alternative technologies such as subsurface floats, remotely operated vehicles (ROVs) and autonomous underwater vehicles (AUVs) have emerged to complement the existing sensing techniques. Visions of autonomous platforms roaming the oceans as described in [9] and [1] have not come true yet, but technological advances pushed by these visions brought us a long way from the
Challenger cruise.
In this paper we report on a special type of autonomous un-derwater vehicle, an unun-derwater glider, and on the implemen-tation of coupled ocean observation and modeling systems.
Fig. 1. Dredging and sounding arrangements on board the Challenger. Photo Credit: NOAA Photo library, source: http://oceanexplorer.noaa.gov/history/breakthru.html.
In Section II we describe the current glider technology and their mode of operation. Section III-A briefly describes the AOSN-II field experiment in Monterey Bay and Section III-B highlights the approach and implementation of multi-glider operations for the AOSN-II effort. In Section IV-A we describe NRC-IOT’s role in developing an asset management tool for a regional ocean observation modeling and prediction facility in Newfoundland. Current efforts at NRC-IOT to develop a laboratory-scale glider to support the above described effort
control and operations, is described Section IV-B.
II. UNDERWATERGLIDERS
Webb Research Inc., Falmouth, MA, USA
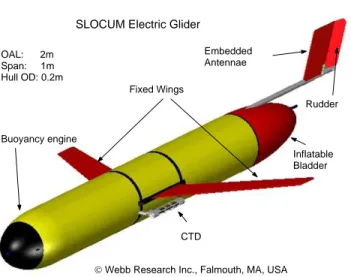
SLOCUM Electric Glider
Rudder CTD Buoyancy engine Fixed Wings OAL: 2m Span: 1m Hull OD: 0.2m Inflatable Bladder Embedded Antennae
Fig. 2. Rendering of a SLOCUM electric glider. Built by Webb Research Inc., Falmouth, MA, USA; http://www.webbresearch.com.
Autonomous underwater gliders, represent a rapidly-maturing technology with a large cost-saving potential over currently-available ocean sampling techniques, especially for sustained, month at a time, real-time oceanographic measure-ments.
Underwater gliders move efficiently through the water-column by exploiting their ability to change their weight in water. As a result there is an upward/downward force acting on the glider. Successive weight changes combined with a change in attitude result in a concatenation of up/down glide cycles. The combination of upward/downward force with the change in attitude (i.e. pitch) allow the wings and body to generate the hydrodynamic lift and drag forces which propel the gliders horizontally and vertically through the water. The mechanism to achieve this change in weight is referred to as a buoyancy engine (see Figure 2). Currently operational gliders, such as Seaglider [3], Spray [8] and the electric SLOCUM glider use an electromechanical displacement actuator, pump or piston, to change their weight. A prototype glider using an alternative thermally driven buoyancy engine is currently under development [11]. The closed-loop control of attitude and depth is performed by an on-board computer that also executes a pre-programmed mission while submerged. At the surface the gliders acquire their location using a GPS receiver and compare that position to the desired position from the mis-sion plan. The position error is used to compute an estimate of the average current flow encountered between two surfacings. The current estimate is then used to correct the dive parameters (i.e. heading) for the next dive cycle. At the surface the gliders are able to communicate globally using an IRIDIUM satellite connection (datarate≈2400 baud) or, for local line-of-sight communication, some gliders (i.e. SLOCUM) are equipped with a high bandwidth RF-modem (datarate≈115.2 kbaud). An ARGOS transmitter is implemented as a fall-back solution.
glider is at the surface, the antennae are at a maximum height above the water surface for reliable communications. In the case of the SLOCUM glider, the antennae for communication and GPS are embedded within the rudder assembly, Figure 2 and, by means of an inflatable bladder in the tail cone, can be brought out of the water. Once communication to a control center has been successfully established, the current glider mission can be updated and/or data recorded during previous missions can be downloaded from the vehicle.
Besides the vehicles’ position, attitude and other internal states, the gliders collect data from their scientific sensors. Typically the gliders carry a conductivity, temperature and depth sensor (CTD), but more recently additional instru-mentation such as Photosynthetically Active Radiation (PAR) sensors and fluorometers have successfully been operated. The drawback due to additional sensors as well as frequent communications and shallow dives, which imply frequent changes in buoyancy, is an increase in power consumption and therefore a reduction in mission length. Currently the operational endurance of the gliders varies from 3 to 4 weeks for the shallow SLOCUM glider (max. depth ≤ 200m) to several months for the deeper diving gliders Seaglider (max. depth ≤1000m) and Spray (max. depth ≤1500m). All three gliders are comparable in size and handling requirements. Their weight in air is approximately 50 kg and their total volume change capacity is between 0.5 and 1% of their total displacement. The horizontal speed relative to the surrounding water is typically around 35 cm/s. For more detailed informa-tion on the specific performance of the gliders the reader is referred to [3], [8], [11] and [4].
III. APPLICATIONS
A. Autonomous Ocean Sampling Network II - Monterey Bay 2003 (AOSN-II)
Fig. 4. Diagram of Real Time Operations Plan for AOSN-II. LCS stands for Lagrangian Coherent Structures, ROMS for Regional Ocean Model (JPL/UCLA) and HOPS for the Harvard Ocean Prediction System [7].
The Autonomous Ocean Sampling Network-II [1] field experiment was conducted during the summer of 2003 in Monterey Bay, California. This bay was chosen for its ac-cessibility, resident research institutions with on-site hardware (i.e. ships, airplanes, AUVs) and its interesting bathymetry, Figure 3. Since the region is well studied there is a large amount of historic data available for intercomparisons. The objective of the experiment was to demonstrate the feasibility of an integrated ocean observation, modeling and predic-tion system. This experiment differs from previous efforts because of its high degree of system integration, allowing for real-time adaptation based on ocean model predictions. The sampling patterns of mobile observational assets, such as ships, airplanes, underwater gliders (i.e. Spray, SLOCUM) and propeller driven AUVs (i.e. REMUS, DORADO) were planned and, in some cases, adapted using the numerical modeling and prediction capabilities of two independently-running numerical modeling codes developed by two groups from Harvard University (HOPS [7]) and the Jet Propulsion Laboratory (ROMS). Those models in turn were supplied with data coming from the mobile assets, as well as other sources such as CODAR data (COntinental raDAR), satellites, fixed moorings and surface drifters. Figure 4 gives an overview of the interactions between the different parts of the system as well as an idea of the different time-scales involved in the experiment.
B. Glider Operations
The core observational assets of AOSN-II were autonomous underwater vehicles and in particular a fleet of underwater
gliders. Two types of gliders were available, five Spray gliders [8] operated by Jeff Sherman and Russ E. Davis of the Scripps Institution of Oceanography and 10 SLOCUM gliders [11] op-erated by David Fratantoni from Woods Hole Oceanographic Institution. Prior to the experiment all gliders were shipped to the Monterey Bay Aquarium Research Institute (MBARI) in Moss Landing, California. On site the gliders were assembled, ballasted and tested in MBARI’s test-tank. Since the gliders were deployed for long periods of time, special attention was given to sensor calibration; the sensor data were closely monitored during the course of the experiment. After initial shakedown dives close to shore, the gliders were directed towards their operational area. To take full advantage of the different depth capabilities of the gliders, (see Section II), the five Spray gliders were deployed in the deep water further outside the bay while the SLOCUM gliders were flown closer to the bay.
Figure 5 shows a snapshot of the glider tracking display from 25 August 2003, with a three day position history plotted behind each glider. The two large dots represent fixed moorings in the Bay (M1, M2). The Spray gliders were flying on straight lines almost perpendicular to the shoreline, while the SLOCUM gliders were either flown on a fixed “racetrack” (a,b,c,d) or operated in an adaptive sampling mode where the trajectories of several gliders were coordinated and adjusted in a real-time experiment [2]. Communication to and from the gliders during regular operations used the IRIDIUM satellite system. Due to their more frequent inflections and higher sensor load, the SLOCUM gliders had to be recovered during the course of the experiment. The gliders were either directed
Fig. 5. Snapshot of real-time display for asset location. The length of the tail behind each asset corresponds to the positions during the last three days. Large dots represent moorings M1 (right) and M2 (left). In the figure legend, WExx stands for Woods Hole Oceanographic Institution Electric Glider (SLOCUM gliders), SIOxx for Scripps Institution of Oceanography (Spray gliders).
to a designated recovery area close to Moss Landing or were directed to an area to rendezvous with a surface vessel for recovery. When in range of the surface vessel, the gliders were able to directly communicate with the vessel and were controlled using the high bandwidth RF-link. After recovery the gliders’ battery packs were replaced, the systems re-ballasted, checked out and readied for redeployment.
In order to manage the number of different assets in the water, as well as to provide a quick overview of the last available positions, a realtime operational display was designed and made available in the control center at MBARI, Figure 5. The display was developed in the beginning of the experiment and was continuously improved during the course of it. The display was automated and ran continuously during the experiment, which enabled the control room staff to closely monitor progress of the gliders and if necessary intervene. On several occasions the operators noted that the gliders were advancing only marginally over the course of several hours. This behavior was associated with strong head currents close to the southern end of the bay (i.e. Monterey); those currents were on the order of the gliders’ horizontal velocity. On other occasions the gliders’ progress was far above its theoretical
limits and continued slightly on shore. This behavior was observed three or four times and was attributed to fisherman “recovering” the equipment. The vehicles were retrieved from the recovery teams, checked out and re-deployed if necessary. The AOSN-II experiment successfully integrated all the above mentioned components and collected a valuable data-set for evaluation of various sampling strategies and modeling efforts. The performance of several multi-vehicle experiments during the course of AOSN-II show the potential for added value by using coordinated control strategies [2]. New tools are under development that allow for improved planning and monitoring of the observational assets which will provide a higher degree of autonomy during future deployments.
IV. FUTUREDEVELOPMENTS ANDAPPLICATIONS AT THE
INSTITUTE FOROCEANTECHNOLOGY
A. Newfoundland Ocean Observation, Modeling and Predic-tion Facility (NOOMPF)
A team of researchers from NRC-IOT, Memorial University of Newfoundland and Labrador (MUN) and the Department of Fisheries and Oceans (DFO) (R. Bachmayer and C. Williams from NRC-IOT, B. de Young, L. Zedel, N. Bose and S.
Trinity Bay
Conception Bay
Avalon Peninsula
Placentia BayFig. 6. Photo Credit: Earth Sciences and Image Analysis, NASA-Johnson Space Center. Candidate areas for implementation of an ocean observation, modeling and prediction system in Newfoundland. Note: North is to the right. Trinity Bay is approximately 140 km by 40km in size.
O’Young from MUN and F. Davidson from DFO) is currently developing a plan to implement a regional coupled ocean ob-servation and modeling system in Newfoundland (NOOMPF). Possible sites for implementation are Conception Bay, Trinity Bay and Placentia Bay as shown in Figure 6. The goal is to develop a capability for automated coupled ocean observations and model predictions on a regional scale. NOOMPF will integrate novel approaches to ocean sampling, modeling and prediction. The potential improvements in the modeling and prediction capabilities of the ocean will significantly enhance our ability to predict and manage the ocean as a resource for food production, transportation (e.g. ice-drift predictions), and exploration. This facility will also provide a unique testing ground for future developments in sampling strategies and technologies as well as a possibility to benchmark future improvements in the modeling and prediction of the ocean environment.
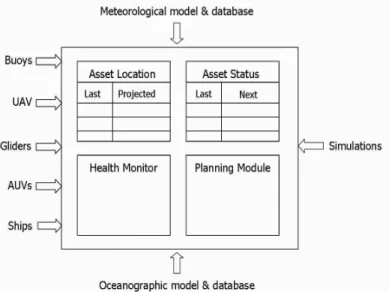
Observations will be based on a suite of different sampling platforms. We will perform conventional observations based on time series from moorings, weather stations and ships. In addition to those measurements we will utilize available data-products from satellites including AVHRR and Radarsat. Besides these assets several autonomous mobile platforms, such as autonomous underwater gliders and propeller driven AUVs will be deployed for extended periods of time. NRC-IOT’s role in the development of such a system is to develop the control and communication infrastructure necessary to direct and monitor the observational assets. We are going to develop an asset management tool (ASMT), Figure 7, that will serve as the main control and monitoring interface. The modular design of the tool will allow us to sequentially
develop and improve individual components of the system. In the baseline version the ASMT will provide a basic display of asset locations in an area of interest. Together with the first display module (Asset Location) a data interface will be developed that will allow us to access position information and collected data from a selection of platforms (i.e. gliders, AUVs, buoys, ships, etc.) as soon as they become available. Other parts to be developed include a planning module, a vehicle health monitor and a general asset status module. Some of these components, such as the planning module, require access to meteorologic and oceanographic databases and models. The vehicle health monitor will analyze data coming from the vehicles to provide an automated early fault detection mechanism to warn the operators of possible failures. The ASMT can also be used as a simulation and practice environment using real-time, recorded or generated data as inputs into the system.
Fig. 7. Schematic of Asset Management Tool for NOOMPF.
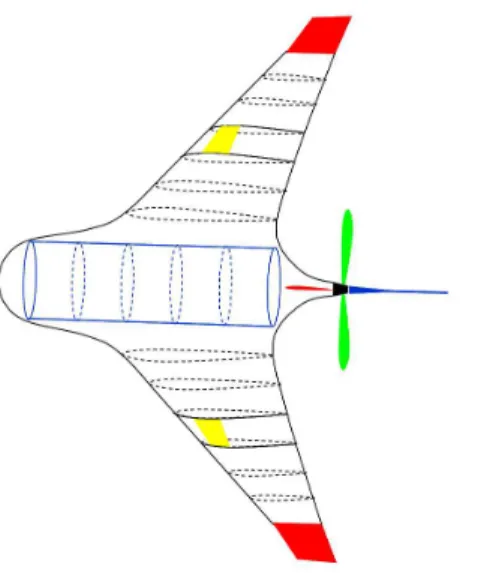
B. Laboratory Scale Glider
In order to complement the efforts described in Section IV-A, NRC-IOT is considering developing a laboratory-scale glider, Figure 8. The purpose of the laboratory glider is to conduct experiments for hydrodynamic testing and control and to provide a test-bed for new actuation and flow sensing technologies. We are planning to perform a complete system identification using recently developed mathematical models [6], [10], [5] and [4] and experiments. The glider’s mathe-matical model will be used to develop various parts of the ASMT, such as a health monitor and a planning module. The performance of those modules can then be evaluated using the data coming from the glider operating in our test facilities.
As a first step towards the design of a laboratory scale glider, we are currently investigating the design alternatives and constraints of a buoyancy engine. We decided to design the buoyancy engine for operations in up to 20 m of water-depth and a size such that it fits into a cylindrical housing of 10 cm in diameter. The particular characteristics of the engine,
Fig. 8. Conceptual drawing for a laboratory-scale glider.
such as volumetric rate and absolute displaced volume are to be designed such that the glider reaches a steady state glide within 2/3 of the depth of IOT’s towing tank (tank depth: 7m). In a next step we are going to perform vertical motion tests in order to evaluate the performance the buoyancy engine.
After the completion of the design of the buoyancy engine we are moving towards the hydrodynamic design of the glider. The design philosophy is to be able to build several glider hulls with significantly different hydrodynamic characteristics and reuse the electromechanical “internals” of the glider. This approach allows for experiments with uncommon designs such as flying wings or hybrid gliders (added propeller propulsion, see Figure 8) at a reasonable cost.
V. ACKNOWLEDGEMENTS
The authors would like to thank the Office of Naval Re-search for supporting our reRe-search for AOSN-II under reRe-search grants N00014-02-1-0826 and N00014-02-1-0861. We would also like to acknowledge the whole AOSN-II team for their support and insightful discussions that made the experiments such a success. The authors would also like to thank Christo-pher Williams, Brad de Young and Fraser Davidson for their roles in carving out a plan for NOOMPF.
REFERENCES
[1] T. Curtin, J. G. Bellingham, J. Catipovic, and D. Webb. Autonomous ocean sampling networks. Oceanography, 6(3):86–94, 1993.
[2] N. E. Leonard E. Fiorelli, P. Bhatta and I. Shulman. Adaptive sampling using feedback control of an autonomous underwater glider fleet. In
13th International Symposium on Unmanned Untethered Submersible Technology, Durham, NH, USA, August 2003.
[3] C. C. Eriksen, T. J. Osse, R. D. Light, T. Wen, T. W. Lehman, P. L. Sabin, J. W. Ballard, , and A. M. Chiodi. Seaglider: A long-range autonomous underwater vehicle for oceanographic research. IEEE Journal of Oceanic
Engineering, 26(4):424–436, October 2001.
[4] Joshua G. Graver, Ralf Bachmayer, Naomi Ehrich Leonard, and David M. Fratantoni. Underwater glider model parameter identification. In 13th International Symposium on Unmanned Untethered Submersible
Technology, Durham, NH, USA, August 2003.
[5] Joshua G. Graver and Naomi Ehrich Leonard. Underwater glider dynamics and control. In 12th International Symposium on Unmanned
Untethered Submersible Technology, Durham, NH, USA, August 2001.
tonomous underwater gliders. IEEE Journal of Oceanic Engineering, 26(4):633–645, October 2001.
[7] A. R. Robinson. Forecasting and simulating coastal ocean processes and variabilities with the Harvard Ocean Prediction System. In C.N.K. Mooers, editor, Coastal Ocean prediction, AGU Coastal and Estuarine Studies Series, pages 77–100. American Geophysical Union, 1999. [8] J. Sherman, R. E. Davis, W. B. Owens, and J. Valdes. The autonomous
underwater glider ”Spray”. IEEE Journal of Oceanic Engineering,
26(4):437–446, October 2001.
[9] Henry Stommel. The Slocum Mission. Oceanography, 2:22–25, 1989. [10] Andrey Vladimirovich Ulanov. Optimization criteria and hierarchy
of mathematical models of an underwater gliding vehicle. In Third
International Shipbuilding Conference ISC’2002, St. Petersburg, Russia,
October 2002.
[11] D. C. Webb, P. J. Simonetti, and C. P. Jones. SLOCUM: An underwater glider propelled by environmental energy. IEEE Journal of Oceanic
![Fig. 4. Diagram of Real Time Operations Plan for AOSN-II. LCS stands for Lagrangian Coherent Structures, ROMS for Regional Ocean Model (JPL/UCLA) and HOPS for the Harvard Ocean Prediction System [7].](https://thumb-eu.123doks.com/thumbv2/123doknet/14192064.478262/4.918.192.727.82.509/diagram-operations-lagrangian-coherent-structures-regional-harvard-prediction.webp)