Complexity Management Through Product Portfolio Cost Modeling and Optimization
by
Peter Sommerkom
B.S. Mathematics, B.S. Mechanical Engineering, University of Utah, 2009
Submitted to the MIT Sloan School of Management and the Engineering Systems Division in Partial Fulfillment of the Requirements for the Degrees of
Master of Business Administration and
Master of Science in Engineering Systems
ARCHNES
In conjunction with the Leaders for Global Operations Program at the ,ASSA E IS E
Massachusetts Institute of Technology oF TECHNOLOGY
June 2013
MAY 3
p213
C 2013 Peter Sommerkorn. All rights reserved.
LiBRARIES
The author hereby grants to MIT permission to reproduce and to distribute publiclypaper and electronic copies of this thesis document in whole or in part in any medium now known or hereafter created.
Signature of Author
Engineering Systems Division, Mf Sloan Sc'1001 of Management May 10, 2013 Certified by
Roy F/ Welsch, Thesis Supervisor Professor of Statistics and Managenent Science, Sloan School of Management Certified by
Deborah Nightinjle, The( Supervisor Professor of the Practice, A tics and Astronautics and Engineering Systems Division
Accepted by - --- _
Oli de Weck, Chair, Engineering Systems Education Committee Associate Professor of Aeronautics and Astronauticq and Engineering Systems Accepted by
Complexity Management Through Product Portfolio Modeling and Optimization
by
Peter Sommerkorn
Submitted to the MIT Sloan School of Management and the Engineering Systems Division on May 10, 2013 in Partial Fulfillment of the Requirements for the Degrees of Master of
Business Administration and Master of Science in Engineering Systems Abstract
A significant amount of complexity exists within the brand and product portfolios of PharmaCo. This complexity is driven by several factors: first, medical needs for differing products and dosages; second, marketing requests for new configurations of current product offerings; third, unique regulations and requirements for individual country markets; fourth, product portfolio growth from acquisition activity. This complexity increases both
production costs and support costs (such as planning and procurement) for PharmaCo. The focus of this project is to reduce the complexity in the brand and SKU portfolios at
PharmaCo.
Two approaches can be utilized to reduce complexity in the product portfolio. First, measures can be taken to reduce already existing SKUs and brands. This has largely been the focus of previous efforts at PharmaCo, although additional work remains in this area. Previous analyses have focused on providing recommendations for pruning specific SKUs and divesting or pruning specific brands. Second, measures can be taken to manage the future proliferation of SKUs and brands in order to control future complexity growth. This approach has been largely unaddressed in previous internship projects and will be a major focus of the current project.
It is first necessary to clearly understand all costs that are associated with complexity. Consequently, the first step of this project was to conduct site visits with multiple plants in order to learn all costs that are impacted by complexity. At these site visits, cross functional groups involved in all aspects of operations at the site were identified and consulted.
Additionally, Marketing was contacted to understand complexity costs that affect
Marketing. Both cost elements will be combined to develop a complexity cost model. This model is being piloted and applied to a stable brand that still has level or increasing volumes over the next several years.
Thesis Supervisor: Deborah Nightingale
Title: Professor of the Practice, Aeronautics and Astronautics and Engineering Systems Thesis Supervisor: Roy Welsch
Acknowledgments
I would like to acknowledge Don Rosenfield and the Leaders for Global Operations Program for the support, insight, and guidance that have been offered throughout this project. I would also like to thank my advisors, Roy Welsch and Debbie Nightingale, for
supporting this research. Their advice and oversight was invaluable in completing this work. I would like to thank my supervisor and colleagues at PharmaCo. These individuals have offered incredible support and help. They have been completely open and welcoming and their involvement has been essential to this work.
Finally and most importantly, I would like to thank my wife, Liz. Without her support and patience, none of this would have been possible.
Table of Contents A b stract ... 3 Acknowledgm ents...5 Table of Contents ... 7 List of Figures ... 10 1 Introduction...11
1.1 Trends in the Pharmaceutical Industry ... 11
1.2 Pharm aCo ... 12
1.3 M otivation and Problem Statement ... 13
1.4 Hypothesis ... 13
1.5 Thesis Outline...13
2 Literature Review ... 15
3 Complexity Drivers ... 20
3.1 Lifecycle Activities Complexity...20
3.1.1 Launch...20
3.1.2 Local M anufacturing... 21
3.1.5 D ivestm ent ... 23
3.1.6 Licensing-in ... 24
3.1.7 Co-m arketing ... 24
3.2 Business M odel Com plexity... 25
3.2.1 Final Drug D elivery Form ... 25
3.2.2 D osage Level ... 26
3.2.3 Sales Channel... 26
3.2.4 Business U nit A utonom y... 27
3.2.5 V aried M arkets and G eographies... 27
3.2.6 Legacy Products... 28
3.2.7 Products W ith Special Requirem ents... 28
3.2.8 Representative Example of Complexity Proliferation ... 28
4 Com plexity Cost M odels... 30
4.1 Bottom -up Com plexity Cost M odel... 30
4.1.1 A pproach...30
4.1.2 Site V isit...32
4.2 Top-down Complexity Cost M odel... 35
4.2.1 Approach...35
4.2.2 A ssum ptions... 37
4.2.3 M odel...41
4.2.4 Results...41
5 Case Study - Safety Stock Holding Costs ... 47
5.1 Business Unit SKU Reduction Pilot ... 47
5.2 Approach ... 49
5.2.1 The Square-root Rule ... 50
5.2.2 Classic Inventory M anagement M odel... 51
5.3 Results ... 53
6 Conclusion...56
6.1 N ext Steps and Further W ork ... 57
Appendix ... 59
List of Figures
Figure 1: Wilson and Perumal's framework for managing complexity[2]...15
Figure 2: Collinson and Jay's complexity curve[3]. ... 16
Figure 3: Anderson, Hagen, and Reifel's root causes of complexity[5]...18
Figure 4: Anderson, Hagen, and Reifel's approach to a component-based portfolio[5]...19
Figure 5: Complexity drivers and product offering proliferation. ... 29
Figure 6: Bottom-up complexity cost model approach...31
Figure 7: Mapping of complexity cost drivers to resources and activities...32
Figure 8: Top-down complexity cost model approach...37
Figure 9: Comparison of single-SKU and multi-SKU cost model assumptions...41
Figure 10: Complexity costs derived from top-down model. ... 42
Figure 11: Complexity cost breakdown (proportional)...42
Figure 12: Comparison of production batches required (normalized to scale of 100)...43
Figure 13: Comparison of required machinery (normalized to scale of 100)...43
Figure 14: Comparison of required labor (normalized to scale of 100)...44
Figure 15: Comparison of required material costs (normalized to scale of 100)...45
Figure 16: Comparison of non-labor and non-material costs (normalized to scale of 100)...46
Figure 17: SKU reduction pilot for Country X business unit ... 48
Figure 18: Reduction in safety stock holding costs due to SKU consolidation. ... 54
Figure 19: Safety stock holding cost reduction to consolidated SKU pairs...55
Figure 20: Plant granulation, tabletting, and coating layout. ... 59
Figure 21: Plant packaging layout... 59
1 Introduction
1.1 Trends in the Pharmaceutical Industry
The pharmaceutical industry as a whole has been very profitable over the past several decades. However, this profitability is increasingly coming under pressure. As a result, major players in the industry are increasingly looking for ways to manage costs and maintain profitability.
Expiring patents and the introduction of new generic competitors have contributed to the pressure on profitability for major pharmaceutical companies. In 2000, generics
comprised 49% of market share. By 2011, generics are estimated to have been 80% of market share in the pharmaceutical industry[1]. Generic drug introduction typically
decreases prices significantly, often driving margins for a specific drug to a fraction of the level before generic drug introduction.
The industry is also marked by very high R&D costs and relatively large amounts of intangible assets. The intangible assets typically take the form of patents or intellectual property (IP). Industry-wide R&D spending exceeded $50 billion in 2010 and typically represents 17% of revenues for major pharmaceutical companies [1]. The cost to develop a new drug currently stands at $1.2 billion and typically takes 10 to 15 years [1]. Companies in the industry are increasingly competing by investing in increasingly expensive drug development pipelines.
These factors are expected to continue to play a role in putting pressure on profitability in the coming years. Other factors, such as legislation, also may play a large
role. For these reasons, companies in the industry are increasingly looking for ways to reduce costs and maintain or improve profitability.
1.2 PharmaCo
PharmaCo is a major pharmaceutical company with operations across the world. PharmaCo manufactures drugs for both prescription and over-the-counter uses, although a large majority of PharmaCo's products are intended for prescription use. PharmaCo also operates in adjacent businesses, such as biopharmaceuticals and vaccines, that complement the company's core strengths in the chemical-based pharmaceutical sector.
PharmaCo is an industry leader in many functional areas. PharmaCo is particularly strong in operational capabilities and quality control. PharmaCo operates manufacturing facilities in geographies spread across the world and sells products in over 100 countries. PharmaCo is a leader in many product sectors, such as oncology and hypertension. PharmaCo sells products through a variety of channels with the primary channels being hospitals, pharmacies, and government agencies.
PharmaCo has experienced rapid growth for much of its history, especially in the recent past. This growth has helped PharmaCo to become a dominant entity in the industry and allowed the company to achieve strong profitability. However, the fast pace of growth has also caused PharmaCo to focus efforts in several different directions. Opportunities for strengthening the company's internal operations even more certainly exist and can lead to yet another source of market dominance.
1.3 Motivation and Problem Statement
In response to industry trends and in an effort to maximize profitability, PharmaCo has implemented a very successful program of operational excellence over the last several years. This program has materialized in a variety of forms, from shop-floor Lean projects to supply chain optimization. These efforts have led PharmaCo to analyze the composition of their product portfolio. PharmaCo has determined that the company's product portfolio has grown tremendously in the last several years. This has led to a conclusion that the complex product portfolio may not be optimally profitable. Complexity in the product portfolio creates many additional costs, some of which are not obvious under the current reporting systems. As a result, PharmaCo has initiated an effort to identify and manage complexity in the product portfolio.
1.4 Hypothesis
We propose that complexity costs caused by the varied product portfolio at
PharmaCo are significant but can be managed. We propose that these complexity costs can be identified through development of a complexity cost model and that consolidation of product offerings can provide valuable cost savings to the organization.
1.5 Thesis Outline
In Chapter 2, we conduct a brief review of the literature and work that has been done concerning complexity management. A large portion of this work concerns complexity management for a variety of industries but is applicable to our case in the pharmaceutical industry.
In Chapter 3, we perform an analysis of the key drivers of complexity at PharmaCo. These complexity drivers can be extended to the general pharmaceutical industry.
In Chapter 4, we present two approaches to developing complexity cost models. The output of the latter model is also presented.
In Chapter 5, we present a case study of a pilot program to consolidate product offerings in one of PharmaCo's business units. This effort to reduce complexity demonstrates the benefits of managing complexity in the product portfolio.
In Chapter 6, we present our conclusions, key findings, and suggestions for future work.
2
Literature Review
Wilson and Perumal describe three types of complexity: product complexity, process complexity, and organizational complexity[2]. Product complexity arises from the variety of products and services that a company offers. Process complexity arises from the work required to maintain and offer product complexity, such as rework, coordination, and redundant production processes for slightly different customers. Organizational complexity arises from features of the organizational structure that are required to support product complexity, such as staffing, assets, and multiple production sites.
Wilson and Perumal also propose a framework for dealing with complexity[2]. This framework includes two approaches, as shown in Figure 1 below: either reduce the amount of complexity or make complexity less expensive.
Reduce Make complexity
amount of
-es
e
xpensivecomplexity E EE
Collinson and Jay have explored the nature of complexity and how it affects the profitability of an organization[3]. They break complexity into two categories: good complexity and bad complexity. Through their research, they have developed an index to classify companies according to their complexity. This has led to Figure 2 below. Collinson and Jay state that there is a tipping point, after which complexity works against improved performance and profitability of the overall organization[3]. They also point out that in the pharmaceutical industry, increased pressure for consolidation has driven a significant amount of merger and acquisition activity. This in turn leaves companies in the industry with the added challenge of integrating an acquired organization into the parent
organization. This compounds complexity. This is further compounded by intense research and development (R&D) spending, vast and disconnected operating units, and over-engineering of processes. This in turn causes more complexity, disjointed coordination between operating units, and strategic misalignment.
Profit (EBITDA) = 10.2% U U U U
GOOD COMPLEXITY BAD COMPLEXITY
Improves your performance Increases cost and destroys value
Complexity
Wilson and Perumal further propose that bad complexity (for example, extra
production planning due to offering nearly-identical products) should be eliminated and that good complexity (for example, offering two different brands that cater to different customer needs) should be made less expensive. Thus, methods to the left of Figure 1 can be used to attack bad complexity and methods to the right of Figure 1 can be used to attack good complexity.
Byrne prescribes a three-pronged approach to dealing with complexity[4]: first, study products from the consumer's point of view in an effort to identify those worth keeping;
second, identify SKUs that serve unique channels; third, execute an initiative to eliminate products that have failed to meet customers' needs or achieve a minimum threshold of demand. Byrne argues that companies often implement these three approaches individually. However, he shows that it is necessary to implement the three approaches together to achieve lasting and impactful complexity reduction.
Byrne also points out that consolidating a product portfolio to reduce complexity often focuses on cutting (also termed pruning) the lowest-volume SKUs. For example, a company will often dictate that the 5% of lowest demand SKUs be pruned. Byrne, however, states that this will yield very meager results in improving profitability because these SKUs have such limited volume that their elimination does very little to change the dynamics of the product portfolio. Rather, Byrne states that effective complexity reduction programs must focus on SKUs in the middle of the volume curve[4]. Carefully designed and executed efforts focusing on these higher volume SKUs have the potential to achieve significant and lasting complexity reductions that will improve profitability.
Anderson, Hagen, and Reifel document the root causes of complexity as well as the tradeoffs between complexity and customization[5]. They describe complexity as the result of several isolated decisions, all made with the intention of winning the customer by offering customized products. However, these decisions unintentionally create a complex system of increased operating costs, new processes, and inefficient practices. Figure 3 below shows their description of the root causes of complexity.
oii le it
Source: A. T Keamey I-.-!
Figure 3: Anderson, Hagen, and Reifel's root causes of complexity[5].
Anderson, Hagen, Reifel discuss modifying a company's system so as to create a simplified and component-based product portfolio[5]. This starts by locating complexity in the organizations and then modifying the way that customization is introduced into the product portfolio to create component-based offerings. Their representation of the
relationship between the component-based product portfolio and profitability is shown in Figure 4 below.
Adjust complexity of the offering once component-based systems and processes are in place
New products systems
and processes
Current product offering,
systems and processes
Develop component-based products, systems
Elimmate and processes
destroy value
Current product Product variety
Source: A T Kearney or service offering
Figure 4: Anderson, Hagen, and Reifel's approach to a component-based portfolio[5].
With this understanding of the previous work on complexity management, we move on to an analysis of the drivers of complexity at PharmaCo.
3 Complexity Drivers
In order to develop a better understanding of complexity costs at PharmaCo, a study of the underlying causes and drivers of complexity in the product portfolio was undertaken. These complexity drivers can be viewed from two different perspectives: complexity arising from product lifecycle activities or complexity arising from the structure of PharmaCo's business model. Both of these perspectives will be considered. Understanding how these drivers create and contribute to complexity in PharmaCo's product portfolio will be valuable in developing a complexity cost model.
3.1 Lifecycle Activities Complexity
When considering lifecycle activities, it is important to note that, in addition to the level of complexity, these activities may also affect the profitability, growth, and cost of goods sold (COGS) of the overall product portfolio. The following primary lifecycle activities were identified as having the largest effect on complexity.
3.1.1 Launch
Launching a new product increases the overall complexity in the product portfolio. This is simply a result of at least one new SKU being generated in the company's system and often, a newly launched product can result in several new SKUs (for example,
corresponding to different dosage levels or varying package configurations). A new product offering also often requires new production processes on the factory floor and, in some cases, new processing equipment. This also increases production complexity associated with the new product offering. Under normal circumstances, launching a new product should positively affect overall company growth as the new product offering captures new customers. Profitability (in an absolute sense) should generally be affected positively by
launching a new product; it may be the case that hidden complexity costs make a new product less profitable than anticipated, but the general effect from a new product should be at least positive as a business case justifying the launch is required before introduction. Finally, the ratio of cost of goods sold (COGS) in the product portfolio could be affected negatively or positively depending on whether the new product is more or less profitable than the current aggregate product portfolio.
3.1.2 Local Manufacturing
Manufacturing products locally refers to production that occurs in close proximity to the end user. Often this arises from requirements by a government or regulatory body that the pharmaceutical company manufactures in the region or country where the products will be sold. However, this can also be driven by a desire to react quickly to local market needs or to more fully tailor production of a product to local market preferences. Local
manufacturing almost certainly increases complexity in the production system of PharmaCo. Local manufacturing often requires a new site, a significant factor in increasing complexity. A technology and process transfer to the new site must also take place, both of which can be very complicated tasks. A new drug product variant is required for a new local site.
Additionally, establishing a new local site, particularly in an area that PharmaCo has not previously operated in, introduces an increased risk for quality and compliance issues. It is unclear whether local manufacturing will increase or decrease overall profitability (in an
absolute sense) due to the many factors and costs detailed above; in some cases, PharmaCo may produce products locally with a negative margin in order to gain access to a strategic market. However, local manufacturing will typically have the effect of increasing growth of
overall products sales as the new markets are served. Finally, local manufacturing will almost always increase the overall COGS ratio of the entire product portfolio.
3.1.3 Site and Supplier Consolidation
Initiatives to reduce the number of production sites that PharmaCo operates have become increasingly more common. In these cases, it is assumed that total production volumes will remain constant and not decrease. Consolidating production sites in this manner increases the utilization of capital equipment and often eliminates multiple manufacturing locations for a given drug, thereby reducing end-product variation. These efforts to consolidate manufacturing sites decrease the total complexity in the production system. Similarly, initiatives to reduce the number of suppliers also reduce complexity by simplifying sourcing operations and reducing variability from multiple sources. These consolidation efforts, under the assumption that volumes are simply transferred and not reduced, results in no effect on overall growth of sales volumes. Overall profitability (in absolute terms) is increased as overhead costs are reduced and redundancies in operations are eliminated. Additionally, the overall COGS ratio of the product portfolio is improved as the direct costs of manufacturing and sourcing are streamlined.
3.1.4 Brand and SKU Elimination
Brand elimination, also known as pruning, represents an initiative whereby entire brands are discontinued and cut out of the product portfolio. This can be done at a more focused SKU level, but eliminating entire brands results in larger impacts on complexity, profitability, growth, and the COGS ratio. SKUs or brands can be eliminated for a variety of reasons, including low demand volumes, remaining remnants from acquisition activity that fit poorly in the product portfolio, or a changing strategic or competitive landscape. When a
SKU or entire brand is pruned, the overall complexity of the product portfolio decreases as there are fewer SKUs being produced in the portfolio. Growth of overall sales revenue is decreased as it is assumed that the demand for the pruned SKUs is not necessarily
transferred to other existing SKUs. Overall profitability (in absolute terms) can either increase or decrease, depending on the margins of the SKUs or brand being eliminated. It is reasonable to expect that some pruning candidates will have negative margins as volumes have decreased, causing the SKUs or brand in questions to have been identified for pruning.
Similar to profitability, the overall COGS ratio of the entire product portfolio can also increase or decrease depending on the characteristics of the SKUs or brand being pruned.
3.1.5 Divestment
The impacts of divestment activities are very similar to those of brand elimination activities. However, in divestment initiatives the SKUs or brands that are identified are sold to other entities instead of simply being discontinued. Here also, individual SKUs or entire brands can be divested, although entire brands are much more common as an individual SKU would have to fit into the new entity's production and product offering systems. Divestment decisions must be evaluated carefully so as to avoid giving away strategic or competitive advantages to other entities. Divestment activities will decrease the amount of complexity in the production system and product portfolio as the number of SKUs in PharmaCo's portfolio is being directly reduced. Growth of revenue will decrease as it is assumed that the volumes of the divested products are not being transferred to another existing SKU or brand. The overall profitability (in absolute terms) of the product portfolio may increase or decrease, depending on the margins of the SKUs being divested. Similarly,
whether the COGS ratio of the divested SKUs is higher or lower than that of the entire portfolio.
3.1.6 Licensing-in
In some circumstances PharmaCo may seek to obtain licensing rights from another company for a particular product or brand. This activity is very common in the industry as patents and IP play such an important and long-term role. Licensing-in new products will typically require PharmaCo to create and maintain a new internal brand along with
associated SKUs, increasing overall complexity in the production system. In some cases, a new production site may be required; at the very least, new processes will be required. These factors both also increase complexity in the production system and the product portfolio. Growth of overall sales revenues is increased as the new products capture new customers. Overall profitability (in absolute terms) increases as it is assumed the PharmaCo will only license-in new products that will realize a positive profit margin. The impact on the overall COGS ratio of the product portfolio may increase or decrease, depending on whether the COGS ratio of the new licensed products is higher or lower than the aggregate COGS ratio for the entire product portfolio.
3.1.7 Co-marketing
Co-marketing arises when PharmaCo partners with another party in an agreement to utilize the partner's sales and marketing force to sell PharmaCo's products. This often arises when PharmaCo doesn't have a strong presence in a particular market or geography but the partner does. This allows PharmaCo to still generate revenue and sales without making the investments required to establish its own sales and marketing operations in the given location. Additionally, the co-marketing partner often has key relationships with customers
or regulatory bodies in the target market. Co-marketing increases complexity in the product portfolio due to the new SKUs and product packaging that must be generated in order to sell into the new target market. Growth of overall sales revenues will increase as new customers are captured that were previously not purchasing PharmaCo products in the target market. Overall profitability (in absolute terms) will increase as new profitable sales are generated. The impact of the overall COGS ratio of the product portfolio will increase; this occurs because the new co-marketed SKU starts with a COGS ratio that is similar to that of the existing SKU sold directly by PharmaCo but then adds costs related to the revenue sharing agreement with the co-marketing partner in the target market.
3.2 Business Model Complexity
Several aspects of the products that PharmaCo offers and the way that PharmaCo structures its business operations contribute to complexity within the product portfolio. This complexity affects both the size and scope of the portfolio itself as well as the underlying production systems and costs. As a result, it is important to understand the key aspects that drive complexity, especially if a complexity cost model is to be constructed.
Complexity due to the business model is driven by several factors: the final drug delivery form, the dosage level, the sales channel, autonomous PharmaCo business units, varied markets and geographies that PharmaCo serves, legacy products from acquisition or divestment activities, and special requirements preventing the phasing-out of certain
products. In general, all of these aspects increase complexity in the product portfolio and in the production systems.
In many cases, PharmaCo offers a given drug product in several different final delivery forms. PharmaCo's products can take the form of tablets, sprays, gels, capsules,
syrups, creams, and a variety of other possibilities. Offering the same drug in various final delivery forms requires additional manufacturing processes, additional packaging processes, an increased number of substances from suppliers, and additional SKUs. Additionally, even
if multiple final delivery forms for a single drug product are neglected, multiple final delivery forms for different drug products still require different manufacturing equipment, suppliers, and production processes.
3.2.2 Dosage Level
For a given drug in a given final drug delivery from, PharmaCo often offers multiple dosage levels. For example, PharmaCo may produce and offer a drug in tablet form in
50mg, 100mg, and 150mg dosage levels. These different dosage levels are sometimes required by regulation and sometimes offered to meet customers' desire for flexibility in dosing. Multiple dosage levels require unique SKUs, unique packaging (typically), and separate production processes. All of these factors increase complexity.
3.2.3 Sales Channel
PharmaCo offers its products through many different channels. For example, products may be sold to hospitals, pharmacies, or clinics. The different channels often require different pricing and packaging. Additionally, channels such as hospitals are often offered samples packs, typically consisting of a few dosages. These sample packs are intended to be used as an introductory trial by doctors in order to secure new customers. These considerations usually require separate SKUs (and often unique production processes), increasing complexity.
3.2.4 Business Unit Autonomy
PharmaCo is a large company but makes efforts to operate as a flat organization in many respects. Accordingly, PharmaCo gives its business units (which are often organized by country) a large amount of autonomy in planning product offerings and making decisions to launch new products. While this model certainly has many advantages, it can often lead to a wide variety of similar but different products being offered across country business units. For example, the France business unit may decide that customers in France will respond most favorably to Drug X when it is offered in a 4x5 blister pack, while the Germany
business unit may decide that customers in Germany will respond most favorably to Drug X when it is offered in a 3x7 blister pack. This phenomenon, when spread across business units all over the world and across hundreds of different drug products, can result in a significant number of similar but different SKUs in the overall product portfolio. This increases
complexity very rapidly.
3.2.5 Varied Markets and Geographies
PharmaCo is a global company and, as such, operates in numerous markets spread out all over the world. The size of the markets range from some of the largest countries in the world to much smaller, localized geographies. Often, these markets have unique regulatory agencies and requirements for pharmaceutical products. These varying
regulations can require different packaging, process control, and supplier selection. All of these factors require unique SKUs for products of the same drug brand that will be sold in the different markets, increasing complexity in the product portfolio and production systems.
3.2.6 Legacy Products
PharmaCo has acquired many other entities and divested many brands over the course of its history. During acquisitions, PharmaCo sometimes obtains products that were not the primary target and do not fit particularly well in PharmaCo's product portfolio.
Similarly, during divestments, PharmaCo may be left with a few products or SKUs that no longer fit particularly well in the product portfolio. Over time, PharmaCo has accumulated a number of SKUs and brands with low volumes and little strategic fit, increasing the
complexity within the product portfolio and production system.
3.2.7 Products With Special Requirements
Finally, there are certain products that PharmaCo produces that the company must continue to produce, regardless of demand volumes and profitability. The most common case of this occurs when PharmaCo produces a drug for which there is a stipulated medical need by regulatory authorities and PharmaCo is obligated to continue to supply this drug. PharmaCo often agrees to supply these medical need drugs as a condition of gaining access to a market for another drug or product. These medical need drugs often become
unprofitable, especially when volumes for them are low, which can often be the case. They also require SKUs, production processes, and distribution, all of which add complexity to PharmaCo's product portfolio and production systems.
3.2.8 Representative Example of Complexity Proliferation
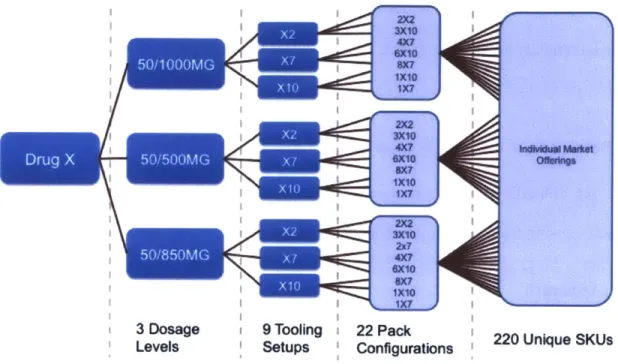
Figure 5 below shows how some of the complexity drivers described in this section can cause complexity to increase very quickly in the product portfolio. In this example, different dosage levels, pack configurations, and target market packaging requirements contribute to the SKU proliferation from a single drug product. However, any of the other
complexity drivers described in this section could similarly cause an increase in the product portfolio complexity. This simple example indicates the vast scale of complexity at
PharmaCo across scores of different drug products and brands.
I I7
3 Dosage 9 Tooling 22 Pack Levels Setups Configurations
2ffiJ
220 Unique SKUsFigure 5: Complexity drivers and product offering proliferation.
In the next chapter, we use this understanding of the complexity drivers at PharmaCo to develop a complexity cost model.
4 Complexity Cost Models
The first step in devising a strategy to deal with complexity in the product portfolio and the production system is to understand the scale of complexity at PharmaCo.
Additionally, it is important to understand what products and activities are contributing the most to complexity and the associated costs. In order to address this, an initiative to develop a complexity cost model has been undertaken.
4.1 Bottom-up Complexity Cost Model
The first effort to construct a complexity cost model focused on a bottom-up approach, starting from an individual SKU at a plant level.
4.1.1 Approach
The key premise underlying the bottom-up cost model is to consider how complexity is affected by creating a single, new SKU in the product portfolio. The intent is to determine every activity that must occur in order to create the new SKU and to map appropriate costs to each of these activities.
Due to the way that cost accounting is employed at PharmaCo, there are many indirect costs related to creating a new SKU that may not be directly allocated to the SKU's costs. The primary costs allocated to a new SKU (and included in the business planning process) are direct labor and material costs for production. Costs related to new capital equipment that is required and marketing costs related to the product launch may also be included. However, production costs related to additional equipment changeovers and setups are typically not included. Additionally, time and labor required by planners, material
purchasers, lifecycle managers, brand managers, and other supporting agents are typically not included in the costs required to launch and maintain a new SKU.
In order to clearly understand and evaluate all activities related to creating a new SKU, a site visit was planned. At the site visit, meetings were arranged with all functional groups that could be affected by the creation of a new SKU. This included plant
management, production planners, production supervisors, material purchasers, packaging artwork managers, sales and marketing staff, lean manufacturing project leaders, financial analysts, and a variety of other functional representatives.
A large motivation behind making this effort to understand all costs associated with creating and maintaining a new SKU in the product portfolio is the desire to determine some cost metric to represent complexity for future business planning. It was anticipated that there would be some variation in the different tasks required to create SKUs in different scenarios, but it was hoped that the different scenarios could be aggregated to a representative cost adjustment. This could be applied to the direct costs for new products, giving a more representative estimate of the true costs to launch and maintain a new SKU. This would be inclusive of costs due to complexity.
4.1.2 Site Visit
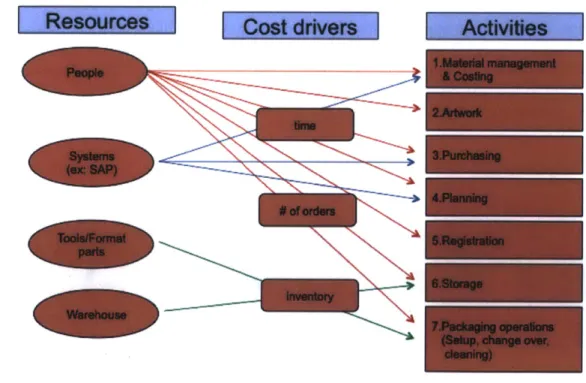
At the site visit, the group including the functional representatives described above was assembled. An exercise was first conducted to discuss the complexity cost drivers and how they affect operations at the plant level. A key insight which holds at the plant level became apparent: the primary cost drivers are time (i.e. setup time), number of orders processed through a given piece of equipment in a given period of time, and inventory generated by the operating activities. These cost drivers are affected by the resource allocation in the plant, which in turn map to activities. The relationship between the plant-level resources, cost drivers, and activities was mapped out in order to better understand where the largest cost impacts might be occurring. This mapping, which is specific to the plant-level, can be seen below in Figure 7. This shows that people should be the resource with the widest range of impact on costs through the many activities that this resource maps to.
Using this mapping as a guideline, a list of various basic scenarios for which new SKUs is generated. This list primarily consisted of the following general groupings:
e New brand launch
e New market introduction (or new geography introduction) for an existing brand " New configuration offering (e.g. 4x6 blister pack) for an exiting brand
" Packaging update (driven by either marketing or regulatory requirements)
" New sales channel offering for existing product (e.g. channel-specific packaging or product configuration)
e New packaging format due to supplier offerings, supply chain constraints, or supplier discounts
After generating this list of scenarios for creating a new SKU, process maps were created of all activities required for each scenario. These process maps were broken down into the most basic component activities possible with the associated employees that would be affected or required to take action. Corresponding estimates of the amount of time for each action and employee were also determined.
4.1.3 Results and Outcome
Mapping out the processes and activities for creating a new SKU under different scenarios resulted in several key insights into understanding complexity at PharmaCo. It was discovered that the number of activities required to create a new SKU was subject to
significant variation. Depending on the circumstances, as few as five or as many as 3,000 activities might be required to create a new SKU. Accordingly, creating a new SKU might
(often spread across several months). A preliminary analysis of the distribution of the different scenarios was equally varied, meaning that one representative set of activities and costs corresponding to creating a new SKU is very difficult to define.
This variation causes a significant impediment to developing a bottom-up cost model. Because the number of activities, and by extension costs, to create a new SKU vary significantly, a single metric representing the cost of complexity for new SKUs would be largely unrepresentative of a majority of the instances where a new SKU is created. As a result, an approach different to the bottom-up approach must be undertaken and will be described later.
However, the effort to develop a bottom-up approach did also yield some valuable insights into complexity. As discussed previously, the effort led to a definition of the general circumstances that drive the generation of new SKUs at the plant level. This is valuable for both plant operational planning and central plant allocation planning in order to minimize unnecessary costs and production interruptions. Additionally, the effort also led to the development of a model to understand the relationship between resources, cost drivers, and activities at the plant level (as shown previously). This is helping to guide decisions related to batch sizes, order frequency, and personnel allocation.
Finally, the effort to understand new SKU generation at the plant level led to
discussions about approaches at the plant level to deal with complexity caused by a complex product portfolio. These approaches were based on Lean manufacturing principles. The following examples were cited:
e Harmonizing production to run larger batch sizes, better utilizing equipment * Standardizing tube diameters for different product offerings of similar creams,
enabling bulk discounts on materials and higher trucking utilizations in shipping All of these examples led to very significant cost savings at the plant level. More importantly, these examples led to a key finding: bottom-up, SKU-level complexity
management should focus on optimizing operations through Lean principles and should be directed at the plant level (as opposed to the division or corporate level). Significant process savings can be realized through following this recommendation.
4.2 Top-down Complexity Cost Model
Due to the limitations of the bottom-up model, a different method of modeling the cost due to complexity in the product portfolio was devised. This method focuses on a top-down approach that aggregates complexity in a plant into a single bucket. While potentially less precise than the bottom-up model, the top-down model provides a better sense of the magnitude of complexity costs.
4.2.1 Approach
The concept of a plant that produces only a single brand and single SKU underpins the top-down complexity model. First, consider a plant in PharmaCo's production network. The current production costs on an annual basis are known. These production costs are the result of producing a varied product portfolio consisting of many brands and SKUs.
The next step in building the top-down complexity cost model is to simulate what production costs would be if only a single SKU were produced at the same plant. This
requires an in-depth understanding of the plant being analyzed, particularly in the following areas:
" Labor: direct operators, supervisors, and other overhead staff (such as quality assurance, managers, production planners, accounting staff, etc.)
e Capital equipment: granulation machinery, tableting machinery, coating machinery, and packaging machinery
e Manufacturing processes: batch sizes, setup durations and frequencies, line changeover durations
* Material requirements: purchasing prices and discounts due to volume purchases e Warehousing and distribution: inventory holding space and costs, shipping
methods and utilizations
With an in-depth understanding of these components and the plant's current cost structure, approximations of how these costs will change under the condition that only a single SKU is produced can be made. Interactions between components must also be considered (for example, a streamlined packaging machinery can result in additional labor savings beyond the direct labor saved by eliminating extra changeovers and cleanings as operator efficiency increases as a result of operating fewer types of equipment).
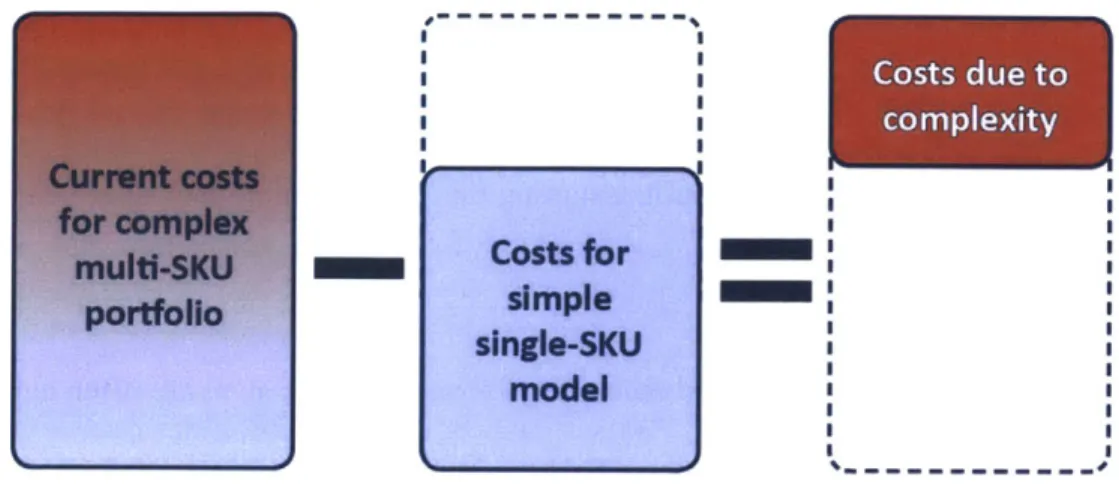
After the model approximating the plant's costs when producing a single SKU is completed, these costs can be compared with the current actual costs corresponding to a varied product portfolio. The difference between the annualized costs of a single-SKU plant and the annualized costs of the multiple-SKU plant is then the aggregated cost of complexity due to producing a varied product portfolio.
I I S I I I I I I * I * I Cost for single-SKU
Figure 8: Top-down complexity cost model approach.
4.2.2 Assumptions
The assumptions underpinning the top-down complexity cost model are critical in understanding this general approach to understanding complexity at PharmaCo. These assumptions are detailed below.
4.2.2.1 Model Fundamentals
The model must present information that can be reasonably extended to the entire network and product portfolio. Consequently, the model is built around a plant that is representative of the majority of plants at PharmaCo. The primary criteria for this characteristic were size of the plant, product mix, production volume, margin, and production cost. Similarly, the single brand and SKU for the analysis is chosen to be representative of those commonly produced by PharmaCo. The primary criteria for this characteristic were process complexity, COGS ratio, drug product complexity, labor content, production volume, and product lifecycle maturity.
Costs due to complexity
The current volume, in packs, is held constant. Specifically, the plant currently produces a given number of product packs across the 1500 SKUs in the current production portfolio. The single-SKU model is built assuming this same number packs per year.
4.2.2.2 Capital Equipment
Existing capital equipment and machinery currently in the plant are often capable of producing multiple variations of products. This, logically, is advantageous for a plant that produces several different SKUs, each with a unique combination of final drug form, dosage, packaging, and format. For the single-SKU model, existing multi-use capital equipment currently in the plant is replaced with equipment that may only be capable of producing a single product configuration if the single configuration is less expensive. This single configuration equipment is also often capable of higher run-rates. When it is possible to replace machinery in the plant with less expensive equipment in the single-SKU cost model, the annualized depreciation savings are subtracted out of the annual cost structure.
Similarly, some equipment is left idle after the plant is streamlined for a single SKU and potential bottlenecks in the production process shift. In these cases, the depreciation of the now idle equipment is subtracted out of the cost model.
4.2.2.3 Labor
Direct labor (i.e. operators) is evaluated from the baseline under the current cost structure. Manufacturing operations are analyzed to quantify setups, changeovers, and equipment cleanings (required from switching from one drug product to another on the same production line) that would be eliminated or reduced under a streamlined, single-SKU scenario. These reductions translate directly to a reduced number of direct labor hours.
The current multi-SKU production system also often requires producing batch sizes that are much less than the maximum possible; this is because volume on orders is spread
out across the 1500 SKUs and in only some cases are order sizes large enough to require a maximum batch size. A single-SKU production plan allows larger batch sizes, which results
in fewer batches being run. This translates directly into fewer required labor hours in the single-SKU model.
Indirect labor consists of supervisors, material handlers, line managers, and other support staff. This labor varies proportionally with overall direct labor hours. As a result, indirect labor was reduced proportionally with the reduction in direct labor hours.
Labor related to product quality can be classified into the two groups. The first, quality control (QC), consists of quality and production engineers that are responsible for directly sampling and controlling quality of the product at various stages in the production process. The number of hours of QC labor required to analyze product is reduced by larger batch sizes and the fact that there is only one type of drug product in the single-SKU model. The second category of quality labor, quality assurance (QA), is responsible for overall compliance to quality regulations. The QA staff are mandated by regulatory agencies and, therefore, are not reduced in the single-SKU model.
Maintenance staff are considered a fixed cost and are left unadjusted. IT costs are variable to the number of full-time employees (FTEs) required in the plant after the above adjustments have been made. Other labor, such as accounting staff and material purchasers, are adjusted down on a case-by-case basis.
4.2.2.4 Materials
Several materials in the production process can be reduced in the single-SKU model. Many of these reductions occur because larger batch sizes and larger lot sizes are run during the production process. As a result, cost reductions occur because only one type of material is often needed, resulting in larger bulk discounts when purchasing materials. Also,
reductions occur because of the opportunity to use materials that may be nominally less expansive. For example, some products utilize folding boxes that are more expensive and complex than those used for the SKU represented in the single-SKU model. Costs for the material categories listed below are reduced in the single-SKU model as a result of the changes to batch sizes and lot sizes. Impacts from other materials are assumed to be negligible.
* Printed foil * Leaflets * Folding boxes
4.2.2.5 Other Assumptions and Adjustments
Almost all consumption of utilities (electricity, gas, and water) is primarily driven by infrastructure and HVAC. As a result, reductions in the single-SKU model are minimal and utility costs are left unaltered from the multi-SKU plant. The balance of all other expenses represents 9% of total expenses. This balance is scaled proportionally to full-time employee (FTE) labor hours in the single-SKU model.
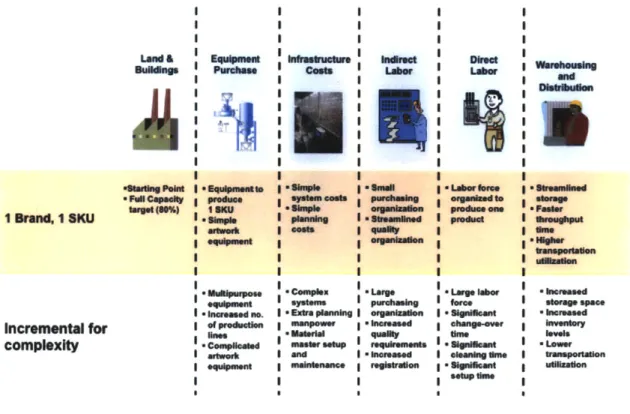
Figure 9 below summarizes the assumptions and general approach for the top-down single-SKU model.
-Lsany
A
*Fwcapeft~ 1 Brand, I SKU Increenital for complexity l o hmm-incosd no. I afp~nin I - mnsa I -two m No" c mala e S* xtra planning iamlntenance Crn Iamasd *-pum wing roaquimmnfte I -ieesd I ~ forer I - n 'L I O I .Iabgbm f e t hmg.o. Sh*Iemtln ohm*-W I -Pd~ea one . e inressed I -low uiliranstona-Figure 9: Comparison of single-SKU and multi-SKU cost model assumptions.
4.2.3 Model
Based on the assumptions described above, a plant that is representative of
PharmaCo was selected as a basis for the top-down complexity cost model. Additionally, a representative SKU and brand were also selected. In order to break the components of the plant into separate areas to be analyzed, a general process map for the major stages of processing was developed and can be seen in the Appendix. The assumptions were applied as explained above.
4.2.4 Results
The top-down cost model revealed a number of key insights into complexity costs at PharmaCo. From an aggregated level, complexity costs account for 37% of the cost structure in a representative PharmaCo operation, as shown below in Figure 10.
Figure 10: Complexity costs derived from top-down model.
Additionally, a proportional breakdown of the specific complexity costs is shown below in Figure 11. Labor accounts for the largest portion of complexity costs followed by equipment depreciation. I Personnel Costs * Depreciation Maintenance *IT Costs aConsumables and 3rd Party Services I Taxes Materials
Figure 11: Complexity cost breakdown (proportional).
The number of batches required to be run are reduced significantly, as shown below in Figure 12 (data is normalized to a scale of 100). The reduction is particularly large for packaging, where a drug product from a large single processing batch is divided up into
several different packaging batches destined for different markets and product configuration offerings.
Figure 12: Comparison of production batches required (normalized to scale of 100).
A significant portion of the capital equipment and machinery is also required by offering a complex product portfolio, as shown below in Figure 13. A single-SKU plant requires less multipurpose machinery, which is typically less expensive (and often capable of higher run-rates). 100 80 60 * Equipment required by complexity 40 4 Equipment required by single SKU 20 0
Packaging lines Processing work Dispensing work
Labor, which accounts for a significant portion of the cost due to complexity, is almost halved in a single-SKU scenario, as shown below in Figure 14. The amount of direct and indirect labor required by complexity is almost twice that of a simple, single-SKU product portfolio. Larger batch sizes, higher run rates, fewer equipment changeovers, and fewer equipment cleanings in a single-SKU scenario are the primary drivers of these labor reductions. 100 80 60 -40 - E Labor due to complexity 20 - - Labor due to single SKU 0 \,e
Figure 14: Comparison of required labor (normalized to scale of 100).
Material costs are shown below in Figure 15. This shows that about one-fifth of material costs are due to complexity, with the largest portion allocated to leaflets. Larger bulk buys and fewer unique requirements for a single-SKU scenario are the largest factors that result in the reductions to material costs in a single-SKU product portfolio.
100 80 60 * Materials due to complexity 40 I Materials due to single SKU 20 0
Printed foil OPA Leaflets Folding Total laminate boxes materials
Figure 15: Comparison of required material costs (normalized to scale of 100).
Finally, a summary of all non-labor and non-material costs is shown below in Figure 16. Again, this shows that among the expenses that are not directly COGS, depreciation of equipment that is not required in a single-SKU product portfolio is the largest driver of complexity cost.
100 80 60 -* Expenses due to 40 -
complexity
* Expenses due to 20 - single SKU 0Figure 16: Comparison of non-labor and non-material costs (normalized to scale of 100).
With these cost models and findings, we will move in the next chapter to a specific complexity reduction case study at PharmaCo wherein inventory savings are realized by consolidating SKUs in the product portfolio. This specific case study will provide an
example of the types of savings possible through effective management of complexity in the product portfolio.
5 Case Study - Safety Stock Holding Costs
A complex product portfolio typically results in a high number of SKUs that a company must maintain, produce, and supply. PharmaCo currently maintains a product portfolio of roughly 15,000 SKUs. The inventory holding costs for such a varied product portfolio can be significant, particularly for a global company like PharmaCo that produces
and sells a high volume of units across its entire product portfolio. Inventory costs are further driven by the objective to minimize stockouts for these products.
Inventory holding costs generally consist of costs due to cyclical stock and costs due to safety stock. Cyclical stock represents inventory that is produced to directly meet order demand. Safety stock represents inventory that acts is held in reserve as a buffer against variation in demand so as to ensure that customer orders are filled to a given service level.
Inventory holding costs due to reductions in cyclical stock tend to be fairly straight-forward calculations. Indeed, PharmaCo has been able to determine the savings due to reductions in cyclical stock (which are often caused by pruning SKUs from the product portfolio for a variety of reasons) with general clarity and confidence. Rather, cost savings due to safety stock reductions will be discussed in this chapter.
5.1 Business Unit SKU Reduction Pilot
As part of the effort to understand and reduce product portfolio complexity at PharmaCo, pilot programs are being proposed to explore the effects of complexity management efforts. One such pilot is being implemented in PharmaCo's business unit
commercial packs, and hospital packs, as shown below in Figure 17. The effects on holding costs due to safety stock reductions will be examined here.
500 -400 u300 -200 -100 -0
Start Launches Sample Commercial Hospital End
Figure 17: SKU reduction pilot for Country X business unit
Country X has agreed to eliminate sample packs for new product launches that are now more than two years into the product lifecycle. Sample packs for new product launches are intended to introduce potential customers to the new product offering. After a newly launched product has been on the market for more than two years, it is reasonable to assume that it has been sufficiently introduced to the market and new launch sample packs are no longer needed.
The sample packs and commercial packs that have been identified for pruning typically experience very low and sporadic volumes. Additionally, many of these SKUs are similar in configuration to other SKUs also currently in the product portfolio. As a result, it is reasonable to assume that some of the limited volume currently associated the SKUs that are being eliminated will be transferred to another existing SKU. However, for the purposes
of this analysis, the more conservative assumption that all volume for a pruned SKU is lost and not transferred to another SKU will be employed.
In Country X's current product portfolio, a number of products that are nearly identical in drug form, dosage, and pack configuration are sold through both typical commercial channels as well as hospitals. Often, the only difference is that the hospital packs have a slightly different outer packaging (often due to different pricing). As a result, these identical products are assigned different SKUs depending on the channel through which they will be sold. In Country X, it has been agreed that 113 SKUs associated with such hospital packs will be eliminated and the demand will be filled by commercial packs. Any potential outer packaging differences (which are few) will be addressed through a simple, low-cost delayed differentiation, such as a sticker that can be applied to the packaging. As a result, all of the volume from the eliminated hospital packs will be transferred to the corresponding commercial pack SKUs that remain.
5.2 Approach
Two approaches can be employed to estimate the impact on safety stock holding costs due to the pilot program described above: one is very simplistic and provides a fast, first-order approximation; the other is relatively more sophisticated, requires more data, and typically provides better accuracy.
Holding costs due to safety stock can be calculated as the following [6]:
Safety Stock Holding Costs = r -v -ss
5.2.1 The Square-root Rule
In an inventory distribution network, reducing the number of stocking points (typically distribution centers) can result in a reduction of the total amount of safety stock required to be held [7]. The reduction in safety stock can be calculated according to the
following:
SSc = SSd
where sse is the safety stock in the consolidated system, ssd is the safety stock in the
decentralized system, ne is the number of distribution centers in the consolidated system, and nd is the number of distribution centers in the decentralized system.
This model can be adapted to approximate the safety stock reduction in the case where two SKUs are consolidated to one SKU and all of the volume is transferred to the remaining SKU. In effect, the SKUs become the stocking points in this approximation. A reduction occurs at the level of individual SKU pairs. Consequently, ne will equal 1 and nd will equal two for each SKU pair (in every case, two SKUs are being consolidated to one
SKU). As a result, safety stock after consolidating the SKU pairs would be equal to the original safety stock multiplied by a factor of 1/V2, or roughly a factor of 0.707. In other words, safety stock in the consolidated scenario would be about 71% of the original safety
stock level, resulting in a 29% reduction in the safety stock. This safety stock reduction of 29% would translate directly into a holding cost savings of 29% for safety stock according to the equation given above for safety stock holding costs.
The square-root rule in this form, however, is constrained by a major underlying assumption: the variability in demand, the variability in forecasting error, and the production lead times must be equal for both stocking points (or in this case, both SKUs). This is often not the case. As a result, the square-root rule gives a good back-of-the-envelope estimate for the upper bound of safety stock holding cost savings possible under these assumptions.
However, a relatively more sophisticated approach is needed for PharmaCo's pilot in Country X as demand variability, forecasting error variability, and lead times are significantly different for the two SKUs in each SKU consolidation pair.
5.2.2 Classic Inventory Management Model
Classic single-item inventory management models allow for the impacts of demand variation and differing product lead times. These models are built on the following
framework and equations [6]. First, the forecast error et is given as
et = xt - Xt
where xt is the actual demand for observation t and ft is the forecasted demand for observation t.
Next, the root mean squared error (RMSE) is given as
RMSE-n
where n is the number of observations.
![Figure 1: Wilson and Perumal's framework for managing complexity[2].](https://thumb-eu.123doks.com/thumbv2/123doknet/14421204.513363/15.918.193.697.604.967/figure-wilson-perumal-s-framework-managing-complexity.webp)
![Figure 2: Collinson and Jay's complexity curve[3].](https://thumb-eu.123doks.com/thumbv2/123doknet/14421204.513363/16.918.252.676.663.940/figure-collinson-jay-s-complexity-curve.webp)
![Figure 3: Anderson, Hagen, and Reifel's root causes of complexity[5].](https://thumb-eu.123doks.com/thumbv2/123doknet/14421204.513363/18.918.245.645.397.812/figure-anderson-hagen-reifel-s-root-causes-complexity.webp)
![Figure 4: Anderson, Hagen, and Reifel's approach to a component-based portfolio[5].](https://thumb-eu.123doks.com/thumbv2/123doknet/14421204.513363/19.918.185.761.180.542/figure-anderson-hagen-reifel-approach-component-based-portfolio.webp)