HAL Id: hal-01925471
https://hal.inria.fr/hal-01925471
Submitted on 16 Nov 2018
HAL is a multi-disciplinary open access
archive for the deposit and dissemination of
sci-entific research documents, whether they are
pub-lished or not. The documents may come from
teaching and research institutions in France or
abroad, or from public or private research centers.
L’archive ouverte pluridisciplinaire HAL, est
destinée au dépôt et à la diffusion de documents
scientifiques de niveau recherche, publiés ou non,
émanant des établissements d’enseignement et de
recherche français ou étrangers, des laboratoires
publics ou privés.
Cooperation of bio-ontologies for the classification of
genetic intellectual disabilities : a diseasome approach
Gabin Personeni, Marie-Dominique Devignes, Malika Smaïl-Tabbone,
Philippe Jonveaux, Céline Bonnet, Adrien Coulet
To cite this version:
Gabin Personeni, Marie-Dominique Devignes, Malika Smaïl-Tabbone, Philippe Jonveaux, Céline
Bon-net, et al.. Cooperation of bio-ontologies for the classification of genetic intellectual disabilities : a
diseasome approach. Proceedings of the 11th International Conference on Semantic Web
Applica-tions and Tools for Healthcare and Life Sciences (SWAT4HCLS 2018), Dec 2018, Antwerp, Belgium.
�hal-01925471�
Cooperation of bio-ontologies for the
classification of genetic intellectual disabilities :
a diseasome approach
Gabin Personeni1, Marie-Dominique Devignes1, Malika Sma¨ıl-Tabbone1,
Philippe Jonveaux2, C´eline Bonnet2, and Adrien Coulet1,3
1 Universit´e de Lorraine, CNRS, Inria, LORIA, Nancy, France 2
Department of Genetics, Nancy University Hospital, Inserm U954, University of Lorraine, Nancy, France
3
Stanford Center for Biomedical Informatics Research, Stanford University, Stanford, California
Abstract. Bio-ontologies are widely used to annotate and characterize biological objects or situations, enabling the use of shared or similar features in classification tasks. It may appear beneficial to make two or more bio-ontologies cooperate for building more complete descriptions, and therefore more accurate classifications of biological objects. This hypothesis is evaluated here for the classification of an heterogeneous set of 374 Genetic Intellectual Disabilities (GIDs), using a diseasome approach.
These GIDs are annotated with classes of the Human Phenotype Ontol-ogy (HPO) and their causal genes with the three aspects of the Gene Ontology (GO). We test two semantic similarity measures, and different combinations of ontologies, to connect semantically similar diseases. We then evaluate how well these ontologies, and their combinations, are ex-ploited by the similarity measures to classify GIDs in accordance with an expert classification.
Results show that combining the three aspects of GO achieves very good overall performance, and that, for each GID class, a particular combi-nation of 2 or 3 GO aspects and occasionally HPO yields the best per-formance. These results illustrate how bio-ontologies can cooperate in a classification by refining the characterization of biological objects. Keywords: Semantic similarity · Bio-ontologies · Genetic Intellectual Disabilities · Diseasome
1
Introduction
Bio-ontologies, such as the Gene Ontology (GO) [1] or the Human Phenotype Ontology (HPO) [16] are used to annotate biological objects such as gene prod-ucts or diseases, enabling their semantic comparison. In particular, there exists a wide collection of semantic similarity measures, allowing to quantify the simi-larity of objects with regard to their annotations [19, 3]. We investigate in this article how several bio-ontologies can be used conjointly to cooperate to improve classification of a heterogeneous set of Genetic Intellectual Disabilities (GID).
Numerous studies report on the hypothesis that analyzing disease networks, here named diseasomes, may be a mean to discover new knowledge on mecha-nisms or treatments of diseases [2]. Various methods for diseasome building have been described in the literature. For instance, two diseases can be associated if they share one causing gene [8], phenotype [10] or are linked through a chain of protein-protein interactions [9]. Hoehndorf et al. [11] proposed a diseasome that associates diseases with respect to their phenotypic similarity. They assem-bled a dataset, extracted from the literature, of about 6, 000 diseases annotated with their associated phenotypes, using classes of the Monarch Disease Ontol-ogy (MonDO) [18]. The similarity of diseases with regard to their annotation were subsequently computed with the SimGIC function [19]. We propose here to extend this approach by conjointly using annotations taken from several on-tologies, and by assessing their respective contribution to a disease classification task.
The hypothesis that several bio-ontologies can somehow cooperate to refine a diseasome is evaluated here within the task of classifying GIDs. The classifica-tion of GIDs is of particular interest, and challenging for experts, because these diseases are very heterogeneous both in terms of causal genes and clinical out-comes. We focused on a set of 374 GIDs for which causal genes are known and used for genetic diagnosis. We manually classified these diseases with experts into five groups, on the basis of the biological mechanisms disturbed in the disease: regulation, regulation of genetic expression, metabolic, synaptic, neurogenesis. We detail in this article a diseasome approach based on semantic similarity of GIDs at both the phenotype and genetic level, and study how it can match an expert GID classification.
2
Material and Methods
2.1 Data and Ontologies
A dataset of 374 GIDs was built for this study on the basis of a list of 312 genes associated with GIDs derived from the work of Gilissen et al. [7] who ini-tially compiled two lists of GID genes: a list of 528 “known” GID genes and a list of 628 “candidates” genes, based on the number of reported patients in which a mutation or variant of the gene is observed. The 312 genes retained here (230 “known” genes and 82 “candidates”) are those that are found associ-ated with a genetic disease in OMIM database (Online Mendelian Inheritance in Man, http://omim.org) and used for diagnosis in the Genetics Laboratory of Nancy Hospital. Four distinct ontologies were used in this study: Human Phe-notype Ontology (HPO) [17] and the three aspects of Gene Ontology (GO) [1] named here BP for Biological Process, CC for Cellular Component and MF for Molecular Function. These three aspects of GO are organized into independent hierarchies of classes related by the subsumption relation, and are here con-sidered as separate ontologies. HPO annotations of GIDs were collected from the HPO database (http://hpo.jax.org). BP, CC and MF annotations were collected from the GOA database [12] at the European Bioinformatics Insti-tute (https://www.ebi.ac.uk/GOA) for all UniProtKB proteins encoded by the
Cooperation of bio-ontologies for the classification of intellectual disabilities 3
genes associated to GIDs and transferred to the corresponding GID. The average number of HPO classes associated per GID was 22.4 ± 17.5, whereas the average numbers of BP, CC and MF classes per GID were 14.8 ± 16.4, 5.8 ± 4.3 and 5.2 ± 4, respectively. All GIDs could be associated with at least one HPO class and one BP class. Only 27 GIDs were found lacking one or the other aspect of GO annotation, mostly CC.
2.2 Expert classification of GIDs
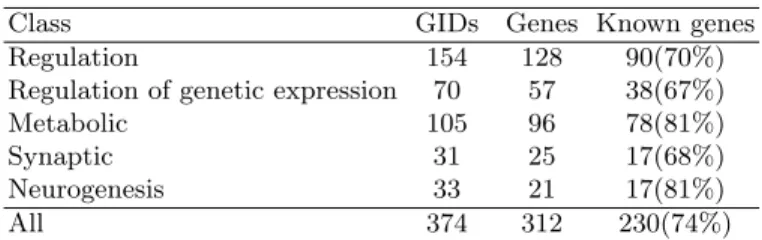
GID diversity and heterogeneity renders their classification difficult. Our man-ual classification is an attempt to integrate the state-of-the-art knowledge about GIDs[13, 5, 15, 14] into the definition of five classes. The “Metabolic” class represents diseases affecting synthesis or degradation of metabolites, leading to metabolite deficiency or accumulation with deleterious consequences. The “Synaptic” class represents diseases affecting the structure and the function of synapses. The “Neurogenesis” class represents diseases affecting neuronal migra-tion or proper development of central nervous system. The “Regulamigra-tion of ge-netic expression” class represents diseases in which gege-netic expression (chromatin structure, transcription and its regulation, translation and post-translational modifications) is affected. The “Regulation” class is for all other diseases in which control of biological processes other than genetic expression is affected (for instance transport of proteins or energetic balance of the cell). Our dataset of 374 GIDs with their 312 responsible genes was manually distributed into these five classes by expert inspection of their OMIM notices (disease and gene ones). The resulting classification likely relies on several subjective arbitrary state-ments, but it appeared sufficient for the methodology used in this study. Table 1 quantitatively describes the composition of each class of GIDs.
Table 1. Distribution of our GID dataset in the five classes of our manual classification. Numbers of known genes refers to the list of Gilissen et al. [7].
Class GIDs Genes Known genes
Regulation 154 128 90(70%)
Regulation of genetic expression 70 57 38(67%)
Metabolic 105 96 78(81%)
Synaptic 31 25 17(68%)
Neurogenesis 33 21 17(81%)
All 374 312 230(74%)
The broad definition of each class leads to possible assignment of the same disease and gene to two different classes. This is the case of 3, 5 and 10 GIDs of the Metabolic, Synaptic and Neurogenesis classes, respectively that are also classified in the Regulation class. One additional GID from the Neurogenesis class is also classified as Regulation of genetic expression. This GID (OMIM #613454: Rett syndrome, congenital form) illustrates the difficulty to classify GIDs, as it is described as a severe neurodevelopmental disorder and therefore classified in the Neurogenesis class, whereas its responsible gene is the FOXG1
gene, which codes for a repressor of the forked-head transcription factor family, pointing to the Regulation of genetic expression class.
2.3 Semantic similarity measures
Semantic similarity measures quantify the proximity of two ontology classes, or objects described by a set of classes, from an ontology. Such similarity mea-sures may be used to build a diseasome, using disease annotations linked to an ontology [11]. We applied such similarity-based diseasome approach to build a diseasome of GIDs, on the basis of both their phenotypic and causal gene prod-uct annotations. These annotations are expressed as classes from four ontologies or ontologies fragments : HPO and the 3 aspects of Gene Ontology considered separately — BP, CC and MF.
We aim at assessing the contribution of several ontologies to a diseasome, but we also use two semantic similarity measures, to compare how different measures behave with ontology combinations. First, we use a node-based semantic similar-ity measure: SimGIC [19], which computes the ratio of common classes among the ontology classes of two diseases, weighted by the information content of each class, and considering all ancestors of each disease annotations. The informa-tion content of a class, with respect to a dataset of annotainforma-tions, is computed as IC(x) = − log2(P (x)), where P (x) is the probability that an object is anno-tated with the class x. Higher values of IC denotes higher specificity of the class. SimGIC was first introduced to compute similarity of genes annotated by GO classes, and has been successfully used with MonDO to build a diseasome based on phenotypic similarity [11]. Second, we use the edge-based similarity measure IntelliGO [3], which permits to compare two biological objects by first computing distances in the hierarchy between pairs of classes annotating the objects, and then aggregating each pairwise similarities into a single-object similarity score. As SimGIC, this aggregation step takes into account the information content of the compared classes to weight their contribution to the similarity.
To assess the contribution of each ontology, we build several similarity func-tions, using every possible combination of ontologies among BP, CC, MF and HPO, combined with both IntelliGO and SimGIC. For this purpose and in a first approach, we simply average the similarities computed separately with each ontology. We thus test 15 possible combinations of one or more ontologies, in turn combined with IntelliGO or SimGIC, resulting in 30 similarity functions. 2.4 Evaluation of similarity functions with respect to a reference
classification
Hoehndorf et al. described in [11] a methodology to evaluate the accuracy of a similarity function with respect to a classification of diseases. This methodology aims at verifying that the similarity function gives higher similarity scores to pairs of diseases that belong to a same class of disease.
This evaluation is based on a Receiver Operating Characteristic (ROC) anal-ysis, quantifying the accuracy of a binary classification model at varying degrees of sensibility. In particular, a ranking of disease pairs, based on their similarity,
Cooperation of bio-ontologies for the classification of intellectual disabilities 5
serves as a classification model whose sensibility can be adjusted by defining a threshold of similarity above which pairs of diseases are labeled as positive by the model. The ROC curve represents the true positives rate as a function of the false positive rate. The ROC Area Under the Curve or ROCAUC can be computed from such a curve, and represents the probability for a random pair of diseases from the positive class to have a higher similarity than a random pair of diseases from the negative class. We note ROCAU C(R, P ) the function that computes the ROCAUC given a ranking R, and the set of positive elements P , describing which elements of R are to be considered positive for the purpose of the evaluation.
The ROCAUC-based evaluation can be conducted either for each single class of diseases or for the entire classification of diseases. This evaluation can also be performed with a classification of diseases in which a disease can belong to more than one class.
Data: The set of diseases D, a similarity between diseases sim : D × D → R+
Result: Average ROCAUC for all diseases begin
ROCAU Cavg= 0
foreach disease d ∈ D do
ranking ← x ∈ (D − {d}) ranked in descending order of sim(d, x) pos ← {x ∈ D | d and x share a disease class}
ROCAU Cavg← ROCAU Cavg+ ROCAU C(ranking, pos)
end
return ROCAU Cavg/|D|
end
Algorithm 1: Evaluation algorithm for a similarity function sim on a classi-fication task with several overlapping classes of diseases.
Data: The set of diseases D, a disease class C, a similarity between diseases sim : D × D → R+
Result: Average ROCAUC for diseases of C begin
ROCAU Cavg= 0
pos ← {x ∈ D | x has class C} foreach disease d in class C do
ranking ← x ∈ (D − {d}) ranked in descending order of sim(d, x) ROCAU Cavg← ROCAU Cavg+ ROCAU C(ranking, pos)
end
return ROCAU Cavg/|DC|
end
Algorithm 2: Evaluation algorithm for a similarity function sim on a classi-fication task with respect to a single class of diseases C.
The Algorithm 1 describes how the evaluation is performed globally on all disease classes, for an arbitrary similarity function sim. For each disease d of the dataset, we compute the ranking of the other diseases using sim, from the most similar to the least similar. Here, we want high-ranking diseases to share a disease class with d, thus, we consider the positive class to be the set of diseases sharing a GID class with d. The ranking is then evaluated by computing the ROCAUC for the prediction on that positive class. ROCAUCs for each disease in the dataset are then averaged to obtain a global evaluation score.
The Algorithm 2 describes how a similarity function sim is evaluated with respect to a single disease class, noted C. For each disease d of the GID class C, we compute a ranking of the other diseases using sim, and we define the positive class to be the set of diseases that belong to C. Again, the ranking is then evaluated by computing the ROCAUC for the prediction on that positive class. ROCAUCs for each disease of the class are then averaged to obtain a score representing how well the similarity function reflects this class.
3
Results
We apply the methodology described previously to our set of 374 GID. This set of diseases has phenotypic annotations expressed as HPO classes and the genetic annotations of their causing genes, expressed as GO classes and split into the three aspects of GO considered here as three independent ontologies. Indeed, as their class hierarchy are separate, semantic similarity measures such as IntelliGO and SimGIC cannot compare classes from these different aspects.
We computed all pairwise similarities on our set of GIDs, for all 30 possible similarity functions resulting from the combinations of the four ontologies (BP, CC, MF and HPO) and the two semantic similarity measures (IntelliGO and SimGIC). Each of these similarity functions was then evaluated by computing the average ROCAUC for each of the 5 GID classes, as described in Algorithm 2, and for all classes considered together, as described in Algorithm 1.
Tables 2 and 3 present a selection of the results of theses evaluations for differ-ent similarity functions based on differdiffer-ent combinations of ontologies, computed using IntelliGO and SimGIC respectively. Results are given for 6 classification tasks, one task for each GID class evaluated separately, as described in Algo-rithm 2, and a sixth task evaluating the performance of the similarity function on all 5 GID classes, as described in Algorithm 1. For each task, we tested every possible combination of ontologies from BP, CC, MF and HPO, but both Tables report only results for combinations of interest: single ontologies, all GO aspects, all ontologies, and all combinations that provide the best performance on any task for either SimGIC or IntelliGO.
Unsurprisingly, the results are highly variable depending on which ontolo-gies are considered, and which similarity measure is used, and they also vary across different classification tasks. In particular, we observe that HPO does not positively contribute to the performance when combined with other ontologies, with the exception of the classification task of the Neurogenesis class. We also note that similarity functions using only HPO have poor performance compared with those using a single GO aspect in most cases, although such a function
Cooperation of bio-ontologies for the classification of intellectual disabilities 7
performs better than a random classifier. This suggests that, for classes other than Neurogenesis, HPO does not bring more information compared to GO than noise. However, combining several GO aspects produces a great increase in per-formance, which is notably visible for the Regulation of Genetic Expression class: IntelliGO performance increases from 0.740 in the best case with only one GO aspect to 0.803 with all three of them, and SimGIC performance increases from 0.905 to 0.936.
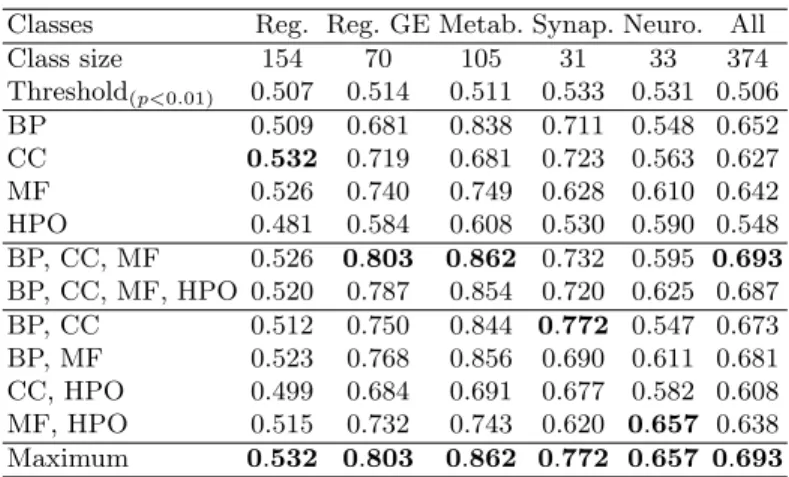
Table 2. ROCAUC obtained using IntelliGO to classify GIDs into 5 classes (Reg-ulation, Regulation of Genetic Expression, Metabolic, Synaptic, Neurogenesis) with different combinations of ontologies among the three aspects of GO (BP, CC and MF) and the phenotype ontology HPO. For each GID class, an average ROCAUC is also computed as described in the Algorithm 2. An average ROCAUC is computed across all classes as described in the Algorithm 1. Values in bold denote the maximum average ROCAUC for each evaluation task (each single class or all classes). For each task, the Table presents the threshold at which the performance score is significant (p < 0.01), which was computed empirically using random similarity functions.
Classes Reg. Reg. GE Metab. Synap. Neuro. All
Class size 154 70 105 31 33 374 Threshold(p<0.01) 0.507 0.514 0.511 0.533 0.531 0.506 BP 0.509 0.681 0.838 0.711 0.548 0.652 CC 0.532 0.719 0.681 0.723 0.563 0.627 MF 0.526 0.740 0.749 0.628 0.610 0.642 HPO 0.481 0.584 0.608 0.530 0.590 0.548 BP, CC, MF 0.526 0.803 0.862 0.732 0.595 0.693 BP, CC, MF, HPO 0.520 0.787 0.854 0.720 0.625 0.687 BP, CC 0.512 0.750 0.844 0.772 0.547 0.673 BP, MF 0.523 0.768 0.856 0.690 0.611 0.681 CC, HPO 0.499 0.684 0.691 0.677 0.582 0.608 MF, HPO 0.515 0.732 0.743 0.620 0.657 0.638 Maximum 0.532 0.803 0.862 0.772 0.657 0.693
If combining all three aspects of GO provides the best overall performance, we nonetheless observe that this is not necessarily the best combination for the classification task on each individual GID class :
– The Regulation class is poorly predicted by most similarity functions. In par-ticular, similarity functions based on HPO alone are not performing better than a random classification.
– The Regulation of Genetic Expression class is best when computed using SimGIC (0.936) and considering the three aspects of GO conjointly. How-ever, in this case, considering HPO on top of GO does not offer any increase in performance. Similarly, IntelliGO performs best on this classification task when considering the three aspects of GO, but shows a decrease in perfor-mance when also considering HPO.
– The Metabolic class is best predicted using IntelliGO (0.862) when using all three aspects of GO. However, we observe that SimGIC (0.785) obtains its
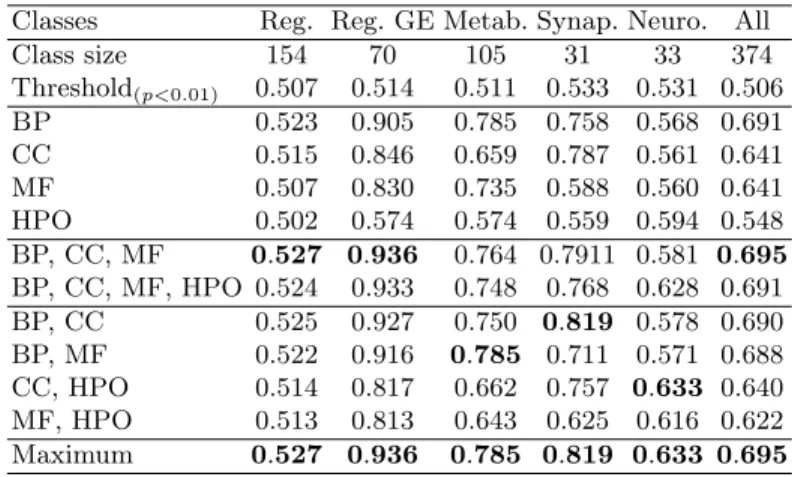
Table 3. ROCAUC obtained using SimGIC to classify GIDs into 5 classes (see Table 2 for details).
Classes Reg. Reg. GE Metab. Synap. Neuro. All
Class size 154 70 105 31 33 374 Threshold(p<0.01) 0.507 0.514 0.511 0.533 0.531 0.506 BP 0.523 0.905 0.785 0.758 0.568 0.691 CC 0.515 0.846 0.659 0.787 0.561 0.641 MF 0.507 0.830 0.735 0.588 0.560 0.641 HPO 0.502 0.574 0.574 0.559 0.594 0.548 BP, CC, MF 0.527 0.936 0.764 0.7911 0.581 0.695 BP, CC, MF, HPO 0.524 0.933 0.748 0.768 0.628 0.691 BP, CC 0.525 0.927 0.750 0.819 0.578 0.690 BP, MF 0.522 0.916 0.785 0.711 0.571 0.688 CC, HPO 0.514 0.817 0.662 0.757 0.633 0.640 MF, HPO 0.513 0.813 0.643 0.625 0.616 0.622 Maximum 0.527 0.936 0.785 0.819 0.633 0.695
best performance score on this classification task when considering only BP and MF. However, this divergence between the two measures is small, as IntelliGO performs almost as well with only BP and MF (0.856).
– The Synaptic class is best predicted when using only the BP and CC aspects of GO for both SimGIC (0.819) and IntelliGO (0.772).
– The Neurogenesis class is the only class for which we obtain better results when adding HPO to the aspects of GO, for both IntelliGO and SimGIC. In particular, IntelliGO gets a performance score of 0.657 when using MF and HPO (compared to 0.610 with MF alone, or 0.590 with HPO alone), while SimGIC gets a performance score of 0.633 (compared to 0.561 with CC alone, or 0.594 with HPO alone).
4
Discussion and Conclusion
We study in this article how different ontologies can cooperate to improve how a diseasome can reflect the expert knowledge of a classification of GID. We evaluate here two semantic similarity measures, IntelliGO and SimGIC on a classification task realized with 5 GID classes, using different combinations of phenotypic and genetic ontologies. The results show that phenotypic annotations from HPO are not sufficient to reflect our expert classification, while genetic annotations from each aspect of GO can offer better performance. Furthermore, combining several aspects of GO further improve performance and, for the Neurogenesis GID class, combining a GO aspect with HPO offer the best performance.
This illustrates that the cooperation of several ontologies is suitable for such a classification task and can improve a diseasome approach. However, the relevance of each ontology greatly depends on individual disease classes, and considering too many ontologies may have a negative effect. This constitutes a limitation of the use of semantic similarity measures, in that they are sensitive to the quality of annotations, as well to annotations irrelevant to class to predict. The results obtained show that overall, considering only the 3 aspects of GO yields often
Cooperation of bio-ontologies for the classification of intellectual disabilities 9
slightly better classification performance than considering both HPO and GO. Here, the contribution of HPO to the classification performance may be limited by the GID dataset we used, as these diseases may be too difficult to distinguish based on their phenotypes alone, as other studies show that HPO is suitable to classify more phenotypically heterogeneous sets of diseases [11]. It seems that in such cases, deciding on which ontologies to consider requires an iterative empirical approach that consider all possible combinations of ontologies. In fact, because performances do not necessarily increase with the number of ontologies, proposing a non-exhaustive strategy to select the best combination of ontologies for a particular task is not trivial.
Furthermore, it may be necessary to develop more sophisticated methods for aggregating similarities based on different ontologies. Here, we used an un-weighted average of similarities each using a different ontology. Weighting the contribution of each ontology to the aggregated similarity could be done in sev-eral ways, for instance, by considering the number of annotations in each on-tology for the compared disease, or by empirically determining an appropriate weighting scheme, rather than including or excluding ontologies. Moreover, as we observe that different settings and therefore different diseasome models are optimal only for certain classes, ways to aggregate different models could be explored, such as boosting algorithms [6] or bagging predictors [4].
Diseasomes based on semantic similarity are able to reflect an expert clas-sification of diseases, as illustrated in the different clasclas-sification experiments presented in this article. Such a diseasome can be used to classify new diseases by simple propagation of the neighboring diseases classes. Here, the cooperation of several biomedical ontology was shown to be relevant in many cases, how-ever selecting the right ontologies to consider for a particular task require some trial and error. We note that both semantic similarity measures, IntelliGO and SimGIC, have varying performance on the different classification tasks presented in this article: some GID classes seem to be better predicted by one of these two measures. However, these differences do not permit to conclude that one of these measures perform strictly better than the other, as their overall performances are very similar. In summary, semantic similarity measures with various com-binations of ontologies allow to propose a diseasome as a model synthesizing descriptions of GIDs in regards with several ontologies, in good agreement with an expert classification of such diseases. Such cooperation of bio-ontologies could also be explored with other machine learning methods.
References
1. Ashburner, M., Ball, C.A., Blake, J.A., Botstein, D., Butler, H., Cherry, J.M., Davis, A.P., Dolinski, K., Dwight, S.S., Eppig, J.T., et al.: Gene Ontology: tool for the unification of biology. Nature genetics 25(1), 25–29 (2000)
2. Barab´asi, A.L., Gulbahce, N., Loscalzo, J.: Network medicine: a network-based approach to human disease. Nature reviews genetics 12(1), 56 (2011)
3. Benabderrahmane, S., Smail-Tabbone, M., Poch, O., Napoli, A., Devignes, M.D.: Intelligo: a new vector-based semantic similarity measure including annotation origin. BMC bioinformatics 11(1), 1 (2010)
4. Breiman, L.: Bagging predictors. Machine learning 24(2), 123–140 (1996) 5. Chelly, J., Khelfaoui, M., Francis, F., Ch´erif, B., Bienvenu, T.: Genetics and
patho-physiology of mental retardation. European Journal of Human Genetics 14(6), 701 (2006)
6. Freund, Y., Schapire, R.E., et al.: Experiments with a new boosting algorithm. In: Icml. vol. 96, pp. 148–156. Citeseer (1996)
7. Gilissen, C., Hehir-Kwa, J.Y., Thung, D.T., van de Vorst, M., van Bon, B.W., Willemsen, M.H., Kwint, M., Janssen, I.M., Hoischen, A., Schenck, A., et al.: Genome sequencing identifies major causes of severe intellectual disability. Nature 511(7509), 344 (2014)
8. Goh, K.I., Cusick, M.E., Valle, D., Childs, B., Vidal, M., Barab´asi, A.L.: The human disease network. Proceedings of the National Academy of Sciences 104(21), 8685–8690 (2007)
9. Guney, E., Menche, J., Vidal, M., Bar´abasi, A.L.: Network-based in silico drug efficacy screening. Nature communications 7, 10331 (2016)
10. Hidalgo, C.A., Blumm, N., Barab´asi, A.L., Christakis, N.A.: A dynamic network approach for the study of human phenotypes. PLoS computational biology 5(4), e1000353 (2009)
11. Hoehndorf, R., Schofield, P.N., Gkoutos, G.V.: Analysis of the human diseasome using phenotype similarity between common, genetic, and infectious diseases. Sci-entific reports 5, 10888 (2015)
12. Huntley, R.P., Sawford, T., Mutowo-Meullenet, P., Shypitsyna, A., Bonilla, C., Martin, M.J., O’donovan, C.: The goa database: gene ontology annotation updates for 2015. Nucleic acids research 43(D1), D1057–D1063 (2014)
13. Inlow, J.K., Restifo, L.L.: Molecular and comparative genetics of mental retarda-tion. Genetics 166(2), 835–881 (2004)
14. van Karnebeek, C.D., Stockler, S.: Treatable inborn errors of metabolism caus-ing intellectual disability: a systematic literature review. Molecular genetics and metabolism 105(3), 368–381 (2012)
15. Kaufman, L., Ayub, M., Vincent, J.B.: The genetic basis of non-syndromic intel-lectual disability: a review. Journal of neurodevelopmental disorders 2(4), 182 (2010)
16. K¨ohler, S., Doelken, S.C., Mungall, C.J., Bauer, S., Firth, H.V., Bailleul-Forestier, I., Black, G.C., Brown, D.L., Brudno, M., Campbell, J., et al.: The human phe-notype ontology project: linking molecular biology and disease through phephe-notype data. Nucleic acids research 42(D1), D966–D974 (2013)
17. K¨ohler, S., Vasilevsky, N.A., Engelstad, M., Foster, E., McMurry, J., Aym´e, S., Baynam, G., Bello, S.M., Boerkoel, C.F., Boycott, K.M., et al.: The human phe-notype ontology in 2017. Nucleic acids research 45(D1), D865–D876 (2016) 18. Mungall, C.J., McMurry, J.A., Khler, S., Balhoff, J.P., Borromeo, C., Brush, M.,
Carbon, S., Conlin, T., Dunn, N., Engelstad, M., Foster, E., Gourdine, J., Ja-cobsen, J.O., Keith, D., Laraway, B., Lewis, S.E., NguyenXuan, J., Shefchek, K., Vasilevsky, N., Yuan, Z., Washington, N., Hochheiser, H., Groza, T., Smedley, D., Robinson, P.N., Haendel, M.A.: The monarch initiative: an integrative data and analytic platform connecting phenotypes to genotypes across species. Nucleic Acids Research 45(D1), D712–D722 (2017). https://doi.org/10.1093/nar/gkw1128, + http://dx.doi.org/10.1093/nar/gkw1128
19. Pesquita, C., Faria, D., Bastos, H., Falcao, A., Couto, F.: Evaluating go-based se-mantic similarity measures. In: Proc. 10th Annual Bio-Ontologies Meeting. vol. 37, p. 38 (2007)