HAL Id: hal-02154549
https://hal.archives-ouvertes.fr/hal-02154549
Submitted on 12 Jun 2019
HAL is a multi-disciplinary open access
archive for the deposit and dissemination of
sci-entific research documents, whether they are
pub-lished or not. The documents may come from
teaching and research institutions in France or
abroad, or from public or private research centers.
L’archive ouverte pluridisciplinaire HAL, est
destinée au dépôt et à la diffusion de documents
scientifiques de niveau recherche, publiés ou non,
émanant des établissements d’enseignement et de
recherche français ou étrangers, des laboratoires
publics ou privés.
Life Cycle Assessment of a milk protein fractionation
process: Contribution of the production and the
cleaning stages at unit process level
Genevieve Gesan-Guiziou, Alicja Sobantka, S. Omont, D. Froelich, M.
Rabiller-Baudry, F. Thueux, D. Beudon, L. Tregret, C. Buson, D. Auffret
To cite this version:
Genevieve Gesan-Guiziou, Alicja Sobantka, S. Omont, D. Froelich, M. Rabiller-Baudry, et al.. Life
Cycle Assessment of a milk protein fractionation process: Contribution of the production and the
cleaning stages at unit process level. Separation and Purification Technology, Elsevier, 2019, 224,
pp.591-610. �10.1016/j.seppur.2019.05.008�. �hal-02154549�
Contents lists available atScienceDirect
Separation and Purification Technology
journal homepage:www.elsevier.com/locate/seppurLife Cycle Assessment of a milk protein fractionation process: Contribution
of the production and the cleaning stages at unit process level
G. Gésan-Guiziou
a,⁎, A.P. Sobańtka
a, S. Omont
b, D. Froelich
b, M. Rabiller-Baudry
c, F. Thueux
d,
D. Beudon
e, L. Tregret
f, C. Buson
g, D. Auffret
gaSTLO, UMR1253 INRA-Agrocampus Ouest, 35000 Rennes, France
bArts et Métiers ParisTech, Institut de Chambéry, 73370 Le Bourget-du-Lac, France
cUniv Rennes, CNRS, ISCR (Institut des Sciences Chimiques de Rennes), UMR 6226, 35000 Rennes, France dECOBILAN SA, 92200 Neuilly-sur-Seine, France
eSOREDAB SA, 78125 Boissière, France
fNovasep Process, 01700 Saint Maurice de Beynost, France gGES, 35530 Noyal sur Vilaine, France
A R T I C L E I N F O
Keywords: Filtration Life cycle assessment Cleaning-in-place Environmental impact Dairy industry
A B S T R A C T
This paper aims at presenting a consistent Life Cycle assessment of the environmental impact of an industrial milk protein fractionation process at the level of unit processes (gate to gate approach), focusing on the effective contribution of both the production and the cleaning steps. The precise assessment of the impact of cleaning stages could indeed constitute key issues for the optimisation and management of food plants. The results show that the production phase accounts for approximately two-thirds of the environmental impact of the entire food manufacturing process, and the cleaning phase for more than 30% of the total impact. The latter is, however, underestimated due to methodological drawbacks and partly unavailable data. Among both the production and the cleaning stages the most impacting unit processes are the membrane and the thermal operations mainly due to the single-use of cleaning solutions and several temperature changes. Hence, for reduction of the overall environmental impact of the milk protein fractionation process it is advisable to primarily focus on improvement and optimisation of the microfiltration operation and secondly, on the thermal units.
1. Introduction
The food industry exhibits environmental impacts which are mainly due to the consumption of energy (gas and electricity), water and chemicals required for the process manufacturing and wastewater treatment. A specificity of food industry is the need of hygienic safety. This imposes several cleaning and disinfecting steps, generally once or twice daily, requiring the use of various chemicals to prepare detergent solutions. Moreover, quite huge amount of drinking water is needed because of many rinsing steps to achieve in between cleanings. Finally, these high water volumes generate high amount of effluents leading to wastewater treatments that are often performed on the industrial site itself thanks to a wastewater treatment plant dedicated to the plant to avoid the overloading of the public wastewater factories.
This is particularly true for the dairy sector, which significantly contribute to European environmental impacts. The dairy industry is a major consumer of energy and water given its 4thplace ranking in the
European food sector based on turnover (15%) and monetary value of Euro 130 billion[1]. It shows an average energy consumption between 0.1 and 6.4 kWh/kg of processed milk[2,3], a highly variable water consumption of 0.2–11 L/L milk in Europe[4]in addition to a gen-eration of 0.2–11 L effluents/L processed milk with a polluting charge extending to 0.2–2.5 g/L BOD (Biological Oxygen Demand), all together accounting for 5% of the greenhouse gas emissions (compared to 17% for the food and drink sector) and 10% of eutrophication of the total European[5]. The agricultural production is a main contributor to the greenhouse gas emissions of dairy products (Contribution of ≈80%). On average, the production of 1 kg of milk at farm gate is responsible for an emission of 1.2 kg of CO2-eqwhich leads to an emission of 183 Mt
of CO2-eqfor the European milk production in 2016. But among the
non-farming phases, the dairy processing is the most important contributor [2], and despite efforts already made, there are still many reasons (increase of demand for eco-designed products due to growing aware-ness among consumers, changes in the regulatory framework, etc.) to
https://doi.org/10.1016/j.seppur.2019.05.008
Received 16 November 2018; Received in revised form 15 April 2019; Accepted 2 May 2019
⁎Corresponding author.
E-mail address:genevieve.gesan-guiziou@inra.fr(G. Gésan-Guiziou).
Separation and Purification Technology 224 (2019) 591–610
Available online 03 May 2019
1383-5866/ © 2019 Published by Elsevier B.V.
specifically focus on the lowering of environmental impacts in the process level. As mentioned during the recent Climate change con-ference COP21 in Paris in 2015, significant efforts are expected in the manufacturing industry (among which food industry) in the coming years, to lower its carbon emissions by 24% within 10 years and by 75% by 2050 (in comparison with the agriculture: 12% within 10 years and by 50% by 2050).
Life cycle assessment (LCA) is a useful tool for estimating the en-vironmental impacts of the manufacture of dairy products. Several life cycle inventories on dairy products have been conducted[2,6,7]thus revealing the environmental impact of different dairy products and processes. However, most of the LCA studies undertaken on process analysis consider the unit processes as ‘black boxes’[8]. Such granu-larity in the studies failed to identify hotspots within the unit processes and understand whether optimisation of each unit operation con-stituting the global process can play a significant role in sustainability. Only a limited number of very recent studies assess the environmental impact of the manufacturing process with specifying contributions of unit processes. Assessing the environmental impacts at the level of unit operations would be very important and could serve as a basis for evidencing the margins of progress and for system subdivision to properly allocate impacts across the various co-products. Depping et al. [9], Santos et al.[10], Finnegan et al.[7,11], Yan et al.[12]and Ba-cenetti et al.[13]to name a few, focus on milk or whey concentration, drying processes, and cheese production. But none of them investigated fractionation processes which are largely used in the dairy industry.
The possible negative impact of the cleaning steps is much more intuitive. It has been stressed that cleaning and disinfection have an important contribution to the global environmental impact of the food and dairy manufacturing industry due, on one hand to the extensive use of freshwater, and on the other hand to that of acidic and alkaline cleaning agents and the concomitant generation of effluents[14–18]. Cleaning and disinfection, which are extensively automatised using efficient cleaning-in-place (CIP) systems, are certainly indispensable to ensure the faultless mode of operation of the equipment and the sani-tary quality of the food products. Few LCA studies have quantified the environmental impact of cleaning, but none of them give a clear overview of the contribution of cleaning phases, at the level of unit operations, to the overall environmental impacts of the production steps. Eide et al. [19]compared four cleaning-in-place methods for dairies using LCA and found that milk residues flushed out in the rin-sing phase were the main contributors to eutrophisation, with the phosphorus and nitrogen in the detergents also influencing the results. Djekic et al. [6] calculated cleaning environmental impacts (con-sumption of water, cleaning agents, energy) on an annual basis and divided it by the total annual quantity of produced final products. Santos et al. [10] compared different types of detergent used for cleaning a cheese plant, and did not notice any major change between the different options investigated, in the impacts of the cheese pro-duction. Then it becomes necessary to conduct studies on cleaning-in-place contribution to dairy production, and special attention should be paid to the contribution of cleaning at the level of unit operations. An inventory of the generated impacts of the cleaning at the level of the unit operations has never been detailed thus impeding development of systematic and far-reaching improvement and optimisation measures for the cleaning stages and the management of entire food plants[18]. The primary aim of this paper is then to present a consistent as-sessment of the environmental impact of a milk transformation process at the level of unit processes, including the effective contribution of the cleaning phases, to expose those unit operations that are the main contributors to the overall environmental impact and to evidence the margins of progress. A milk fractionation process, processing raw milk into enriched protein fractions, was selected as a convincing model when dealing with the question of environmental impact of food in-dustry because of its representativeness of the unit operations used in dairy processes. The results obtained in this study will be of interest to
many existing dairies but also to other food processing plants, because this study covers the most common food processing steps such as thermal treatments, filtration processes (microfiltration, ultrafiltration and reverse osmosis) and drying operation.
The second aim of this study is to show how LCA can be used to reveal the potential for eco-design of this type of industrial dairy pro-cess. Generally speaking, process design is performed by process spe-cialists aiming at decreasing the energy and water consumptions (one of the common process paradigm) and having to find compromises with financial aspects. In this study, the environmental impact is assessed by means of LCA, which provides a comprehensive estimation of the overall environmental impact according to a number of different impact categories[20].
2. Material and methods
The life cycle impact assessment was conducted in accordance with the standard practice as defined by the International organisation for standardisation, ISO 14040[21]and ISO 14044[22]requirements.
2.1. The milk protein fractionation process
A flow chart of the milk fractionation process used as reference for this study is presented inFig. 1. The milk fractionation process studied aims at producing various interesting dairy fractions, among them cream, casein micelles concentrates used in cheese manufacture, lactose and two enriched fractions consisting mainly of the two main whey proteins, namely α-lactalbumin and β-lactoglobulin. α-lactalbumin has a great potential market because of its high content in tryptophan and in infant milk formula. The main utilisations of β-lactoglobulin appear to be in gel and foam-type products and in the manufacture of protein hydrolysates for food ingredients.
The fractionation process is mainly based on unit operations de-veloped at industrial scale. It takes place at two different factories, which are (arbitrary) located at a distance of 100 km, considering that products obtained in the first plant are treated in a second factory for economic reasons. An industrial process could concern several type 1 plants for supply of the second plant (type 2).
In the first factory, raw milk is stored, casein micelles concentrates are prepared for cheese manufacture and whey proteins are centrated. In the second factory, whey proteins are fractionated, con-centrated and dried following an innovative process.
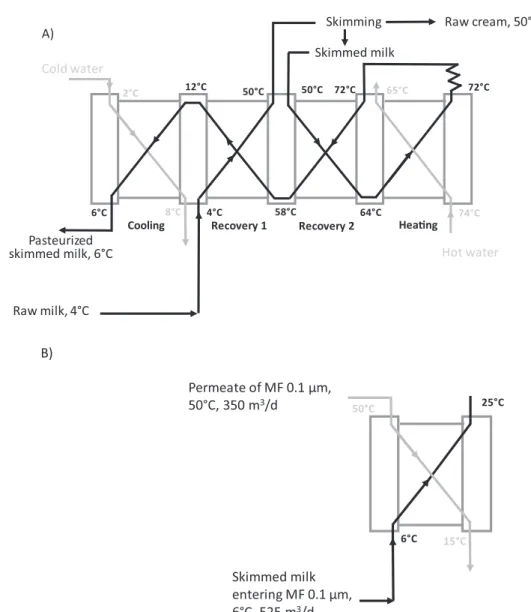
A general description of the process is given in the following (Fig. 1). Operating parameters and specific description of the unit op-erations of the process are given inTable 1andFig. 2.
Raw milk (583 m3/day) is delivered to the first factory. After
skimming by centrifugation, the cream is removed and used at a later stage. The skimmed milk (525 m3/day) is subsequently pasteurised
(72 °C, 20 s with a Pasteurisation plate heat exchanger (energy recovery yield ∼90%)) and tempered for the first milk protein fractionation process performed using microfiltration (MF) equipped with a tubular ceramic membrane of 0.1 µm mean pore diameter. The microfiltration of skimmed milk (MF 0.1 µm) enables the separation of milk into a retentate enriched specifically in casein micelles (major proteins in milk, size ≈150 nm), and a permeate containing soluble whey proteins (size 2–10 nm) [23–25]. The process was designed using ceramic membranes, and the Uniform Transmembrane Pressure mode (which involves a pump in the permeate compartment, [26]) because these membranes and this mode of operation are traditional way for this separation. The resulting retentate, which then contains the casein micelles, is at a later stage exploited for cheese production. The permeate, which contains the whey proteins, subsequently undergoes a concentration process via ultrafiltration (UF, polymeric spiral mem-brane cut-off ∼10 kg·mol−1) and a purification via diafiltration
[25,27]. The resulting UF permeate consisting of water, lactose and minerals, is treated through a reverse osmosis membrane (RO,
polymeric spiral membrane) to concentrate the lactose in the retentate that can then be valorised elsewhere. Moreover, the water in the RO permeate can later be used for cleaning purposes. The retentate of the UF (whey proteins concentrate, 11.5 m3/day) is transported to the
second factory for further fractionation.
The fractionation of the two main whey proteins is performed in the second plant, with a technique based on coupling precipitation of α-lactalbumin (under acidic conditions) and separation of the aggregates
using membrane separation[27,28]. Whey proteins concentrate is then first heated to 55 °C, acidified up to pH 3.8 with biodegradable citric acid. After the α-lactalbumin is precipitated, a dilution is performed with citric acid solution, and the precipitate is finally concentrated via MF (tubular ceramic membrane 0.1 µm) according to a process pre-viously described in literature[27,28]. The first target product, the β-lactoglobulin protein, remains in solution and is later on recovered in the permeate while the second product of interest, the α-lactalbumin protein is recovered in the retentate in precipitated form. In a next step the α-lactalbumin is resolubilised by readjustment of the pH at 7.0[25]. Both fractions are then independently concentrated via UF (polymeric spiral membrane, cut-off ∼10 kg·mol−1) and purified using
diafiltra-tion for salt removal prior to drying and storage.
In the studied process, some energy recoveries/transfers were taken into account, both during the skimming/pasteurization steps, and the heating and cooling of fluids before and after MF 0.1 µm (Fig. 2). A specific focus was on MF 0.1 µm because this operation treats a high volume of milk a day and because it operates at high temperature (50 °C) requiring high consumption of energy to heat the milk prior to MF and cool the obtained fractions after MF.
The whole studied system is the one described above. For the sake of simplicity, four sub-systems are differentiated within the entire milk protein fractionation process: production, cleaning, equipment and the transport from one factory to the other. The choice was made aiming at proposing optimisation from the LCA results at the plant scale and unit operation by unit operation.
“Production” includes five different groups of unit operations: (1) the membrane unit operations (2 MF, 3 UF, 1 RO); The heating and
cooling steps carried out just before and after the filtration opera-tions were excluded from this group and integrated into «heating, cooling, storage» group (group 2).
(2) all the heating (except pasteurization step), cooling and storage operations;
(3) the milk treatment (skimming, pasteurisation including online cool down of the pasteurised milk);
(4) the acidification and resolubilisation operations; and (5) the spray drying.
“Cleaning” includes the cleaning steps of the 5 groups of unit op-erations. “Cleaning” is composed of 3 Cleaning-In-Place, CIP, opera-tions (CIP 1 and 2 in factory 1; CIP 3 in factory 2), the cleaning op-erations assigned to filtration equipments (as described inTable 1) and two wastewater treatments plants. All cleanings were prepared with freshwater. The 3 CIP re-used cleaning solutions (Table 1). All the tanks and tubing which received and transport dairy products and the dif-ferent intermediates were cleaned prior to and/or after use. Therefore, they were first rinsed with water, cleaned with alkaline and acid so-lutions (with intermediate rinsing), rinsed, disinfected and finally rinsed again with water. Cleaning of the drying equipment (chemicals, water and energy consumptions) was not monitored. Therefore, the impact from cleaning of the drying equipment could not be quantified. The “cleaning” includes also the membrane cleaning. The membranes were flushed with water and special detergents whose chemical com-positions are largely unknown due to confidentiality reasons. The cleaning solutions used to clean membrane were discharged after one use (single-use system).
2.2. Goal and scope of the LCA
The goal of this study is to assess the environmental impact of every unit operation of an industrial milk protein fractionation process (Fig. 1,Table 1) to highlight those unit operations that are the main contributors to the overall environmental impact. A gate-to-gate per-spective was then applied in this study.
The core system is the process of milk protein fractionation as
Table 1
Operating conditions of the process during production and cleaning steps.
Factory 1
Cleaning in Place CIP 1 (milk reception, skimming, pasteurisation, in-line cooling)
Alkaline solution CIP 1 37.5 m3NaOH 2% 80 °C; renewal once a week
Acid solution CIP 1 40 m3HNO
31.5% 65 °C; renewal once a month
Cleaning in Place CIP 2 (cooling and storage of permeate of microfiltration, casein micelles concentrates, whey protein concentrates and lactose) Alkaline solution CIP 2 25 m3NaOH 2% 80 °C; renewal once a week
Acid solution CIP 2 40 m3HNO
31.5% 65 °C; renewal once a month
Cooling of the whole raw milk from 8 to 4 °C and storage at 4 °C; CIP 1 Milk skimming by centrifugation (at 50 °C), pasteurisation (72 °C, 20 s), in-line
cooling and storage of the skimmed pasteurised milk at 6 °C; CIP 1 Cooling of the raw cream from 50 to 6 °C and storage at 6 °C; CIP 1 Heating of the skimmed pasteurised milk from 6 °C to 50 °C and
Separation of the casein micelles from the whey proteins using microfiltration 0.1 µm
Production: Ceramic membrane, Uniform Transmembrane Pressure mode of operation
[26], 50 °C, crossflow velocity = 7 m·s−1; Concentration factor of casein
micelles = 3, Average permeation flux, Jav= 75 L·h−1·m−2; 2 × 9 h of production/
day)
Cleaning: 2 alkaline phases (55 °C and 80 °C) + 1 acid phase (65 °C). The composition of the complex detergent solutions is unknown; 2 × 2.5 h of cleaning/ day; single use
Cooling of the permeate of microfiltration from 50 °C to 15 °C and storage; CIP 2
(Recovery of energy from the pasteurisation step)
Cooling of the casein micelles concentrates from 50 °C to 4 °C and storage; CIP 2 Separation of the whey proteins from the lactose via
ultrafiltration + diafiltration
Production: Polymeric spiral-wound membrane, cut-off = 10 kg·mol−1, 15 °C,
Concentration factor of whey proteins = 30, Number of diafiltration = 3; Average permeation flux, Jav= 10 L·h−1·m−2; 20 h of production/day
Cleaning: 2 alkaline phases (both at 45 °C) + 1 acid phase (45 °C). The composition of the complex detergent solutions is unknown; 1 × 3 h of cleaning/day; single use
In-line cooling of the whey proteins concentrates from 15 to 4 °C and storage;
CIP 2
Concentration of the lactose via reverse osmosis
Production: Polymeric spiral-wound membrane, Reverse osmosis membrane, 15 °C, Concentration factor of lactose = 4, Average permeation flux, JavJ = 12 L·h−1·m−2;
20 h of production/day)
Cleaning: 2 alkaline phases (both at 45 °C) + 1 acid phase (45 °C). The composition of the complex detergent solutions is unknown; 1 × 3h of cleaning/day; single use
Cooling of the lactose from 15 °C to 4 °C and storage; CIP 2 Factory 2
Cleaning in Place CIP3 (equipments other than filtration plants) Alkaline solution CIP 3 25 m3NaOH 2% 80 °C; renewal once a week
Acid solution CIP 3 40 m3HNO31.5% 65 °C; renewal once a month
Formation of the precipitate of α-lactalbumin via acidification and dilution (56 °C, pH = 3.8); CIP 3
Separation of α-lactalbumin and β-lactoglobulin via microfiltration 0.1 µm
Production: Ceramic membrane, Uniform transmembrane Pressure mode of operation
[26], 53 °C, Concentration factor of casein micelles = 4.5; crossflow velocity = 7 m·s−1; Average permeation flux, J
av= 50 L·h−1·m−2; 2 × 9 h of
production/day
Cleaning: 2 alkaline phases (55 °C and 80 °C) + 1 acid phase (65 °C). The composition of the complex detergent solutions is unknown; 1 × 2.5 h of cleaning/ day); single use
Cooling of the β-lactoglobulin fraction from 50 °C to 15 °C; CIP 3
Concentration of the β-lactoglobulin fraction via ultrafiltration + diafiltration
Production: Polymeric spiral-wound membrane, cut-off = 10 kg·mol−1, 15 °C,
Concentration factor of whey protein = 4.5, Average permeation flux, Jav= 20 L·h−1·m−2
Cleaning: 2 alkaline phases (both at 45 °C) + 1 acid phase (45 °C). The composition of the complex detergent solutions is unknown); single use
Drying of the β-lactoglobulin fraction to produce a 96% total solids powder Cooling of the α-lactalbumin fraction from 50 °C to 15 °C; CIP 3
Resolubilisation of the α-lactalbumin in the tank (pH = 7.0); CIP 3 Concentration of the α-lactalbumin via ultrafiltration + diafiltration
Production: Polymeric spiral-wound membrane, cut-off = 10 kg·mol−1, 15 °C,
Concentration factor of whey protein = 4.5, Average permeation flux, Jav= 20 L·h−1·m−2
Cleaning: 2 alkaline phases (both at 45 °C) + 1 acid phase (45 °C). The composition of the complex detergent solutions is unknown; 1 × 3 h of cleaning/day); single use
described in Fig. 1. It includes the production phases, the cleaning phases (except the cleaning (chemicals, energy, water) of the spray dryers) with the waste water treatments, the associated equipments and the transport (100 km) between the two involved factories. Regarding the stainless steel equipment and the pumps, the life cycle of the system is estimated to 20 years based on the average life cycle of numerous other manufacturing processes. The life duration of membranes is, however shorter and it is estimated based on typically reported life durations depending on the membrane type (7 years for ceramic membranes; 2 years for polymeric membranes). The lifetimes of the different equipment have been adapted to a daily basis and ultimately, to the functional unit.
The geographical scope is France, where electricity is mainly pro-duced by nuclear power with a low emission of CO2. The facilities
(buildings, lightning, etc.), the disposal of equipments and the packa-ging of the final powders were excluded within the system boundaries. An attributional LCA was carried out. LCA is often performed using a functional unit that refers to the output/product of a process or a technology. However, for the fractionation process under investigation, it is not clear which of the different co-products has to be considered as the main output (the output with the highest value or quantity or the output the process will be optimised for). Moreover, as the objective of this study was not to estimate the environmental impact of the different
products but to examine the environmental impact of the process, the life cycle impacts were calculated for the whole process (two fac-tories + transport) treating 583 m3milk a day, which corresponds to
the amount of milk which is daily processed in a conventional French dairy plant.
The functional unit is then based on the whole process (2 fac-tories + transport) as previously done by others at the farm level (see for instance[29]) and not on the specific outputs (product fractions). The valorisation of the co-products (cream, casein micelles concentrates produced by MF, lactose, water from the RO permeate, whey proteins (β-lactoglobulin and α-lactalbumin)) were not taken into account and no allocation was performed.
2.3. Life cycle inventory
Life Cycle Assessment data (Ecoinvent V 3.0) were used to convert materials and fluids consumed during functioning into emissions and consumptions.
The most part of the foreground inventory data for the attributional LCA was either collected from industrial partners of the project (pri-mary and secondary data) or calculated by industrial partners them-selves (dairy processors, membrane and equipment manufacturer, wastewater treatment plant manufacturer) (Table 2).
Fig. 2. The heat exchangers network diagram (A) for the milk skimming + pasteurization + in-line cooling of skimmed milk; (B) for the skimmed milk
Table 2 Life Cycle inventory for the whole process: Main inputs and outputs per functional unit (the whole process treating 583 m 3/day). The letter in each box corresponds to E: experimental data, generated at pilot scale; I: Industrial data either directly collected from industrial partners of the project or calculated by industrial partners (dairy processors, membrane and equipment manufacturers, wastewater treatment plant manufacturer); S: simulated data obtained from the software SD2P ®. Production step Transport (tkm) Cleaning step Equipment Electricity (kWh) COP *= 2.5 Natural gas (kWh) Water ** (ton) Chemical agents (kg) Waste (kg) Electricity (kWh) COP = 2.5 Natural gas (kWh) Water for rinsing and cleaning (ton) Cleaning agents (kg) Wastes (kg _COD ) Chromium steel (kg) Others Cooling + storage of the milk 1138 na na 0.0075 (NH 3 ) na na 39 185.5 19.4 70.4 (NaOH 50%) 28 (HNO 3 50%) Utilisation of CIP1 52.6 4.67 0.07 kg (synthetic rubber) 4.12 g copper 8.0 g aluminium I I I I I I I I I Milk skimming + pasteurisation +in-line cooling and storage of skimmed milk ( Fig. 2 ) 2475 5407 4, CW 0.01 (NH 3 ) na na 58 439.8 25.6 179.2 (NaOH 50%) 16 (HNO 3 50%) Utilisation of CIP1 118.8 1.33 42.6 g copper 0.11 kg aluminium 0.12 kg synthetic rubber I I I I I I I I I I I Cooling + storage of the cream 1216 na 2, CW 0.0084 (NH 3 ) na na 39 196.5 2.55 70.4 (NaOH 50%) 28 (HNO 3 50%) Utilisation of CIP1 1.58 4.42 0.01 kg synthetic rubber 1.70 g copper 3.29 g aluminium I I I I I I I I I I Heating of the skimmed pasteurised milk (with recovery, Fig. 2 ) 157 15,021 na na na na 1364 2648 51.25 941 (NaOH 50%) 37 (NaOCl 15%) 138 (HNO 3 50%) 48 0.152 0.035 kg synthetic rubber 6.78 g copper 13.2 g aluminium I I I I Microfiltration, for the fractionation of casein micelles and whey proteins 7996 na 7, CW 0.0127 (NH 3 ) na na Confidential *** Confidential *** I I I I I I I I Cooling and storage of the MF permeate (with recovery, Fig. 2 ) 0 na 2, CW na na na 39 116 7.5 44 (NaOH 50%) 10 (HNO 3 50%) Utilisation of CIP2 30 2.31 0.035 kg synthetic rubber 2.94 g copper 5.71 g aluminium I I I I I I I I I Cooling and storage of the casein micelle concentrates (MF retentate) 3685 na 1.8, CW 0.0257 (NH 3 ) na na 58 230 18.9 88 (NaOH 50%) 20 (HNO 3 50%) Utilisation of CIP2 47.7 2.75 0.03 kg synthetic rubber I I I I I I I I I I (continued on next page )
Table 2 (continued ) Production step Transport (tkm) Cleaning step Equipment Electricity (kWh) COP *= 2.5 Natural gas (kWh) Water ** (ton) Chemical agents (kg) Waste (kg) Electricity (kWh) COP = 2.5 Natural gas (kWh) Water for rinsing and cleaning (ton) Cleaning agents (kg) Wastes (kg _COD ) Chromium steel (kg) Others Ultrafiltration, UF for the concentration of whey proteins 2213 na 75 (63, DF + 12, CW) 0.0001 (NH 3 ) na na 230 373 30.5 24 (NaOH 50%) 8 (HNO 3 50%) 7 (NaOCl 15%) 5 (phosphoric acid 85%) 12(tensioactive) 6(confidential) 19 Confidential *** Confidential *** I I I I I I I I Cooling and storage of the whey protein concentrates (UF retentate) 129 na na 0.0016 (NH 3 ) na na 19 116 4.5 44 (NaOH 50%) 10 (HNO 3 50%) Utilisation of CIP2 20 0.385 0.006 kg synthetic rubber I I I I I I I I I Reverse Osmosis, RO for the concentration of lactose 1535 na 6, CW na na na 200 382 24.0 5.0 (Acid) 3.0 (tensioactives) 4 Confidential *** Confidential *** I I I I I I I Cooling and storage of the lactose (RO retentate) 172 na na 0.0032 (NH 3 ) na na 19 116 7.5 44 (NaOH 50%) 10 (HNO 3 50%) Utilisation of CIP2 29 0.92 0.01 kg synthetic rubber I I I I I I I I I Waste Water Treatment 1 5050 12 (FeCl) Sludge N:12 kg P: 4.25 kg na na na na na na na na I I I Transport + transfer 1.2 na na na na 1370 19 na 2.5 44 (NaOH 50%) 9.9 0.118 2.91 g copper 5.64 g aluminium I I I I I I I I Formation of the precipitate of α-Lactalbumin by acidification + dilution na 2095 35, DW 192.9 (citric acid) na na 19 230 3.0 76 (NaOH 50%) 20 (HNO 3 50%) Utilisation of CIP3 44 0.728 7.08 g copper 13.7 g aluminium E E E E E E E E E E MF for the fractionation of α-Lactalbumin and β-Lactoglobulin 2618 947 117 (34, DF + 83, CW) 2.2 (citric acid) 0.003 (NH 3 ) na na 480 883 11.75 320 (NaOH 50%) 73 (HNO 3 50%) 11 (NaOCl 15%) 24 Confidential *** Confidential *** E+I E+I E+I E+I I I I I I (continued on next page )
Table 2 (continued ) Production step Transport (tkm) Cleaning step Equipment Electricity (kWh) COP *= 2.5 Natural gas (kWh) Water ** (ton) Chemical agents (kg) Waste (kg) Electricity (kWh) COP = 2.5 Natural gas (kWh) Water for rinsing and cleaning (ton) Cleaning agents (kg) Wastes (kg _COD ) Chromium steel (kg) Others Cooling of the β-Lactoglobulin fraction (MF permeate) 1186 na na 0.0083 (NH 3 ) na na 19 115 1.5 38 (NaOH 50%) 10 (HNO 3 50%) Utilisation of CIP3 22 0.025 0.06 kg synthetic rubber I I I I I I I I I UF for the concentration of β-Lactoglobulin + diafiltration 234 na 16.6 (4.6, DF + 12, CW) na na na 25 144 5.6 5 (NaOH 50%) 1.5 (HNO 3 50%) 0.9 (phosphoric acid 85%) 1(NaOCl 15%) 2.3 (tensioactive) 1.2 (confidential) 3.5 Confidential *** Confidential *** E+I E+I E+I E+I E+I E+I I Drying of the β-Lactoglobulin fraction 770 7700 15.7 (10, CW + 5.7, EW *) na 18 (powder for disposal, 22.9% water) na Data not collected 0.391 0.0384 kg copper 0.0816 kg aluminium S S S S I I Cooling of the α-Lactalbumin fraction (MF retentate) 74 na na 0.0005 (NH 3 ) na na 19 115 1.5 38 (NaOH 50%) 10 (HNO 3 50%) Utilisation of CIP3 17 0.025 0.06 kg synthetic rubber I I I I I I I I I Resolubilisation of α-Lactalbumin na na 0.5, DW 10 (CaCl 2 ) 40 (NaOH) na na 19 115 1.5 38 (NaOH 50%) 10 (HNO 3 50%) Utilisation of CIP3 32 0.29 zero E E E E E E E E UF for the concentration of α -Lactalbumin + diafiltration 137 na 14.7 (2.7, DF + 12, CW) na na na 15 12 1.2 0.8 (NaOH 50%) 0.3 (HNO 3 50%) 0.1 (phosphoric acid 85%) 0.2 (NaOCl 15%) 0.4 (tensioactive) 0.2 (confidential) 0.8 Confidential *** Confidential *** E+I E+I E+I E+I E+I E+I I Drying of the α-Lactalbumin fraction 146 1456 11.1 (10, CW + 1, EW) na 3.6 (powder for disposal, 22.9% water) na Data not collected S S S S (continued on next page )
In the first factory (reception of the raw milk, preparation of casein micelles concentrates used in cheese manufacture, concentration of the whey proteins) unit operations have been assembled in an effective industrial process and data required for the study were obtained from industry partners (both equipment manufacturer, Novasep; and dairy processor, Soredab - Savencia). The exact design of the factory 1 was done by the equipment manufacturer Novasep based on its high ex-perience on the domain. Flow rates, temperatures and pressures were measured on sites with specific sensors in two different real factories of Savencia group. Energy consumptions, volumes of fluids and masses of products were calculated from the measured data by taking into ac-count the characteristics of the equipment (mainly pumps, heat ex-changers, heaters) and duration of the various steps of the process. When comparison was possible, the data calculated by equipment manufacturer were shown to be consistent with on-site measurements. In the second factory (fractionation and concentration/drying of enriched whey protein fractions) unit operations have been assembled in an innovative process to fractionate individual whey proteins. The data required for the filtration designs of this part of the process (fac-tory 2) were provided by the equipment manufacturer Novasep. These data were completed by results obtained from specific experiments that have been carried out by the project partners. Specific experiments were performed:
– at the dairy platform of the STLO “Science and Technology of Milk and Eggs” research unit from the French National Institute for Agricultural Research (INRA) in order to define the adequate op-erating parameters required for the precipitation and solubilisation of whey proteins;
– at the STLO research unit in order to identify the optimal operating conditions and quantify the energy consumption of spray dryers by use of the software SD2P®. This software is largely used to optimise drying processes at industrial scale[30].
– at the Institute of “Sciences Chimiques de Rennes” (ISCR) in order to identify the best operating parameters for the cleaning of filtration experiments.
2.4. Life cycle impact assessment
The life cycle impact assessment methods Impact 2002+ (hereafter I2002+)[31], ReCiPe[32]and USEtox[33]have been deliberately chosen in this study. As resource efficiency is considered as a key ele-ment for sustainable developele-ment and the capacity of impact assess-ment methods to answer to resource sustainability challenges is widely debated, two different state-of-the-art impact assessment methods (I2002+ and ReCiPe) were chosen to address sustainability of resource use. I2002+ has the advantage of being a combined midpoint and damage approach including the impact category of non-renewable en-ergy, which is particularly relevant for the presented case study due to the high energy consumption. ReCiPe is a recent and complete impact assessment method taking into account some impact categories that are not addressed in I2002+ such as water depletion. It is provided in three different cultural perspectives: individualist (I, short-term interest), hierarchist (H, based on the most common policy principles) and ega-litarian (E, long-term, precautionary) corresponding to a set of choices that affect the characterisation factors. In this work, the default hier-archist (H) perspective has been chosen because the corresponding characterisation factors are well balanced between a short- and a long-term perspective and are therefore considered to give the most realistic estimation of the potential environmental impact[32]. USEtox is cur-rently the most widely accepted assessment method for toxicological matters including the sub-groups freshwater ecotoxicity and human toxicity[33,34].
Note that in the different impact assessment methods characterisa-tion factors for certain substances are not available thus leading to an underestimation of the environmental impact.
Table 2 (continued ) Production step Transport (tkm) Cleaning step Equipment Electricity (kWh) COP *= 2.5 Natural gas (kWh) Water ** (ton) Chemical agents (kg) Waste (kg) Electricity (kWh) COP = 2.5 Natural gas (kWh) Water for rinsing and cleaning (ton) Cleaning agents (kg) Wastes (kg _COD ) Chromium steel (kg) Others Waste Water Treatment 2 167 2 (FeCl) Sludge N:2 kg P: 0.5 kg na na na na na na na na I I I na: not applicable. * COP: Coefficient Of Performance. ** Types of water (CW: cooling water for the pumps; DF; diafiltration water; DW: dilution water; EW: evaporated water). *** Membrane materials and peripheral equipments (e.g. membrane housing, pumps, gaskets, etc.) were taken into account.
Two different ways were chosen to display the impact assessment results:
– on the one hand single score (weighted average of the different endpoint scores) results are presented in order to show the percen-taged contribution of the different unit operation processes to the overall impact
– and on the other hand, characterised results based on midpoint factors are shown to demonstrate the contribution of the individual unit processes to every impact category.
While the single score illustration is effective and easy to under-stand, it bears potential biases and therefore the danger of mis-interpretation due to (i) the use of the less accurate endpoint char-acterisation factors (put simply, endpoint describes the consequences of an environment impact trigger that occur at a later stage while mid-point describes those occurring more immediately), (ii) a normalisation step (i.e. putting the results into a regional context by dividing them by an accordant normalisation set, in this case the European one) after which certain impact categories are excluded due to missing data for the normalisation sets and (iii) a weighting step (by arbitrary assigning importance to the different endpoint categories; in this case the average weighting is applied: for I2002+, equal weighting of the 4 damage categories[35]and for ReCiPe, dividing by the accordant damage costs [36]). Therefore, the characterised, “raw” results based on the more precise midpoint characterisation factors are also published.
SimaPro 8.0 software was used to calculate the environmental im-pact based on the different environmental categories that are con-sidered by each method.
3. Results
3.1. The environmental impact of the entire milk protein fractionation process
3.1.1. Contribution of the four sub-processes: production, cleaning, equipment and transport
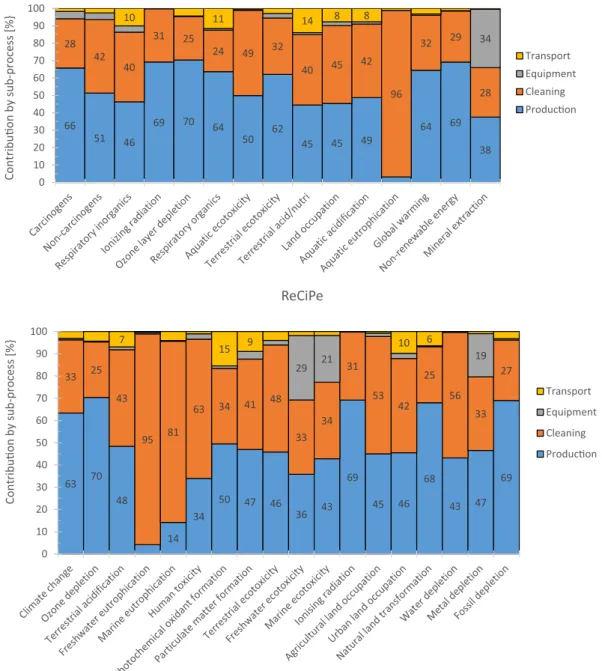
Fig. 3(in addition toTables A1 and A2in the Appendix) demon-strates the characterised environmental impacts of the entire milk protein fractionation processes divided by the four sub-processes pro-duction, cleaning, equipment and transport per impact category.
The results shown inFig. 3(andTables A1 and A2) point out the fact that production and cleaning are the stages that contribute to the en-vironmental impact for the most part. The production phase is the most impacting one and responsible for 65% and 58% of the total environ-mental impact according to I2002+ and ReCiPe, respectively (ac-cording to the single score evaluation), followed by the cleaning phase, which contributes to the extent of 31% and 34% of the total environ-mental impact according to I2002+ and ReCiPe, respectively. Ac-cording to both impact assessment methods, the cleaning stages are almost solely responsible for aquatic eutrophication (96% and 95% for I2002+ and ReCiPe, respectively) (Fig. 3). Generally, however, ReCiPe suggests a more significant contribution of the cleaning stages to the total environmental impact compared to the results obtained by I2002+. The dominant contribution of the cleaning phase to water depletion becomes visible (Fig. 3ReCiPe).
Among the comparable impact categories between the two different impact assessment methods, similar contributions from the production and the cleaning phases can be found, except for the categories ter-restrial and freshwater ecotoxicity. For terter-restrial ecotoxicity ReCiPe assesses a higher contribution of the cleaning phase (48% compared to the production phase 46%) than I2002+ (32% compared to the pro-duction phase 62%). For freshwater ecotoxicity ReCiPe assesses a lower contribution of the cleaning phase (33% compared to the production phase 36%) than I2002+ (Aquatic ecotoxicity: 49% compared to the production phase 50%).
Neither the transport (3 and 4% with I2002+ and ReCiPe, respec-tively, according to the single score evaluation) nor the equipment (1 and 4% with I2002+ and ReCiPe, respectively) record a significant contribution to the overall environmental impact. I2002+ displays the impact of the equipment on mineral extraction and ReCiPe highlights its impact on both freshwater and marine ecotoxicity in addition to metal depletion. Although I2002+ includes the category aquatic eco-toxicity, the contribution of the equipment is not reflected. This is due to the fact that heavy metals, constituent parts of the equipment are only considered if they are emitted in dissolved form[31].
Note that the contribution of the cleaning phases to the overall environmental impact is underestimated for various reasons.
First, a normalisation step is required when single scores are cal-culated, which leads to exclusion of relevant categories due to missing data. After the normalisation step with I2002+ for instance, both ca-tegories aquatic acidification and aquatic eutrophication drop out due to a lack of according data for this step[31]. With ReCiPe, the category water depletion is not taken into account in the calculation of the single score[32].
Second, in the ReCiPe method, water depletion is generally included but because no normalisation set is available for this category, it dis-appears when single score impacts are calculated. The same is true for the category marine eutrophication[32]. Aquatic eutrophication and water depletion are, however, particularly relevant for this study due to the high freshwater consumption and the discharge of equally high volumes of wastewater.
Moreover, for all methods, the impact of the cleaning phase is sys-tematically underestimated because data for many cleaning agents or solutions are missing and are therefore not taken into account in the assessment of its environmental impact. Membrane cleaning, for ex-ample, requires complex cleaning solutions that contain a number of molecules, whose chemical identity is not always known and if it is known the amount in the detergent is unknown.
The contribution of water use to the environmental impact is only imprecisely estimated due to high volumes that are used for both rin-sing and preparation of cleaning and disinfection solutions. Some of that water can be recycled for CIP of all equipments, except CIP of membranes which is generally performed in single use mode. In fact, the freshwater consumption is not taken into account in the I2002+ method. Water depletion is at least considered in the ReCiPe method. Ridoutt and Pfister [37] recommend a separate water footprint in-dicator that combines the consumptive with the degradative use of water by using the ReCiPe method. However, it is not consulted in this study due to several uncertainties in its computation such as the local water stress factor and the variable factor for global water stress.
3.1.2. Toxicological assessment of the four sub-processes
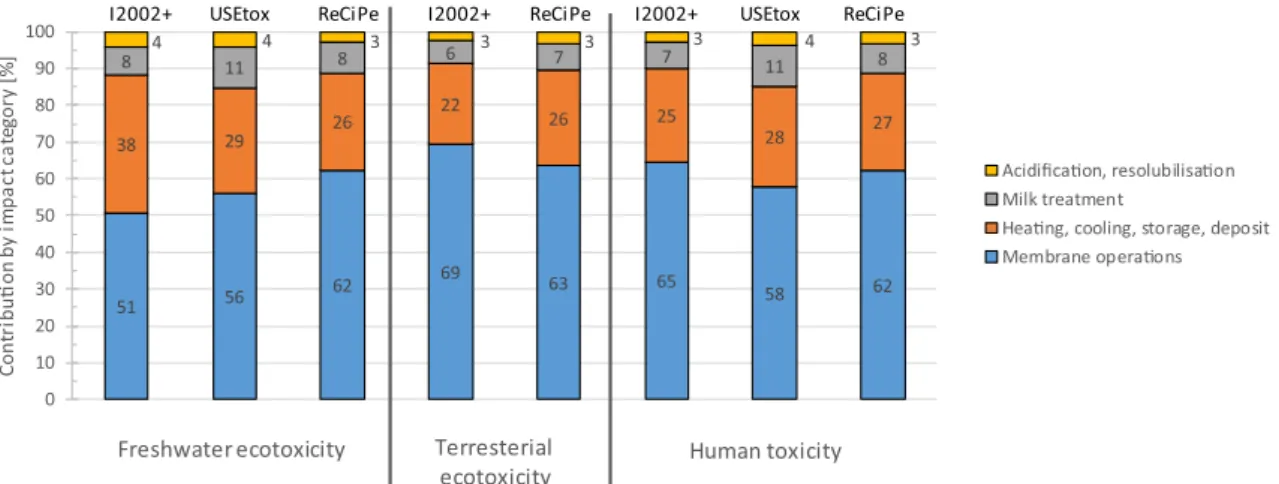
Fig. 4(andTable A3in the Appendix) displays the toxicological impact of the entire milk protein fractionation process divided by the four sub-processes production, cleaning, equipment and transport. In addition to the two so far utilised methods I2002+ and ReCiPe, the USEtox method is consulted because it provides the most accurate toxicological assessment[33,34].
Fig. 4highlights the toxicological impact of the four sub-processes production, cleaning, equipment and transport classified into fresh-water and terrestrial ecotoxicity (the latter is not available in USEtox) and human toxicity. Clearly, production and cleaning are the sub-pro-cesses with the highest toxicological impact. However, the estimation of the individual contribution of the four sub-processes to the total tox-icological impact is different depending on the method used. I2002+ assesses an equal contribution of both the production and the cleaning phases to freshwater ecotoxicity. According to USEtox and ReCiPe, the contribution of the cleaning phase is less but instead, USEtox and Re-CiPe disclose a non-negligible contribution from the equipment and even a certain contribution from the transport (USEtox). For terrestrial ecotoxicity ReCiPe finds a much higher contribution of the cleaning
phase, and accordingly a lower contribution of the production phase than I2002+. For human toxicity, both USEtox and ReCiPe estimate a much higher contribution of the cleaning phase than I2002+. In gen-eral, it can be noted that the results presented inSection 3.1show that both the production and the cleaning phase cause the vast majority of the environmental impact of the entire milk protein fractionation pro-cess. The contribution of the different unit processes of both phases is hence investigated in greater detail in the following sections.
3.2. The environmental impact of the production phase of the milk protein fractionation process
3.2.1. Contribution of the main production unit processes
Fig. 5(in addition toTables A4 and A5in the Appendix) demon-strates the characterised environmental impact of the production phase of the milk protein fractionation processes divided by the five groups of unit operations: membranes, “heating, cooling and storage”, milk
treatment, “acidification and resolubilisation” and drying. It then re-veals the contribution of the different production unit processes to the individual impact categories.
The dominant contribution to the environmental impact actually primarily comes from the membrane operations and only secondly from the thermal and storage operations (Fig. 5). For some categories, membrane operations are responsible for 50% of the total impact (see ionic radiation, for instance, due to the nuclear power used in France). Based on the assessment according to ReCiPe (Fig. 5) the considerable impact of membrane processes on water depletion is obvious.
Membrane operations consume high amounts of energy (electricity for the pumps and natural gas for temperature control of the product) and water (cooling of the pumps) in the production phase, thus gen-erating a considerable impact on the environment. Among the different membrane operations used in the overall process, the first microfiltra-tion carried out with 0.1 µm ceramic membrane at high crossflow ve-locity (7 m·s−1) temperature (50 °C) for the fractionation of milk into
Fig. 3. Contribution of the four sub-processes to the total environmental impact of the milk protein fractionation process per impact category according to the impact
Fig. 4. Contribution of the four sub-processes to the total toxicological impact according to I2002+, ReCiPe (H) midpoints and USEtox.
Fig. 5. Contribution of the production process units to the environmental impact of the production phase per impact category, according to the impact assessment
casein micelles concentrates and whey proteins is the main contributor to the environmental impact: according to I2002+, 52% of the en-vironmental impact is attributed to membrane operations (and 48% according to ReCiPe respectively) are attributed to this single micro-filtration. Other filtration processes equipped with polymeric mem-branes (UF and RO) could be less impacting as they require much lower crossflow velocity and electricity for pumps.
Heating and cooling operations also require high amounts of energy and water, the latter often functioning as the cooling or heating medium. Milk treatment, spray-drying and the acidification and re-solubilisation operation units show smaller but not negligible con-tributions to the overall impact of the production phase. It is note-worthy that the environmental impact of the drying operation, largely known as high energy consumer, is not of prime importance in this study due to the relatively low amount of products that needs to be spray-dried (only 12,000 L of dairy products enter the second factory) compared to the large volumes of dairy products being treated by heat exchangers and filtration operation units, mainly in the first factory (583 m3of milk treated).
3.2.2. Toxicological assessment of the production unit processes
Fig. 6(andTable A6in the Appendix) shows that both the mem-brane and the heating, cooling and storage operations exhibit the highest toxicological impact among all production unit operations. However, unlike I2002+ the assessment of freshwater ecotoxicity ac-cording to both USEtox and ReCiPe shows the non-negligible con-tribution of the drying units. In contrast, the concon-tribution of the membrane operations is significantly lower. In terms of terrestrial ecotoxicity ReCiPe finds a considerable contribution from the acid-ification and resolubilisation unit, while the same seems to play no role according to I2002+. For human toxicity, I2002+ assesses a low contribution of the membrane processes in favor of a higher contribu-tion from the heating, cooling and storage unit operacontribu-tions in addicontribu-tion to the milk treatment and the drying units. In turn, both USEtox and Re-CiPe find a dominant contribution of the membrane operations to human toxicity, followed by a considerable contribution from the heating, cooling, and storage units. Based onFig. 6it can be noted that the toxicological assessment according to USEtox estimates contribu-tions of the different unit operacontribu-tions that lie somewhere between those calculated based on I2002+ and ReCiPe.
3.3. The environmental impact of the cleaning phase of the milk protein fractionation process
3.3.1. Total contribution of the main cleaning unit processes
Fig. 7(in addition toTables A7 and A8in Appendix) demonstrates the characterised environmental impact of the cleaning phase of the milk protein fractionation processes divided by the four groups of unit operations: membranes, “heating, cooling and storage”, milk treatment and “acidification and resolubilisation”. It permits a differentiate and accurate view on the contribution of the cleaning unit processes to the individual impact categories.
Membrane operations have by far the highest contribution to the total environmental impact in all impact categories even despite the underestimation due to a lack of characterisation factors and data for certain cleaning agents and despite the fact that I2002+ does not ac-count for the freshwater consumption. The high proportion of the membrane cleaning to the environmental impact of the entire cleaning phase is due to inevitable multiple cleaning steps, typically performed in single-use mode that require high amounts of water of high quality in addition to cleaning agents and electricity and gas for the mode of operation (pumps and temperature control during the cleaning pro-cess). Clearly such results underline the absolute need for rationalisa-tion of the CIP of membranes, something that is not often studied in literature[38–40].
Note that no data are available for cleaning of the drying units, but it is well known that the cleaning cycles of spray dryers are less frequent than those for membrane operations (cleaning every ∼20 h) and mainly require simple chemicals (caustic soda and nitric acid). However, the accordant impact cannot be shown here. Cleaning of the milk treatment devices and the acidification and resolubilisation units exhibits only a minor impact. In this case, the differences in the as-sessment between the I2002+ and the ReCiPe method are not very significant.
3.3.2. Toxicological assessment of the cleaning unit processes
Also from a toxicological point of view, cleaning of membranes exhibits by far the highest impact (Fig. 8,Table A9in the Appendix). Like in the previous toxicological assessments the contribution of the different unit processes to the total environmental impact varies with the impact assessment method used. With regard to freshwater eco-toxicity membrane cleaning contributes between 51% and 62% among
Fig. 7. Contribution of the unit processes to the environmental impact of the cleaning phase per impact category according to the impact assessment method I2002+
and ReCiPe (H) midpoints.
the regarded unit processes according to I2002+ and ReCiPe, respec-tively. The proportion of membrane cleaning to terrestrial ecotoxicity varies between 63% and 69% according to I2002+ and ReCiPe, re-spectively and to human toxicity between 58% and 65% according to USEtox and I2002+, respectively.
3.4. Uncertainty analysis
As the majority of the life cycle impact data came from real in-dustry, the accuracy of data was good. Values measured on sites (such as flow rate) are usually validated by calculations or measurements done by the manufacturers themselves (such as volume or concentra-tion of proteins). The main sources of uncertainty stem from the life cycle impact assessment itself (the modeled impact factors, the nor-malisation functions, etc.), and, in the case of cleaning solutions, stem particularly from the missing data related to the complex detergents solutions. The determination of the missing data related to cleaning solutions is then of prime importance, but out of the scope of this study. The results for the contributions of both the production and the cleaning phases and the different unit processes are very explicit and therefore, common measurement uncertainties would not make any difference to the conclusions.
Nonetheless, uncertainty analysis on the Coefficient Of Performance (COP) was applied to check the robustness of the contribution of the unit processes against plausible ranges of variations of this operation parameter. In the manufacturing industry the COP (−) has a direct effect on the energy consumption of the installation for production of cold water and can vary to a certain range. In this study, the realistic, expectable COP variations (from 1.7 to 4.5, average value considered in the calculations of Table 2= 2.5) have been considered and it was found that the global environmental impact differs by maximal 15% between the best and the worst COP (results not shown) with no sig-nificant modifications of the contribution and relative ranking of the unit processes.
4. Discussion
4.1. Comparison with literature results
Few publications exist on the environmental impact of food manu-facturing processes involving membrane operation units. However, a number of studies are available relating to the environmental impact of water treatment processes, which very often include membrane op-erations. Since the membrane operations in this exemplary milk protein fractionation process seem to play a decisive role for the environmental impact of the overall process, it is interesting to take a closer look at the different assessment results from the literature to get an idea of the environmental performance of membrane processes.
The variety of scopes of the LCA studies and the differences in classical LCA features such as the functional unit, to which the en-vironmental impacts are related, the use of databases, impact assess-ment methods and impact categories impede a strict comparison of the results. However, regardless of the studies, the electricity consumption of membrane processes is generally well documented and the analysis of the published studies concludes that electricity consumption has the highest overall impact, which is reflected in the global warming po-tential[41–46]. In fact, the contribution of the membrane operations of the regarded milk protein fractionation process exhibits by far the highest impact in the category non-renewable energy, which is closely related to electricity consumption.
With regard to toxicity Tangsubkul et al.[47]showed that mem-brane operations (in the case of water purification) exhibit quite a variable impact depending on both the operation mode and the cleaning options. Our results confirm that the toxicity of membrane operations is not negligible.
Davis et al.[48]calculated the environmental impact as a result of changing the production of fermented milk from using condensed milk produced by evaporation to using nanofiltered “milk” and they found that the impact of the latter alternative was much smaller. They do not provide a detailed assessment at unit process level thus preventing a direct comparison with our results, but since the energy consumption of evaporation is much higher than that of nanofiltration, this result was expected. Their findings suggest that utilisation of membranes in the dairy manufacturing industry as an alternative to common concentra-tion operaconcentra-tions such as evaporaconcentra-tion can have a positive effect on the environmental impact.
Considering fractionation processes, membrane operation can also be attractive: it was shown, for production of enriched fractions of α-lactalbumin and β-lactoglobulin, and similar functional unit, that the overall environmental impact of using membranes is smaller compared to that of chromatography[49].
4.2. Possible improvements of the milk protein fractionation process
The milk protein fractionation process (Fig. 1) contains a number of cooling and heating operations, and a number of membrane operations which have a significant contribution to the overall environmental impact of the process, both during the production and the cleaning stages.
In order to reduce the overall environmental impacts some efforts should be made to improve both the thermal steps and the filtration operations.
Cooling and heat treatments are indispensable to prevent microbial spoilage of the milk and dairy products. These products need to be heated to a certain temperature for optimal processing and for sanitary purposes thus rendering the frequent cooling and heating processes essential. However, heat treatment and storage of the products could be reduced by improving heat recovery in the process. In factory 2 for instance, the heating of the concentrate of soluble proteins from 4 to 56 °C (to form the precipitate of α-lactalbumin) could probably be re-duced by appropriate heat exchange with another part of the plant (option not exploited in this work).
Focusing on filtration operation units, some efforts should be spe-cifically oriented towards microfiltration (using ceramic membrane), which is the operation which generates environmental impacts for the most part. The process was initially designed using ceramic membranes, because these membranes are traditionally used for the fractionation of casein micelles and soluble proteins [25]. The separation is usually performed at 50–55 °C, with high crossflow velocity (7 m·s−1) and using
the Uniform Transmembrane Pressure, UTP, mode of operation[26] which requires a permeate pump and then leads to a high energy consumption. Some other membrane alternatives exist and could be used for this separation, however their benefit on environmental im-pacts need to be investigated, as conflicting effects may occur when considering optimisation of the MF process. New conception of ceramic membranes such as GP Membralox® membranes from Pall-Exekia or Isoflux™ membranes from Tami-Industries could advantageously be used because they avoid permeate circulation loop and extra invest-ments and running costs due to the permeate pump. However, this conception of membranes leads to lower filtration performance (lower
retention of casein micelles, for instance)[50]which results in mod-ifications of the process applied to the permeate fractions in order to obtain purified whey protein concentrates. Polymeric spiral wound membranes could also be installed, because of their reduced capital and running costs (polymeric membranes MF is carried out at low tem-perature of 10–12 °C with low crossflow velocity). But performances of polymeric membranes are reported to be very low (permeation flux around 10 L·h−1·m−2 with a low protein transmission around 30%
compared to 60% for ceramic membranes[25,50]) which lead in major process design modifications: diafiltration (purification with water) is increased to improve the whey protein removal in the enriched casein fraction; membrane area is increased to compensate the low permeation flux. Polymeric membranes could be an alternative to ceramic mem-branes but it first becomes necessary to investigate the technical and environmental performances of these membranes: a change such as the use of polymeric membranes instead of ceramic membranes would re-sult in severe changes of the process which have to be evaluated. This still results in an ongoing challenge especially when industrial users decide to install a new plant. Comparative assessment of the different membranes operations and processes could thus be of high interest, including cleaning procedures and evolution of the product quality that are very different when using ceramic and polymeric spiral MF mem-branes.
This study also points out the fact that the cleaning phase is re-sponsible for about a third of the total environmental impact of the process and that the contribution of the unit processes to the overall environmental impact of the cleaning phase is clearly dominated by cleaning of the membranes (especially when taking into account that this impact would actually be much higher if data and characterisation factors for certain cleaning agents was available). To reduce the en-vironmental burden of the membrane cleaning stages two major stra-tegies could be applied: (1) the reutilisation of the process water from the reverse osmosis used for the concentration of the milk proteins as rinsing water or water for the preparation of cleaning solutions, in order to reduce water consumption [18,51]. This strategy requires supple-mentary equipment for treatment of the permeate produced by reverse osmosis thus generating an additional impact; and (2) the rationalisa-tion of the membrane cleaning[38,40,52], i.e. implementation of ob-jective and rational arguments in addition to the reduction of the op-erating time and the effluent volume and load. This would, for example include reduction of the duration of each cleaning procedure, the cleaning temperature and reduction of the acid cleaning sequence when mineral fouling is limited. The environmental impact of such strategies still needs to be assessed, knowing that both strategies could also be coupled thus reducing the total environmental impact of the cleaning phase to an even greater extent. Note that with increasing age of the equipment and in particular of the polymeric membranes, the perfor-mance of polymeric membranes will decrease due to inevitable mem-brane degradation that favor fouling of the material[40]. Hence, in the course of the membrane life cycle, more energy will be necessary for their operation. Also, more frequent cleaning of the membranes will be necessary thus demanding higher amounts of water, cleaning agents and energy thus adding to the environmental impact.
Reduction of the environmental impact of the entire fractionation process can furthermore be projected through improvement of the en-ergy-efficiency of the existing equipment [18], for instance by in-corporating a concentration step prior to final spray drying[54]; or use of alternative technologies, such as centrifugation to separate the α-lactalbumin precipitate from the soluble β-lactoglobulin[53]Prior to anticipating alternative technologies a comprehensive evaluation of their suitability should be conducted. Moreover, use of more
environmentally friendly refrigerants, regular maintenance[18], use of enzymatic cleaning agents, instead of complex cleaning solutions [19,54]or ozone[55]and optimisation of the CIP programs can sub-stantially reduce the overall environmental impact of dairy (and other) manufacturing processes; several remarks and suggestions are made by Rabiller-Baudry and co-workers[38,56–58] on CIP of UF polymeric spiral membranes during filtration of skimmed milk such as to reduce the temperature and to switch from alkaline cleaning solutions to spe-cial solutions used for ceramic MF membranes[56]in addition to the use of biodegradable detergents. However, the extent of application of the different strategies highly depends on the processing requirements of the particular (dairy) product and on the membrane material and cut-off.
The environmental impact caused by electricity consumption will highly vary among the different countries and the accordant energy mix used. France currently relies for the most part on nuclear power, which shows low CO2 emissions. However, the disposal phase and the
re-sulting treatment and storage of radioactive waste are not considered in the characterisation factors, thus likely misestimating the impact of electricity consumption.
Last but not least, for a comprehensive weighing of the environ-mental impact of certain food processes the nutritional and/or the economic value of the product(s) would need to be taken into account as well.
Note that the results obtained in this study stem from an attribu-tional LCA and should hence not to be lightheadedly extrapolated to different production scales.
5. Conclusion
The environmental impact of an exemplary industrial milk protein fractionation process has been assessed with equal focus on the con-tribution of the production and the cleaning stages. The environmental impact assessment was carried out applying LCA and using the I2002+ and the ReCiPe methods. USEtox was additionally consulted for the toxicological assessment. In general, the results vary depending on the impact assessment method used. Nevertheless, general conclusions can be drawn from this study. Both the production and the cleaning phases are surely the most impacting ones compared to the impact stemming from the equipment and the transport. At a single score level, the production phase accounts for more than 65% of the environmental impact of the entire food manufacturing process, and the cleaning phase for about 31% of the total impact. The impact of the cleaning stages is even underestimated because of missing data and character-isation factors for certain cleaning agents and additionally for I2002+ due to exclusion of the freshwater consumption. The most impacting unit processes of both the production and the cleaning phase are the membrane operations and the heating, cooling and storage units. Hence, for reduction of the overall environmental impact of the milk protein fractionation process it is advisable to primarily focus on im-provement and optimisation measures of thermal and membrane pro-cesses during production and cleaning stages.
Acknowledgement
This work was carried out with the financial support of the “ANR – Agence Nationale de la Recherche – The French National Research Agency” under the “Programme National de la Recherche en Alimentation et nutrition humaine”, project “ANR-06-PNRA-015”. We are most grateful to MEANS-INRA platform for its contribution in achieving the here-presented work.
Appendix A
The values given in the tables refer to the functional unit, i.e. the whole process treating 583 m3/day (seeTables A1–A9).
Table A1
Contribution of the four sub-processes to the total environmental impact of the milk protein fractionation process per impact category according to I2002+.
Impact category Unit Production Cleaning Equipment Transport Carcinogens kg C2H3Cl eq 9.99E+01 4.30E+01 6.48E+00 2.57E+00
Non-carcinogens kg C2H3Cl eq 7.94E+01 6.53E+01 5.95E+00 3.97E+00
Respiratory inorganics kg PM2.5 eq 3.98E+00 3.44E+00 3.14E−01 8.58E−01 Ionising radiation Bq C-14 eq 3.49E+06 1.54E+06 3.88E+03 5.65E+03 Ozone layer depletion kg CFC-11 eq 1.43E−03 5.06E−04 7.04E−06 8.78E−05 Respiratory organics kg C2H4eq 2.26E+00 8.50E−01 3.39E−02 4.08E−01
Aquatic ecotoxicity kg TEG water 2.10E+06 2.06E+06 1.66E+04 2.86E+04 Terrestrial ecotoxicity kg TEG soil 3.50E+05 1.83E+05 1.42E+04 1.66E+04 Terrestrial acid/nutri kg SO2eq 8.79E+01 7.99E+01 2,22E+00 2,75E+01
Land occupation m2org.arable 3.94E+01 3.89E+01 1.83E+00 6.69E+00
Aquatic acidification kg SO2eq 2.53E+01 2.20E+01 6.89E−01 3.97E+00
Aquatic eutrophication kg PO4P-lim 9.35E−02 2.85E+00 1.94E−03 3.39E−02
Global warming kg CO2eq 1.13E+04 5.58E+03 1.28E+02 5.55E+02
Non-renewable energy MJ primary 5.06E+05 2.14E+05 2.03E+03 9.03E+03 Mineral extraction MJ surplus 5.31E+02 4.02E+02 4.74E+02 6.84E+00
Table A2
Contribution of the four sub-processes to the total environmental impact of the milk protein fractionation process per impact category according to ReCiPe (H) midpoints.
Impact category Unit Production Cleaning Equipment Transport Climate change kg CO2eq 1.17E+04 6.09E+03 1.31E+02 5.66E+02
Ozone depletion kg CFC-11 eq 1.43E−03 5.06E−04 7.05E−06 8.78E−05 Terrestrial acidification kg SO2eq 2.31E+01 2.07E+01 6.29E−01 3.29E+00
Freshwater eutrophication kg P eq 2.92E−02 6.66E−01 5.23E−03 2.25E−03 Marine eutrophication kg N eq 6.84E−01 3.92E+00 1.50E−02 1.95E−01 Human toxicity kg 1.4-DB eq 6.36E+02 1.17E+03 4.51E+01 1.91E+01 Photochemical oxidant formation kg NMVOC 1.82E+01 1.25E+01 4.25E−01 5.67E+00 Particulate matter formation kg PM10 eq 7.71E+00 6.67E+00 5.69E−01 1.47E+00 Terrestrial ecotoxicity kg 1.4-DB eq 3.95E−01 4.14E−01 1.76E−02 3.43E−02 Freshwater ecotoxicity kg 1.4-DB eq 9.96E+00 9.29E+00 8.05E+00 5.04E−01 Marine ecotoxicity kg 1.4-DB eq 1.72E + 01 1.38E+01 8.42E+00 7.07E−01 Ionising radiation kBq U235 eq 3.30E+04 1.46E+04 3.69E+01 5.42E+01 Agricultural land occupation m2a 9.17E+01 1.07E+02 3.14E+00 1.45E+00
Urban land occupation m2a 3.89E+01 3.62E+01 1.96E+00 8.40E+00
Natural land transformation m2 2.56E+00 9.48E−01 1.58E−02 2.42E−01
Water depletion m3 3.23E+02 4.23E+02 8.91E−01 1.66E+00
Metal depletion kg Fe eq 8.07E+02 5.74E+02 3.37E+02 1.65E+01 Fossil depletion kg oil eq 4.12E+03 1.62E+03 3.69E+01 1.92E+02
Table A3
Contribution of the four sub-processes to the total toxicological impact according to I2002+, ReCiPe (H) midpoints and USEtox.
Method Impact category Unit Production Cleaning Equipment Transport I2002+ Aquatic/freshwater ecotoxicity kg TEG water 2.10E+06 2.06E+06 1.66E+04 2.86E+04
USEtox CTUe 9.52E+03 7.73E+03 1.97E+03 8.00E+02
ReCiPe kg 1.4-DB-eq 9.96E+00 9.29E+00 8.05E+00 5.04E−01 I2002+ Terrestrial ecotoxicity kg TEG soil 3.50E+05 1.83E+05 1.42E+04 1.66E+04 ReCiPe kg 1.4-DB-eq 3.95E−01 4.14E−01 1.76E−02 3.43E−02 I2002+ Human toxicity kg C2H3Cl-eq 1.79E+02 1.08E+02 1.24E+01 6.54E+00
USEtox CTUh 9.88E−04 2.00E−03 1.29E−04 6.14E−05