Visual and motor evoked potentials in the course of multiple sclerosis
7
0
0
Texte intégral
(2) Evoked potentials during multiple sclerosis and colleagues (Poser et al., 1983). The inclusion criteria were a relapsing–remitting course (with at least two relapses and incomplete remission in the last 2 years; 25 patients) or a secondary progressive course (five patients), a score of minimally 2 and maximally 6.5 points on the Expanded Disability Status Scale (EDSS) (Kurtzke, 1983), an MRI scan of the brain during the last 12 months consistent with the diagnosis of multiple sclerosis (at least three lesions at least 2 mm in diameter, or two lesions, one of which had to be located in the periventricular area and the other had to have a diameter of at least 5 mm), at least one gadoliniumenhancing lesion on a brain MRI obtained during the 2 weeks before entry, and written informed consent. Patients with chronic steroid or immunosuppressive drug treatment during the last 6 months or patients who had received acute steroid treatment for a relapse during the last 4 weeks were excluded. Mean disease duration at study entry was 9.2 years (range 1.5–22 years). The duration of the study was 2 years. A complete neurological examination was performed and motor and visual evoked potentials (VEPs) were measured at entry (T0) and after 6 (T1), 12 (T2) and 24 (T3) months. The study was approved by the Ethics Committee of the University Hospital, Basel. The clinical examination was rated according to the EDSS scale. The median EDSS score was 4.65 (range 2–6.5) at study entry and 5.1 (range 2–9) at the end of the study (after 2 years). Eleven patients had no change in EDSS score between entry and the end of the study or a change in either direction of only 0.5 points, four had a decrease (improvement) and nine had an increase (deterioration) of at least one point; six patients had a relapse at one of the intermediate measuring points but recovered by the end the study, when their score was the same as at entry to the study or differed from their entry score by only 0.5 points.. Motor evoked potentials The motor evoked potentials (MEP) were recorded from the pre-innervated abductor digiti minimi and tibialis anterior muscles bilaterally with a Counterpoint EMG machine (Dantec, Skovlunde, Denmark). Low and high filters were set at 50 Hz and 2 kHz, respectively. Magnetic stimuli were delivered from a Magstim 200 device (The Magstim Company Ltd, Whitland, UK) via a round coil (inner diameter 9 cm). The cortex was stimulated using the maximal output of the stimulator (2.2 T), with the coil centred at the vertex for stimulation of the hand. For the leg area, the coil was placed with the stimulating surface over the vertex (the centre of the coil was 5 cm anteriorly), and from this point the coil was moved in steps of 1 cm in anteroposterior and lateral directions in search of the location producing the largest MEP in the tibialis anterior muscle. For both upper and lower extremities, four stimulations were done with clockwise and four with anticlockwise current flow. Spinal stimulation was done by placing the rim of the same coil over the seventh. 2163. cervical and fifth lumbar vertebra, with two stimulations for each current direction. When MEPs were identifiable, the shortest onset latency of MEPs was determined and used for calculating the central motor conduction time (CMCT), which was the only parameter of MEPs used for further analysis. The sum of the CMCT to both upper extremities and the sum of the CMCTs to both lower extremities were used to calculate the deviation from the (doubled) normal mean values and to create the regression model. The CMCT was assessed according to the normal values for the same stimulation method quoted in Sto¨ hr and colleagues (Sto¨ hr et al., 1996). When no MEP was identifiable, we took the longest CMCT found in our study for the upper or lower extremities, as the result was then considered to be at least as pathological as that with the longest CMCT (‘censored’ latencies). This procedure allowed us to include the data of the patients with the most pathological results.. Visual evoked potentials The VEPs were recorded from an active electrode placed 3 cm above Oz and a reference electrode at Fz with a Neuropack (Nihon-Kohden, Tokyo, Japan) or a MS-92 machine (Medelec, Old Woking, UK). Low and high filters were set at 0.5 and 100 Hz, respectively. Analysis time was 200 ms, and at least 256 single recordings were averaged twice. Pattern reversal stimulation was presented to each eye separately at a frequency of 0.5 Hz. The screen measured 18° and individual squares 42 minutes of arc. The luminance of the white and black chequers was 85 and 2 cd/m2, respectively. When VEPs were identifiable, the peak latency of P2 (P100) was determined. It was the only parameter of VEPs used for further analysis. The sum of the latencies of the component P2 after stimulation of the right and left eyes was used to calculate the deviation from the (doubled) normal mean values and to create the regression model. The latency of P2 was assessed according to normal values determined in our laboratory with the same equipment; values exceeding the mean normal value by ⬎2.5 SD were regarded as abnormal (normal latency of P2 is 艋109.5 ms). When no VEP was identifiable, the longest latency of P2 found in our study was taken, as the result was considered to be at least as pathological as that with the longest identifiable P2.. Statistical analysis Cross-sectional comparisons and prognostic value The association between visual acuity and the latency of P2 was assessed by simple regression analysis and the Spearman rank correlation coefficients between the EDSS and evoked potential data. Data for all evoked potentials were summarized in two ways: (i) as the number of pathological results outside the normal range (normal mean ⫹ 2.5 SD), counting VEP on each side and MEP at each limb separately; (ii) as.
(3) 2164. P. Fuhr et al.. the sum of Z scores of latencies calculated according to the formula: Σ Z ⫽ Z (sum of CMCTUE) ⫹ Z (sum of CMCTLE) ⫹ Z (sum of P2) where the Z score Zi,t associated with a given summed latency value xi,t of patient i at time t was computed according to the transformation formula Zi,t ⫽ (xi,t – sample mean of x at baseline)/standard deviation of x at baseline.. Longitudinal comparisons The relationship between the course of EDSS and changes in evoked potentials was described using a linear mixed model with a random subject effect that accounted for the correlation of residuals within subjects. For this purpose, individual changes in EDSS scores and in evoked potentials from their baseline values were computed for each measuring time-point according to the formulae ∆EDSS(Tx) ⫽ EDSS(Tx) – EDSS(T0) ∆CMCTUE(Tx) ⫽ CMCTUE(Tx) – CMCTUE(T0) ∆CMCTLE(Tx) ⫽ CMCTLE(Tx) – CMCTLE(T0) ∆P2(Tx) ⫽ P2(Tx) – P2(T0) where EDSS(Tx) is the EDSS score at time Tx, CMCTUE(Tx) is the sum of the CMCTs to the upper extremities at time Tx, CMCTLE(Tx) is the sum of the CMCTs to the lower extremities at time Tx and P2(Tx) is the sum of the latencies of the VEP component P2 after stimulation of the right and left eyes at time Tx. In a preliminary step, the changes in the EDSS scores were regressed against the concurrent changes in latencies using the model ∆EDSS(Tx) ⫽ α ⫹ β1 * ∆CMCTUE(Tx) ⫹ β2 * ∆CMCTLE(Tx) ⫹ β3 * ∆P2(Tx). Where α ⫽ intercept term; β ⫽ slope between ∆EDSS(Tx) and ∆CMCTUE; β2 ⫽ slope between ∆EDSS (Tx) and ∆CMCTLE(Tx); and β3 ⫽ slope between ∆EDSS(Tx) and ∆P2(Tx). This analysis included the complete set of data for all 30 subjects. The result suggested that the variable ∆CMCTLE(Tx) could be omitted from the model. In the next step, the simplified model ∆EDSS(Tx) ⫽ α ⫹ β1 *∆CMCTUE(Tx) ⫹ β3 * ∆P2(Tx) was fitted to the data of 15 randomly selected subjects. For the purpose of validation, the resulting regression equation was then applied to the evoked potential data for the other 15 patients and predicted values of ∆EDSS were calculated. Observed and predicted values of ∆EDSS were compared by means of the Spearman rank correlation coefficient ρS. The statistical significance of this association was estimated with a random permutation test (i.e. by generating 5000 random permutations of the individual triples [∆EDSS(T1), ∆EDSS(T2), ∆EDSS(T3)] across subjects and determining the percentage of simulated values of ρS exceeding the observed value in absolute size). This was to account for the fact that. repeated observations from the same subject are likely to be correlated (Fisher and van Belle, 1993). The number of observations included in our analyses varied because some patients had incomplete series of measurements. Statistical analyses were done with the programs StatView 4.5 and SAS 6.12 (both SAS Institute Inc., Cary, NC, USA).. Results Cross-sectional correlations between evoked potentials and clinical data The sum of the P2 latencies correlated at all times with the sum of the visual acuities of the two eyes, and the sum of the CMCTs to all four extremities with the EDSS score (Table 1). In our group of patients, the latter correlation was based primarily on the CMCTs to the upper extremities. The number of pathological results in the combined testing of MEP and VEP correlated with the EDSS score at all measuring points. When the sum of the Z scores of the latencies of MEP and VEP were compared with the concurrent EDSS score, the correlation was even closer (Table 1 and Fig. 1).. Longitudinal correlations between evoked potentials and clinical data The regression estimates for the data of 15 randomized patients (group A) were as follows: α ⫽ 0.1049; β1 ⫽ 0.0231 (P ⫽ 0.052); β3 ⫽ 0.0073 (P ⫽ 0.133). We used these coefficients to compute predicted values of ∆EDSS(Tx) among the remaining patients (group B). Observed and predicted EDSS scores within this group were compared by means of the Spearman rank correlation coefficient, giving the following results: n ⫽ 38, ρ ⫽ 0.431 (P ⫽ 0.043, estimated using a random permutation test). This correlation coefficient was only slightly smaller than that obtained within group A (i.e. ρ ⫽ 0.442).. Prognostic value of evoked potentials data The number of pathological results in the combined testing of MEP and VEP as well as their Z-transformed latencies at baseline correlated with the alteration in the EDSS score over the time-span of the study. Moreover, the change in evoked potential data during the first year is a predictor of the change in the clinical score during the second year. Contrarily, no correlation was detected between the EDSS score at study entry and change in the EDSS score over the time-span of the study (Table 1 and Fig. 2).. Discussion The development of new treatments for multiple sclerosis requires a reliable and objective measurement of the course of the disease with emphasis on the early stages, as the goal.
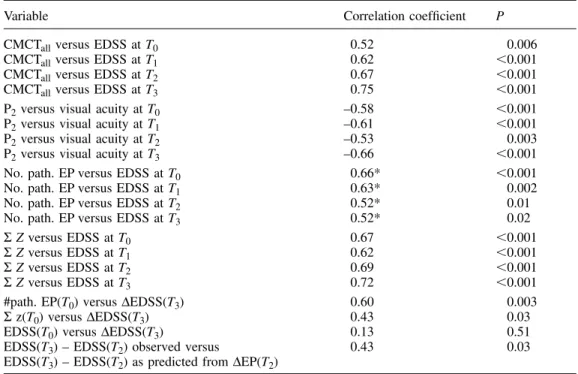
(4) Evoked potentials during multiple sclerosis. 2165. Table 1 Correlations between evoked potentials, clinical data and clinical outcome Variable. Correlation coefficient. P. CMCTall versus EDSS at T0 CMCTall versus EDSS at T1 CMCTall versus EDSS at T2 CMCTall versus EDSS at T3 P2 versus visual acuity at T0 P2 versus visual acuity at T1 P2 versus visual acuity at T2 P2 versus visual acuity at T3 No. path. EP versus EDSS at T0 No. path. EP versus EDSS at T1 No. path. EP versus EDSS at T2 No. path. EP versus EDSS at T3 Σ Z versus EDSS at T0 Σ Z versus EDSS at T1 Σ Z versus EDSS at T2 Σ Z versus EDSS at T3 #path. EP(T0) versus ∆EDSS(T3) Σ z(T0) versus ∆EDSS(T3) EDSS(T0) versus ∆EDSS(T3) EDSS(T3) – EDSS(T2) observed versus EDSS(T3) – EDSS(T2) as predicted from ∆EP(T2). 0.52 0.62 0.67 0.75 –0.58 –0.61 –0.53 –0.66 0.66* 0.63* 0.52* 0.52* 0.67 0.62 0.69 0.72 0.60 0.43 0.13 0.43. 0.006 ⬍0.001 ⬍0.001 ⬍0.001 ⬍0.001 ⬍0.001 0.003 ⬍0.001 ⬍0.001 0.002 0.01 0.02 ⬍0.001 ⬍0.001 ⬍0.001 ⬍0.001 0.003 0.03 0.51 0.03. *Corrected for ties. CMCTall ⫽ sum of CMCT to all four extremities; ∆EDSS(T3) ⫽ change in EDSS over time-span of study; P2 ⫽ sum of latencies of component P2 after stimulation of each eye; No. path. EP ⫽ number of pathological results of evoked potential measurement; Σ Z ⫽ sum of Z scores of CMCTs to upper and lower extremities and of P2; EDSS(T3) – EDSS(T2) was predicted from ∆EP(T2) according to the regression model EDSS(T3) – EDSS(T2) ⫽ α ⫹ β1 ⫻ ∆CMCTUE(T2) ⫹ β2 ⫻ ∆CMCTLE(T2) ⫹ β3 ⫻ ∆P2(T2).. is to stop further progression of the disease after the diagnosis has been made. Moreover, reliable prediction of rapid progression is necessary in order to identify patients at high risk, whether for the recruitment of suitable patients in clinical trials in order to achieve fast progress in therapeutic research or for the tailoring of therapy to individuals. Conventional MRI (T2-weighted and gadolinium-enhanced T1-weighted images) is currently the single most sensitive test for multiple sclerosis (Filippini et al., 1994; Beer et al., 1995; Comi et al., 1998; Miller et al., 1998) and it also allows the exclusion of a number of possible differential diagnoses. While evoked potentials can test the function of only a very limited number of central tracts, MRI examines the whole cerebrum at once (Comi et al., 1998). However, as white matter lesions identified by conventional MRI are not identical with zones of malfunction, their number and extent correlate only weakly with the clinical status (IFNB Multiple Sclerosis Study Group, 1995; O’Connor et al., 1998; Simon et al., 1998). A more robust correlation was established between the extent of T1 lesions (‘black holes’) and the EDSS score, but only in patients with a secondary progressive course (Truyen et al., 1996). In longitudinal comparisons, correlations between clinical outcome and conventional MRI were insignificant (O’Connor et al., 1998; Simon et al., 1998), weak (IFNB Multiple Sclerosis Study Group, 1995; O’Riordan, 1998) or limited to patients with secondary. progressive multiple sclerosis (Truyen et al., 1996). While abnormalities in T2-weighted MRI in patients with isolated syndromes reliably predict the risk of developing clinically definite multiple sclerosis, its course and the EDSS score after 10 years (Miller et al., 1998; O’Riordan, 1998), the correlations between T2-lesion load and disability become modest at best once the diagnosis of multiple sclerosis has been established (Losseff et al., 1996; Miller et al., 1998; O’Connor et al., 1998). Moreover, a meta-analysis including a total of 307 patients showed that the number of gadoliniumenhancing lesions at baseline and even the mean number of gadolinium-enhancing lesions in monthly repeated brain scans during the first 6 months correlate only weakly with the number of relapses and not at all with the change in EDSS score in the subsequent 12 or 24 months (Kappos et al., 1999). Measurements of evoked potentials are also sensitive tests for multiple sclerosis, as they can detect subclinical malfunction of the tested systems (Chiappa and Ropper, 1982; Hess et al., 1986, 1987). Their diagnostic sensitivity increases considerably when different methods are used in combination and approaches 100% for patients with definite multiple sclerosis (Khoshbin and Hallett, 1981). In a series of 90 patients with definite or possible multiple sclerosis tested in our laboratory, VEPs were the most sensitive modality when compared with somatosensory evoked potentials from the upper and lower extremities, brainstem.
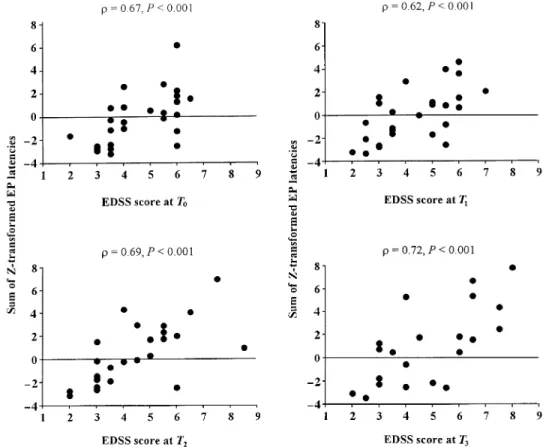
(5) 2166. P. Fuhr et al.. Fig. 1 Correlations of combined VEP and MEP results with EDSS scores at all measurement points. To combine the different latencies on a single scale, the sum of their Z scores was computed. Statistical assessment of the associations was based on the Spearman rank correlation coefficient. EP ⫽ evoked potential.. Fig. 2 Correlation of combined VEP and MEP results at baseline with the change in clinical scores over 2 years. Data on evoked potentials are represented by the number of pathological results (left) and by the sum of Z scores of their latencies (right). Statistical assessment of the associations was based on the Spearman rank correlation coefficient. EP ⫽ evoked potential.. auditory evoked potentials and the cutaneous long-latency reflex (Friedli and Fuhr, 1990), whereas in other series somatosensory evoked potentials and MEPs were more sensitive than VEPs, and MEPs were more sensitive than somatosensory evoked potentials (Beer et al., 1995). Consequently, a combination of MEPs and VEPs constitutes a sensitive test battery in multiple sclerosis patients.. Evoked potentials are useful in the detection of subclinical lesions, but it is clear that they can deteriorate before the clinical examination does, and it was long considered doubtful whether they can also recover (Matthews and Small, 1979; Walsh et al., 1982; Lowitzsch and Welkoborski, 1983). However, significant improvement of VEPs after an episode of optic neuritis (Brusa et al., 2001) as well as improvement.
(6) Evoked potentials during multiple sclerosis of MEPs in patients with multiple sclerosis under treatment has been documented (Waxman, 1988; Kandler et al., 1991; Salle et al., 1992). If a shortening of the latency by at least 10 ms of component P2 of the VEP (Becker and Richards, 1984) and a decrease of the CMCT by at least 10% (Salle et al., 1992) are regarded as significant, our data show improvement in 17 of 60 eyes, in 37 of 60 upper extremities and in 24 of 54 lower extremities tested. This demonstrates that the improvement of pathological evoked potentials is possible. Therefore, they fulfil the requirement of variability in both directions in order to serve as parameters of the course of multiple sclerosis. Since this is also true of subclinical lesions, evoked potentials are suitable for monitoring the early stages of the disease. Given the normal test–retest variability of the different parameters of evoked potentials, however, it is important to restrict the analysis to ‘solid’ components, such as the latencies of clearly defined components (Comi et al., 1999). Evoked potentials yielded disappointing correlations with individual courses (Aminoff et al., 1984; Anderson et al., 1987). Comparisons of group data also produced negative results in some earlier studies. Methodological factors, such as the lack of standardization of laboratory procedures and the transformation of continuous electrophysiological data to coarse ordinal scores and consequently a loss of statistical power, have been implicated (Emerson, 1998). Cross-sectional analysis of our data shows that VEP results correlate with visual acuity and MEP results and the combined VEP and MEP results correlate with the EDSS score at all points in time. The correlations are closer than those reported between MRI findings and EDSS score and corroborate earlier studies by others (Nuwer et al., 1987; Rossini et al., 1989; Kandler et al., 1991; Salle et al., 1992; Brigell et al., 1994; Andersson et al., 1995; Facchetti et al., 1997; Davies et al., 1998; O’Connor et al., 1998). The most parsimonious explanation for this is that, unlike MRI abnormalities, each pathological evoked potential measurement represents at least one zone of malfunction, even if it is subclinical and of microscopical dimensions. Longitudinal analysis of the data shows that the change in combined MEP and VEP data correlates with the change in EDSS score over 2 years. The correlations are closer than those reported between the change of conventional MRI findings and EDSS score, if they reach significance at all (IFNB Multiple Sclerosis Study Group, 1995; O’Connor et al., 1998; O’Riordan 1998; Simon et al., 1998). The predictive value of evoked potentials is documented by the correlation between the result of combined testing of MEP and VEP at baseline with the change of the EDSS score over the next 2 years. No correlation exists between the EDSS score at baseline and its change over 2 years. These results are in agreement with those of O’Connor and colleagues using visual, brainstem auditory and somatosensory evoked potentials (O’Connor et al., 1998). The difference in predictive value between the EDSS score and evoked potential data may be explained by the power of evoked potentials to detect subclinical lesions that may become manifest later.. 2167. Nevertheless, reliable prediction of the individual course from VEP and MEP data is not possible. While in our small cohort no patient with two or fewer abnormalities in evoked potentials deteriorated clinically, some patients with four to six abnormal tests remained on the baseline EDSS score or improved. However, for individual patients meeting the clinical criteria used in this study we can infer that the probability of an unfavourable clinical course over 2 years increases with the number of VEP and MEP abnormalities found at baseline. Several explanations are possible for differences between multimodality evoked potentials and conventional MRI assessments in their validity for monitoring and predicting the course of patients with relapsing–remitting and secondary progressive multiple sclerosis. An early ceiling effect preventing the assessment of the course of patient groups by MRI may play a role. An alternative explanation with interesting implications for the biology of multiple sclerosis is the apparent dissociation between inflammatory and destructive activity of the disease. Opening of the blood–brain barrier (as visualized by gadolinium-enhanced T1-weighted MRI) and accumulation of water in the surrounding brain (as visualized by T2-weighted MRI) are early and possibly reversible steps in the pathogenesis of multiple sclerosis, whereas evoked potentials test for the final result in the cascade of pathomechanisms.. Conclusion Repeated testing of VEPs and MEPs in patients with multiple sclerosis yields objective numerical data. This helps to identify patients at higher risk of rapid progression, represents the burden of dysfunctional lesions and documents the course of the disease even in patients at an early stage, for whom future therapeutic studies are needed most. The combination of VEP and MEP data is powerful enough to yield significant results in a small study population, but it is likely that its sensitivity can be enhanced by including somatosensory evoked potentials.. Acknowledgements We thank Professor Mark Hallett for helpful comments and Ms Isabel Deiss and Ms Sylvia Fluri for technical assistance. L.K. is supported by the Swiss Multiple Sclerosis Society. Results of this study were presented in part at the meeting of the American Association of Electrodiagnostic Medicine 1998, Orlando, Florida. References Aminoff MJ, Davis SL, Panitch HS. Serial evoked potential studies in patients with definite multiple sclerosis. Clinical relevance. Arch Neurol 1984; 41: 1197–202. Anderson DC, Slater GE, Sherman R, Ettinger MG, et al. Evoked potentials to test a treatment of chronic multiple sclerosis. Arch Neurol 1987; 44: 1232–6. Andersson T, Siden A, Persson A. A comparison of motor evoked potentials and somatosensory evoked potentials in patients with.
(7) 2168. P. Fuhr et al.. multiple sclerosis and potentially related conditions. Electromyogr Clin Neurophysiol 1995; 35: 17–24. Becker WJ, Richards IM. Serial pattern shift visual evoked potentials in multiple sclerosis. Can J Neurol Sci 1984; 11: 53–9. Beer S, Ro¨ sler KM, Hess CW. Diagnostic value of paraclinical tests in multiple sclerosis: relative sensitivities and specificities for reclassification according to the Poser Committee criteria. J Neurol Neursurg Psychiatry 1995; 59: 152–9. Brigell M, Kaufman DI, Bobak P, Beydoun A. The pattern visual evoked potential. A multicenter study using standardized techniques. Doc Ophthalmol 1994; 86: 65–79. Brusa A, Jones SJ, Plant GT. Long-term remyelination after optic neuritis. A 2-year visual evoked potential and psychophysical serial study. Brain 2001; 124: 468–79. Chiappa KH, Ropper AH. Evoked potentials in clinical medicine (second of two parts.). [Review]. N Engl J Med 1982: 306: 1205–11. Comi G, Filippi M, Rovaris M, Leocani L, Medaglini S, Locatelli T. Clinical, neurophysiological, and magnetic resonance imaging correlations in multiple sclerosis. [Review]. J Neurol Neurosurg Psychiatry 1998; 64 Suppl 1: S21–5. Comi G, Leocani L, Medaglini S, Locatelli T, Martinelli V, Santuccio G, et al. Measuring evoked responses in multiple sclerosis. [Review]. Mult Scler 1999; 5: 263–7. Davies MB, Williams R, Haq N, Pelosi L, Hawkins CP. MRI of optic nerve and postchiasmal visual pathways and visual evoked potentials in secondary progressive multiple sclerosis. Neuroradiology 1998; 40: 765–70. Emerson RG. Evoked potentials in clinical trials for multiple sclerosis. [Review]. J Clin Neurophysiol 1998; 15: 109–16. Facchetti D, Mai R, Micheli A, Marciano N, Capra R, Gasparotti R, et al. Motor evoked potentials and disability in secondary progressive multiple sclerosis. Can J Neurol Sci 1997; 24: 332–7. Filippini G, Comi GC, Cosi V, Bevilacqua L, Ferrarini M, Martinelli V, et al. Sensitivities and predictive values of paraclinical tests for diagnosing multiple sclerosis. J Neurol 1994; 241: 132–7. Fisher L, van Belle G. Biostatistics: a methodology for the health sciences. New York: Wiley; 1993. Friedli WG, Fuhr P. Electrocutaneous reflexes and multimodality evoked potentials in multiple sclerosis. J Neurol Neurosurg Psychiatry 1990; 53: 391–7. Hess CW, Mills KR, Murray NM. Measurement of central motor conduction in multiple sclerosis by magnetic brain stimulation. Lancet 1986; 2: 355–8. Hess CW, Mills KR, Murray NM, Schriefer TN. Magnetic brain stimulation: central motor conduction studies in multiple sclerosis. Ann Neurol 1987; 22: 744–52. IFNB Multiple Sclerosis Study Group. Interferon beta-1b in the treatment of multiple sclerosis: final outcome of the randomized controlled trial. Neurology 1995; 45: 1277–85. Kandler RH, Jarratt JA, Davies-Jones G, Gumpert EJ, Venables GS, Sagar HJ, et al. The role of magnetic stimulation as a quantifier of motor disability in patients with multiple sclerosis. J Neurol Sci 1991; 106: 31–4. Kappos L, Moeri D, Radue EW, Schoetzau A, Schweikert K, Barkhof F, et al. Predictive value of gadolinium-enhanced magnetic resonance imaging for relapse rate and changes in disability or. impairment in multiple sclerosis: a meta-analysis. Lancet 1999; 353: 964–9. Khoshbin S, Hallett M. Multimodality evoked potentials and blink reflex in multiple sclerosis. Neurology 1981; 31: 138–44. Kurtzke JF. Rating neurologic impairment in multiple sclerosis: an expanded disability status scale (EDSS). Neurology 1983; 33: 1444–52. Losseff NA, Kingsley DP, McDonald WI, Miller DH, Thompson AJ. Clinical and magnetic resonance imaging predictors of disability in primary and secondary progressive multiple sclerosis. Mult Scler 1996; 1: 218–22. Lowitzsch K, Welkoborski HJ. ‘Normalisierung’ des VEP bei multipler Sklerose? Verlaufsbeobachtung bei 50 von 500 MSPatienten. EEG EMG Z Elektroenzephalogr Elektromyogr Verwandte Geb 1983; 14: 93–5. Matthews WB, Small DG. Serial recording of visual and somatosensory evoked potentials in multiple sclerosis. J Neurol Sci 1979; 40: 11–21. Miller DH, Grossman RI, Reingold SC, McFarland HF. The role of magnetic resonance techniques in understanding and managing multiple sclerosis. [Review]. Brain 1998; 121: 3–24. Nuwer MR, Packwood JW, Myers LW, Ellison GW. Evoked potentials predict the clinical changes in a multiple sclerosis drug study. Neurology 1987; 37: 1754–61. O’Connor P, Marchetti P, Lee L, Perera M. Evoked potential abnormality scores are a useful measure of disease burden in relapsing–remitting multiple sclerosis. Ann Neurol 1998; 44: 404–7. O’Riordan JI, Thompson AJ, Kingsley DP, MacManus DG, Kendall BE, Rudge P, et al. The prognostic value of brain MRI in clinically isolated syndromes of the CNS. A 10-year follow-up. Brain 1998; 121: 495–503. Poser CM, Paty DW, Scheinberg L, McDonald WI, Davis FA, Ebers GC, et al. New diagnostic criteria for multiple sclerosis: guidelines for research protocols. Ann Neurol 1983; 13: 227–31. Rossini PM, Zarola F, Floris R, Bernardi G, Perretti A, Pelosi L, et al. Sensory (VEP, BAEP, SEP) and motor-evoked potentials, liquoral and magnetic resonance findings in multiple sclerosis. Eur Neurol 1989; 29: 41–7. Salle JY, Hugon J, Tabaraud F, Boulestieux JM, Vallat JM, Dumas M, et al. Improvement in motor evoked potentials and clinical course post-steroid therapy in multiple sclerosis. J Neurol Sci 1992; 108: 184–8. Simon JH, Jacobs LD, Campion M, Wende K, Simonian N, Cookfair DL, et al. Magnetic resonance studies of intramuscular interferon β1a for relapsing multiple sclerosis. Ann Neurol 1998; 43: 79–87. Sto¨ hr M, Dichgans J, Buettner UW, Hess CW, Altenmu¨ ller E. Evozierte Potentiale. 3rd ed. Berlin: Springer; 1996. Truyen L, van Waesberghe JH, van Walderveen MA, Van Oosten BW, Polman CH, Hommes OR, et al. Accumulation of hypointense lesions (‘black holes’) on T1 spin-echo MRI correlates with disease progression in multiple sclerosis. Neurology 1996; 47: 1469–76. Walsh JC, Garrick R, Cameron J, McLeod JG. Evoked potential changes in clinically definite multiple sclerosis: a two year follow up study. J Neurol Neurosurg Psychiatry 1982; 45: 494–500. Waxman SG. Clinical course and electrophysiology of multiple sclerosis. [Review]. Adv Neurol 1988; 47: 157–84. Received July 10, 2000. Revised April 2, 2001. Second revision June 14, 2001. Accepted June 25, 2001.
(8)
Figure
Documents relatifs
