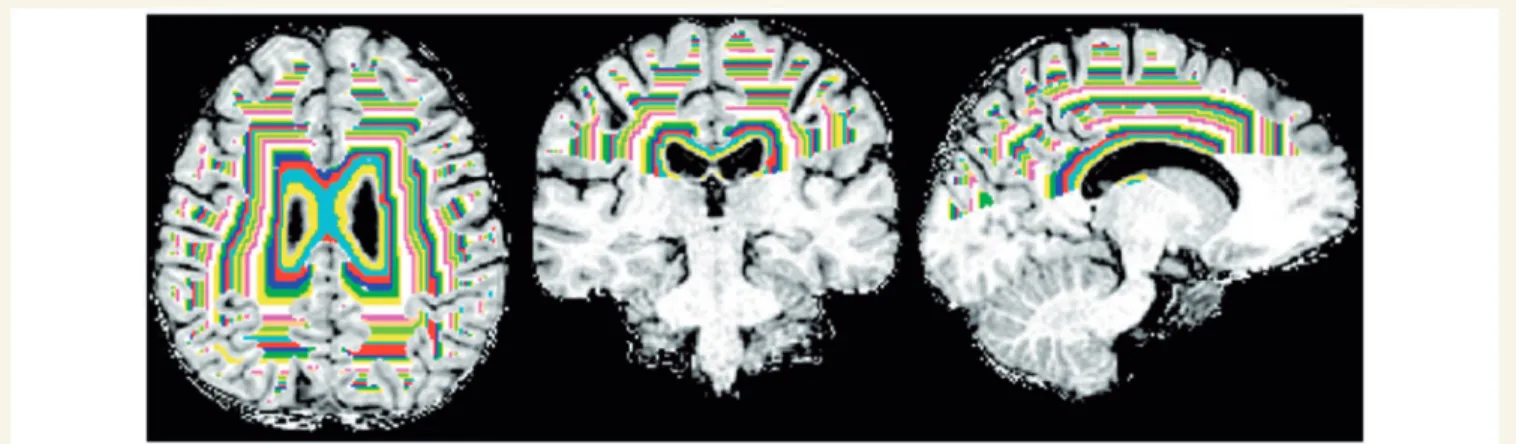
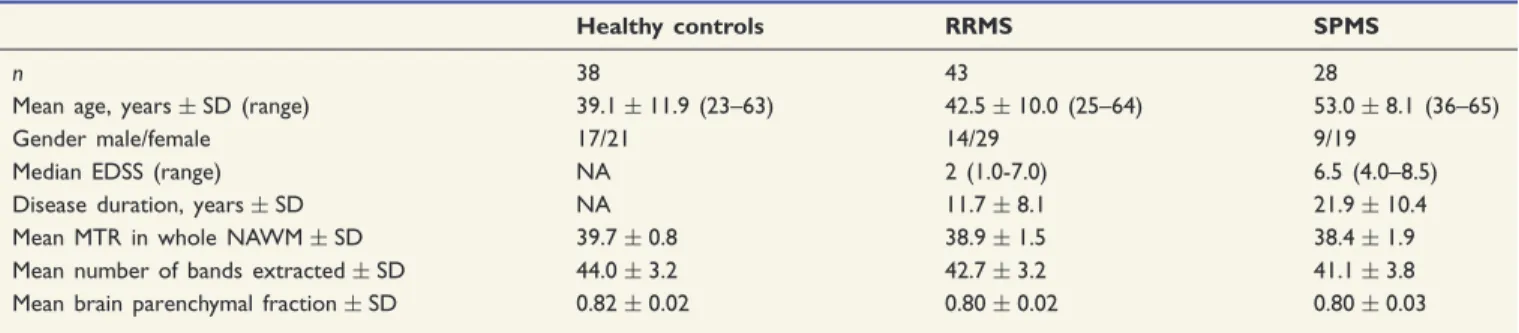
Magnetization transfer ratio measures in normal-appearing white matter show periventricular gradient abnormalities in multiple sclerosis
8
0
0
Texte intégral
Figure
Documents relatifs