Abbreviations: EMCL, extramyocellular lipids; IMCL, intramyocellular lipids; MR, magnetic resonance; MRI, magnetic resonance imaging; MRS, magnetic
resonance spectroscopy.
*Corresponding author: Professor Chris Boesch, fax +41 31 382 24 86, email [email protected]
CAB International
The 6th International Tutorial Conference of the Research Group on the Biochemistry of Exercise, a collaboration between the Nutrition Toxicology and Environmental Research Institute Maastricht and the Nutrition Society was held in Maastricht, The Netherlands
on 18–21 February 1999
Symposium on ‘Metabolic aspects of human nutrition at rest and during physical
stress: recent methodological and technical developments’
Session 1: Magnetic resonance imaging and magnetic resonance spectroscopy to
investigate fuel and energy metabolism and tissue composition
Observation of intramyocellular lipids by means of
1
H magnetic resonance
spectroscopy
Chris Boesch
1, Jacques Décombaz
2, Johannes Slotboom
1and Roland Kreis
1Professor Chris Boesch,1
Department of Clinical Research, MR Spectroscopy and Methodology, University of Bern, CH-3010 Bern, Switzerland
2Nestec Ltd, Nestlé Research Centre, Lausanne, Switzerland
fax +41 31 382 24 86, email [email protected]
Magnetic resonance imaging (MRI) and magnetic resonance spectroscopy (MRS) are being increasingly used for investigations of human muscle physiology. While MRI reveals the morphology of muscles in great detail (e.g. for the determination of muscle volumes), MRS provides information on the chemical composition of the tissue. Depending on the observed nucleus, MRS allows the monitoring of high-energy phosphates (31P MRS), glycogen (13C MRS),
or intramyocellular lipids (1H MRS), to give only a few examples. The observation of
intramyocellular lipids (IMCL) by means of 1H MRS is non-invasive and, therefore, can be
repeated many times and with a high temporal resolution. MRS has the potential to replace the biopsy for the monitoring of IMCL levels; however, the biopsy still has the advantage that other methods such as those used in molecular biology can be applied to the sample. The present study describes variations in the IMCL levels (expressed in mmol/kg wet weight and ml/100 ml) in three different muscles before and after (0, 1, 2, and 5 d) marathon runs for a well-trained individual who followed two different recovery protocols varying mainly in the diet. It was shown that the repletion of IMCL levels is strongly dependent on the diet post exercise. The monitoring of IMCL levels by means of 1H MRS is extremely promising, but several methodological limitations and
pitfalls need to be considered, and these are addressed in the present review.
Magnetic resonance imaging: Magnetic resonance spectroscopy: Intramyocellular lipids: Exercise: Post-exercise diet
NMR has a long and successful history (Becker et al. 1996) in physics, chemistry and biology, where solutions and solids have been studied with increasing sensitivity and resolution since the 1950s. When large-bore magnets were developed in the 1970s whole-body examinations became feasible, first in smaller animals and subsequently in human subjects. Magnetic resonance (MR) imaging (MRI) became a major diagnostic modality in radiology, unsurpassed in many aspects such as soft tissue contrast
and versatility of different acquisition sequences. MR spectroscopy (MRS), on the other hand, benefits from the success of high-resolution NMR in solution, but its use
in vivo requires critical technical specifications of the
MR systems, which has to some extent delayed the widespread application of MRS. Recent technical develop-ments in MR systems, which have been hastened by other MR applications (e.g. functional imaging and flow measurements), have also promoted the application of
MRS in whole-body systems. Since MRS is located at the intersection of two extremely successful methods (high-resolution NMR in solution and MRI), continuous growth and development of MRS can be expected in the next decade, despite serious technical challenges. The present article aims to describe one MRS technique that may serve as an example for many other emerging applications.
The separation of in vivo MR into MRI and MRS is justified for practical reasons, but it should not be forgotten that they are based on the same physical effect. Technical limitations, such as the strength and homogeneity of the magnetic field, the frequency bandwidth of electronic components, or even software, can restrict the use of MR systems to MRI only. However, if the equipment is tech-nically appropriate, MRI and MRS data acquisition is interchangeable, and MR images and spectra can be obtained in the same examination. The acquisition of MR ‘localizer’ images before MRS examination, in order to evaluate the anatomy, is straightforward and mandatory for an appropriate determination of intramyocellular lipids (IMCL) levels. Activation of specific muscle groups can be visualized by MR images using specific acquisition indices (Fleckenstein et al. 1988, 1989). This procedure can be used to evaluate the involvement of muscles during exercise in ergometers in the MR magnet. MRI can also be used for the determination of body composition and muscle volumes (Fukunaga et al. 1992; LeBlanc et al. 1992; McColl et al. 1992; Narici et al. 1992; Roberts et al. 1993; Elliott et al. 1997; Fusch et al. 1998; Kamber et al. 1999). The application of MRI to the study of the physiology of skeletal muscle has been the subject of many review articles (Bassett & Gold, 1989; Fleckenstein et al. 1991; Brown & Bradley, 1994; Herzog, 1994; Sonin, 1994; Terk & Kwong, 1994; Basser, 1995; Conley et al. 1995; Heymsfield et al. 1995; McCully & Posner, 1995; Cooper & Barstow, 1996; Kneeland, 1997; Tung & Brody, 1997; Walker & Moore, 1997; Boesch & Kreis, 1999).
MRS has been used since its initial development to investigate the physiology of skeletal muscle (Boesch & Kreis, 1999). The monitoring of high-energy phosphates (phosphocreatine and ATP) in muscles of the limbs was one of the first successful in vivo applications of 31P MRS using small-bore magnets. Muscle glycogen can be monitored using natural abundance 13C MRS in vivo, and has become another metabolite that has attracted the interest of muscle physiologists towards MRS. Metabolic pathways can be followed using 13C-labelled metabolites (13C is a nucleus which has a natural abundance of only 1·1 %, while the abundant 12C nucleus is MR invisible). The large chemical shift dispersion of 13C MRS successfully separates individual nuclei in fatty acid side chains, e.g. signals from mono- and polyunsaturated fatty acids are distinguishable in a 13C MR spectrum. However, the spatial resolution of 13C MR spectra is relatively poor, and spectra acquired by common techniques are dominated by the large signals from subcutaneous fat. Specific techniques have been suggested to measure, for example, the degree of fatty acid saturation in calf muscle (Wary et al. 1996).
In the late 1980s, the availability of whole-body MR systems offered the opportunity to investigate other organs
in addition to human limbs, and the interest of a large proportion of the MR community shifted towards studies of the brain, liver and heart. 1H MRS became the most common method used in studies of human subjects, while 13C, 31P, 19F, 23Na and other nuclei were mostly of interest to dedicated spectroscopy groups. Recent developments show an increased interest in these nuclei within integrated studies that also include MRI examinations.
1H nuclei in water or adipose tissue are far more concen-trated than in any other metabolite of human tissue. Thus, the strong signal from water has to be suppressed by special techniques while 1H MR spectra are acquired. However, if no precautions are taken these water-suppressed 1H MR spectra of human muscle would still be dominated by a large contribution from lipid resonances. It was presumed that only a few metabolites would be visible beneath the resonances of subcutaneous fat (Williams et al. 1985; Narayana et al. 1988; Barany & Venkatasubramanian, 1989; Bruhn et al. 1991; Pan et al. 1991). Schick et al. (1993) observed two compartments of triacylglycerols with a resonance frequency shift of 0·2 parts per 106 (ppm) when they compared the lipid resonances in calf muscle with those in fat tissue. The authors assigned the resonance at 1·5 ppm to the CH2-protons of lipids in fat cells, and speculated that the shifted resonance at 1·28 ppm could be attributed to lipids located inside muscle cells (on this scale, water resonates at 4·7 ppm).
By carefully respecting anatomical borders and avoiding the inclusion of macroscopic fat layers in the region of interest, we were able to obtain 1H MR spectra of human muscle that were not obscured by the lipid signals (Fig. 1). We observed several features in the 1H MR spectra of skeletal muscle that changed with the angle between the fibre orientation and the magnetic field (Kreis & Boesch, 1994, 1996; Boesch & Kreis, 1997; Kreis et al. 1997; Ntziachristos et al. 1997). These changes included the CH2 resonances of the lipids, which showed a distinct response to variations in the acquisition variables (Boesch et al. 1997): (1) the resonance at 1·28 ppm, which was later attributed to IMCL in spherical droplets, is independent of the angle between the leg and the static magnetic field; (2) the other CH2 resonance shifted with the angle between the leg and the field, and could therefore be attributed to extra-myocellular lipids (EMCL) in using fasciae and subcutaneous fat layers; (3) IMCL resonances were proportional to the muscle tissue volume; (4) EMCL increased non-linearly as soon as voxel borders touched macroscopic fat layers. This difference in the behaviour of EMCL and IMCL is very important in the interpretation of the observed signals. The signal attributed to IMCL originates from nuclei which are homogeneously distributed, not on a microscopic scale but on a millimetre scale comparable with the dimensions of a voxel. As a result of the homogeneous spatial distribution of the metabolite, the intensity of the IMCL signal, like the signal from creatine, does not change with small displacements of the voxel. EMCL, however, is concentrated in local structures such as fasciae, and the signal intensity in the spectrum is strongly dependent on the exact location of the voxel. A displacement of the voxel by a few millimetres can change the amplitude of the EMCL signals by an order of
magnitude. The amplitude of the EMCL signal is, therefore, not a representative indicator of the EMCL content in a muscle, but rather a verification of a reproducible voxel placement in subsequent experiments. In other words, a carefully placed voxel in an obese person could, in principle, still contain less EMCL signal than a voxel touching subcutaneous fat in a very lean athlete.
From a theoretical point of view, it is important to distinguish between orientational effects due to dipolar coupling (as for creatine and/or phosphocreatine; Kreis & Boesch, 1994; Kreis et al. 1997) and those effects based on anisotropic susceptibility (as observed for IMCL and EMCL). For practical purposes, susceptibility effects should be known at least phenomenologically, since they explain the increased separation of IMCL and EMCL in some muscle groups (e.g. m. tibialis anterior) compared with other groups (e.g. m. vastus intermedius and m. vastus medialis). A comparison of three different methods for the deter-mination of IMCL levels (1H MRS, morphometry and chemical analysis; Boesch et al. 1998) showed that MRS seems to provide the best estimate of IMCL concentration (determined as the average of all three methods).
IMCL are stored in the form of liquid droplets in the cyto-plasm in close contact with mitochondria (Vock et al. 1996) of muscle cells, while free or protein-bound lipids are of lower concentration in cytoplasm. IMCL droplets have been suggested to provide an important share of the energy supply during long-term endurance activities (Havel et al. 1964; Oberholzer et al. 1976), and it is generally accepted that lipids from all sources can provide up to 70–90 % of the substrate requirements in long-term exercise (Oberholzer
et al. 1976; Romijn et al. 1993). There is evidence that
glycogen + glucose and lipids complement each other in a reciprocal way (Brooks & Mercier, 1994), and it is now very promising that in vivo MRS offers the opportunity to monitor IMCL by 1H MRS and glycogen by 13C MRS (Avison et al. 1988; Gruetter et al. 1991; Price et al. 1994). This technique allows the non-invasive monitoring of the complete pattern of intracellular substrate storage and can be used for human muscle in pathology or during sports activities.
In the present review an example of IMCL repletion following two marathon runs with two different recovery protocols varying mainly in the applied diet will be described. This example shows clearly that (1) muscle IMCL levels show a very high adaptability in response to exercise and diet; (2) levels of IMCL at rest and during repletion depend to a great extent on the type of muscle investigated; (3) the technical and physiological challenges are different for m. vastus and m. tibialis.
Material and methods
Volunteer and protocol
The volunteer in this study was a well-trained 53-year-old male runner weighing 59·5 kg, with a maximum O2 uptake between 51·5 (bicycle ergometer and calorimetry) and 58 ml/min per kg (indirectly, 12 min test run). The first run
was a competitive 42·2 km marathon with a duration of 3 h, 3 min and 11 s at an average heart rate of 150 beats/min. The second marathon, 11 d later, was non-competitive, on a different course but with monitoring of the heart rate, and a run duration of 3 h, 8 min and 42 s at an average heart rate of 145 beats/min. Carbohydrate-containing drinks were consumed during exercise for optimal performance. The diet (176 kJ/kg per d) for the first 2 d following run 1 provided 6 % energy as fat (low-fat diet). The isoenergetic diet following run 2 provided 63 % energy as fat (high-fat diet). Of this fat 90 g/100 g total fat was in the form of a single edible oil, in which the main constituent fatty acids were (g/100 g) oleic acid 59, linoleic 26 and stearic acid 3. The subject exercised at his regular daily intensity by running for 45 min/d at a sustained pace (140 beats/min) during the 2 d recovery period on the low-fat diet, but rested during the 2 d period on the high-fat diet. This difference in the protocol was deliberate, as the objective of this pilot study was to test conditions that should maximize the range of IMCL levels. IMCL measurements took place 1 or 2 d before the marathons (pre-exercise value), 2 h after the finish (post-exercise value) and on days 1, 2 and 5 after the marathons. The data presented in the present paper were obtained during the pilot phase of a larger study approved by the Ethics Committee of the Nestlé Research Centre.
Magnetic resonance
MRI and MRS examinations were performed using a SIGNA 1·5 T MR system (General Electric, Milwaukee, WI, USA). A standard coil for extremities (linear polarized volume coil, diameter 170 mm, length 290 mm) was used for the examination of m. tibialis anterior, while
m. vastus intermedius and medialis were examined using
a flexible double-tuned coil (13C square surface coil of 113 mm×113 mm, 1H Helmholtz-type coil; Medical Advance, Milwaukee, WI, USA). The double-tuned coil was used so that glycogen and IMCL levels could be determined sequentially at a later stage of the study. Sequence indices for the localizer images were chosen for optimal separation of the muscles and fasciae (gradient-echo-sequence, 30° flip angle, repetition time 100 ms, echo time 6·8 ms). An optimized ‘point resolved spectroscopy’ sequence (PRESS; Bottomley, 1984) with echo time 20 ms, repetition time 3000 ms, 128 acquisitions, sixteen phase rotation steps (Hennig, 1992), water presaturation and outer volume suppression was used for single-voxel spectroscopy. Typical voxel dimensions were 12 × 11 × 18 mm3 for all three muscle groups. The axes of the voxels in the m. tibialis anterior and m. vastus medialis were placed along the magnet axes, while the voxels in the m. vastus intermedius were tilted. Position and size of the voxels were chosen carefully in a scout image to avoid contamination from EMCL. Voxel positions in m. tibialis anterior were calculated for the resonance frequency of creatine and/or phosphocreatine-CH3 groups (i.e. centre frequency at 3·02 ppm), and those in the m. vastus for lipid signals (1·7 ppm). Variations in the voxel size were achieved by modification of the gradient strength.
Fitting of spectra and calibration
The spectra were processed using the SAGE program (General Electric) and quantified in the frequency domain using a recently developed fitting algorithm that allows for frequency selective fitting and implementation of previous knowledge (Slotboom et al. 1998). This fitting algorithm uses time domain model signals for the quanti-fication of the water-suppressed proton spectra, allowing for a mixed line-shape fit and the incorporation of previous knowledge. Differences between spectra with different amounts of IMCL (Fig. 1) and EMCL signals, respectively, were used to obtain appropriate starting values and constraints (for details, see Boesch et al. 1997; Slotboom
et al. 1998).
MR signals have to be corrected for arbitrary variations in sensitivity, electronic amplification and other signal processing that may change from experiment-to-experiment. Typically, this correction can be done by comparison of the signals with a spectrum obtained from the same volume without suppression of the water resonance (Barker et al. 1993). This unsuppressed signal was corrected by a double-exponential fit for signal decay due to trans-versal relaxation, a procedure which is established and described in detail for brain tissue elsewhere (Kreis et al. 1993). The transversal relaxation time for the decay of the water component is typically 28 ms. A water content of 76 % voxel volume (Sjogaard & Saltin, 1982) and typically 2 % of other MR-visible signals with longer transversal relaxation times (lipids, soluble metabolites) are estimated to contribute to the total MR signal. The sum, i.e. 78 % volume of the voxel generating the total MR signal, is then used to calculate the (hypothetical) signal of the voxel filled with 100 % water.
For an absolute quantification expressed as mmol/kg wet weight or ml/100 ml, an assumption for the composition of the fatty acid chains in IMCL is necessary. Using triacylglycerol compositions of muscle and/or adipose tissue published by several authors (Havel et al. 1964; Vessby et al. 1994; Andersson et al. 1998; Thomas et al. 1998) and chemical shift of the different 1H in fatty acid chains according to published values (Evanochko & Pohost, 1994), the values relevant for the conversion of institutional units into mmol/kg wet weight or ml/100 ml remain to some extent independent of the specific composition: the average molecular mass of one triacyl-glycerol molecule 858 g/mol; the average no. of 1H resonating at 1·28 ppm per triacylglycerol molecule 621H/molecule; and the average total no. of 1H per triacyl-glycerol molecule 101 1H/molecule. The average proton density for such an IMCL mixture (0·108 mol 1H/ml) is very similar to that of water (0·111 mol 1H/ml). The decay of the IMCL CH2 signals due to an echo time of 20 ms is approximately 0·779 (transversal relaxation time typically 80 ms). In order to convert concentrations based on volume to concentrations based on weight (per kg wet weight), a specific density of muscle tissue of 1·06 g/ml on a wet weight basis (Mendez & Keys, 1960) is assumed. Using a specific density of 0·918 g/ml for lipids, it can be shown that multiplication by 10·1 is needed to convert ml IMCL/100 ml into mmol/kg wet weight.
Results
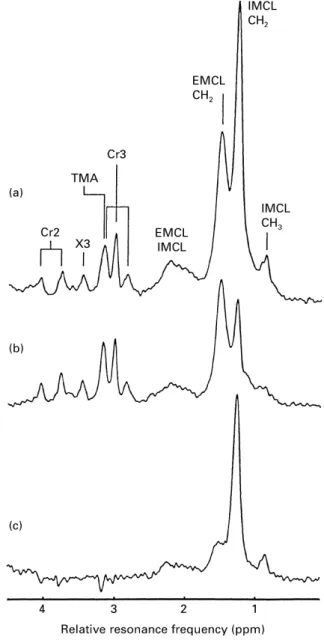
1H MR spectra of human muscle show a series of resonances if contamination by the lipids in fat layers is avoided (Fig. 1). The peaks from the CH3 and CH2 groups in creatine and/or phosphocreatine feature a splitting due to dipolar coupling (Kreis & Boesch, 1994). This splitting is dependent on the angle between muscle fibre and static
Fig. 1. 1H-magnetic resonance spectra of human skeletal muscle
(m. tibialis anterior) before (a) and approximately 2 h after (b) a marathon run. (c) This shows the difference between a and b. The assignment of the resonances (Kreis & Boesch, 1996; Boesch et al. 1997; Kreis et al. 1997) is as follows: Cr2, creatine and/or phospho-creatine-CH2; TMA, trimethylammonium-containing compounds; X3,
tentatively assigned to taurine; Cr3, creatine and/or phosphocreat-ine-CH3; EMCL, extramyocellular lipids; IMCL, intramyocellular
lipids. This example has been chosen to demonstrate the difference spectrum (c) that consists almost exclusively of IMCL. Since the contribution from EMCL is strongly dependent on the exact location of the voxel, subsequent examinations rarely show an identical contribution from EMCL, as is the case in this example. ppm, Parts per 106. For details of volunteer and procedures, see p. 842.
magnetic field. The trimethylammonium resonance results from a mixture of different metabolites, including carnitine. The IMCL levels in this example varied dramatically before and approximately 2 h after a marathon run (Fig. 1). The ‘difference’ spectrum clearly shows the CH2 and CH3 groups of IMCL. The EMCL peaks were strongly dependent on the inclusion of fat layers in the voxel (i.e. of fasciae and subcutaneous fat). Repositioning of the volunteer in two subsequent examinations resulted, in general, in a reproducibility of the EMCL peaks of the order of only 10–50 % due to a shift in the voxel of a few millimetres. The spectra in Fig. 1 show by chance almost no difference in the EMCL peak before and after a marathon run. This example was chosen to illustrate clearly the effect on the IMCL peaks and the calculation of a ‘difference’ spectrum. Other resonances in 1H MR spectra of human muscle have not been assigned in this example because: (1) they are located outside the displayed chemical shift range (e.g. carnosine); (2) they need special editing techniques (e.g. lactate); (3) they are not visible at rest (e.g. acetylcarnitine; Kreis et al. 1999); (4) they have not been finally identified (e.g. the peak at 3·4 ppm which can be tentatively attributed to taurine). The spectra were scaled using the unsuppressed water and lipid signal that was obtained from the same voxel immediately after the metabolite spectrum was obtained.
Fig. 2 illustrates 1H MR spectra of IMCL in different muscle groups of the human leg. Orientation-dependent features of the spectra were different in the three examples because fibre orientations were not identical. Muscle fibres in m. tibialis anterior were almost parallel to the static magnetic field, and subsequently the dipolar splitting and the separation of IMCL and EMCL resonances were greatest. Fibres in m. vastus medialis and intermedius seemed to be at a larger angle to the static field, which resulted in a slightly reduced dipolar splitting and separation of IMCL and EMCL resonances. The reduced effect on the dipolar splitting can be seen best at 3·93 ppm (doublet of CH2 protons in creatine and/or phosphocreatine) and at approximately 2·8 ppm (right-hand peak of the triplet formed by the CH3 groups of creatine and/or phosphocre-atine). The IMCL content was markedly lower in m. tibialis anterior than in the m. vastus.
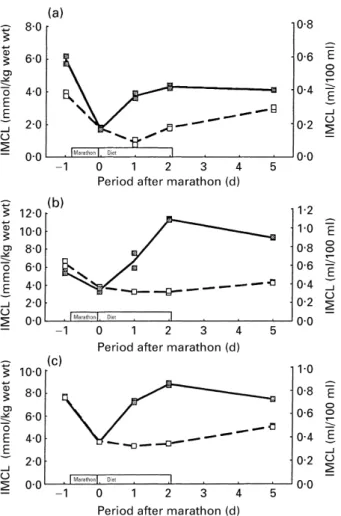
Fig. 3 illustrates depletion and repletion of IMCL as a function of two different recovery protocols in three different muscles. The post-marathon levels of IMCL were almost identical after the first and second marathon in all three muscles. It seems that this result happened by chance, since no special precautions were taken to achieve this result, except that the exercise load (duration×intensity) was as similar as possible during both runs. The effects of the two different recovery protocols, i.e. mainly two different diets, were marked in all three muscle groups. During the low-fat diet there was almost no repletion in the m. vastus intermedius and medialis and a minimal repletion only in the m. tibialis anterior. In contrast, the repletion was remarkably fast during the high-fat diet in all three muscles.
Fig. 4 shows the same data, but used to compare the levels in the three different muscles. The m. vastus contained about twice the concentration of IMCL found in
m. tibialis anterior, as can also be seen in the examples
shown in Fig. 2. The general pattern of the IMCL levels before and after depletion, during the diets, and in the interval with uncontrolled diet was the same in all three muscles.
Discussion
The present discussion will focus on (1) the application, in general, of 1H MRS for the determination of IMCL in human muscle, with a specific focus on pitfalls and limit-ations of the method, and (2) the experimental example demonstrating the effect of two diets after two consecutive marathons on the IMCL levels in one volunteer.
Fig. 2. 1H-magnetic resonance spectra of three different types of
skeletal muscle in the same volunteer at 2 d after a marathon run. Voxels of 11×12×18 mm3 were located in (a) m. vastus intermedius,
(b) m. vastus medialis and (c) m. tibialis anterior. The spectrum of m. tibialis anterior shows the best separation of the intramyocellular and extramyocellular lipids (IMCL and EMCL respectively) signals, due to the parallel orientation of the fat layers to the magnetic field (Boesch
et al. 1997). The IMCL levels in the m. vastus are significantly higher than the one in the m. tibialis. ppm, Parts per 106.
MR has the advantage that the human body can be inves-tigated non-invasively and without using ionizing radiation. Thus, it is possible to study the same subject safely and repeatedly, with a temporal resolution that is far superior to that which can be achieved using invasive methods. Since MRS examinations can be combined with MRI in the same session, estimation of the muscle volume or any other morphological examination can be obtained at minimal cost. While invasive methods are restricted to some large super-ficial muscles without major vessels and nerves, MR can be applied to very different muscle groups. As far as safety and signal acquisition in general is concerned, 1H MRS could be applied to almost every one of the larger muscles
of the human body. However, 1H MRS still has
some important limitations that are a consequence of (1) the dependence of the signal on the fibre orientation and (2) the fact that a voxel of approximately 10×10×15 mm3, with minimal contributions from fat layers, is needed. The
limited spatial resolution of MRS is not necessarily a disadvantage (under these circumstances, it is an advantage). A comparison of morphometry, chemical analysis and 1H MRS (Boesch et al. 1998) revealed that MRS yields highly accurate levels for IMCL. It appears that the size of the voxel guarantees an averaging of microscopic variations within the muscle, which is not the case for morphometry and chemical analysis of a biopsy specimen, both of which sample only a minute portion (100 mg) of muscle tissue. An advantage of biopsy-based methods, on the other hand, is obviously that they allow the application of other techniques to the sample, such as those used in molecular biology, histochemistry etc.
MR results can be analysed without subjective inter-pretation and data analysis, and can therefore be made operator-independent. The development of automatic evaluation programs and the determination of previous knowledge for the spectra analysis (Slotboom et al. 1998) can be carried out on one occasion and requires a consid-erable time period (typically several months). After that investment MR results can be calculated almost automati-cally and within a couple of minutes. Morphometric examination of electron micrographs, on the other hand, involves several chemical steps and waiting periods for the preparation of the plates, and subsequently an experienced individual has to assess the volume of the IMCL droplets. Overall, this procedure takes on average several months, and the results of morphometric analysis are highly dependent on the experience of the individual. However, this Fig. 4. Comparison of intramyocellular lipid (IMCL) levels in m. vastus intermedius (W1W), m. vastus medialis (o---o), m. tibialis
anterior (Z1Z) for a low-fat diet (a) and a high-fat diet (b) (same data as in Fig. 3, grouped for different diets). The volunteer abstained from his regular daily exercise during the high-fat diet to enhance the recovery effect. The changes of the IMCL concentrations show a similar pattern in all three muscles, but at different levels. The IMCL concentration in m. tibialis is typically only half the concentration in the m. vastus. IMCL levels are expressed as ml/100 ml and mmol/kg wet weight. The two points for each measurement represent two subsequent spectra and fits respectively of the same voxel without repositioning.
Fig. 3. Intramyocellular lipid (IMCL) levels in three different muscle groups before and after a marathon run followed by a high-fat (Z1Z) or a low-fat diet (o---o). The volunteer abstained from his regular daily exercise during the high-fat diet to enhance the recovery effect. (a) m. tibialis anterior; (b), m. vastus intermedius; (c), m. vastus medialis. The comparison demonstrates the strong effect of the diet on the recovery of IMCL after depletion by the marathon run. IMCL levels are expressed as ml/100 ml and mmol/kg wet weight. The two points for each measurement represent two subsequent spectra and fits respectively of the same voxel without repositioning.
comparison does not imply that MR results can be obtained automatically and without specific knowledge of the method. MR in general, and 1H MRS in particular, need highly specialized staff for the signal acquisition, which is prone to some disadvantages, pitfalls and limitations. The crucial step in determining the quality of 1H MR spectra is the placement of the voxel. In addition, efficient suppression of signals from outside the voxel and an excellent definition of the voxel shape is mandatory (Kreis & Boesch, 1996; Boesch et al. 1997; Kreis, 1997).
To distinguish the effect of diet and exercise on both IMCL and EMCL levels it would be desirable to interpret both 1H MR signals. However, in order to recognize the potential of 1H MRS for the determination of muscle lipids, it is essential to understand the principal difference between EMCL and IMCL MR signals. IMCL resonances are proportional to other muscle metabolites such as creatine (Boesch et al. 1997) that are homogeneously distributed in macroscopic dimensions. Thus, re-sizing or moving the MRS voxel will not change the normalized IMCL signal, unless adjacent parts of a muscle were to contain markedly different IMCL levels. The EMCL signal, on the other hand, is primarily a result of the position of the voxel, and an enlargement or movement of the voxel can change the signal by an order of magnitude (Boesch et al. 1997). Inclusion of a tiny portion of adipose tissue such as fasciae or subcutaneous fat can change the amplitude of the EMCL signal much more than any exercise. Thus, if the current technique of 1H MRS is used, EMCL signals should not be interpreted on a physiological basis. This interpretation would require further methodological developments relating to chemical shift imaging, a technique that obtains signals from multiple voxels simultaneously.
MR examinations are relatively expensive and cannot be carried out in the field. The protocols have to be adapted to the availability of MR equipment, e.g. the end of a test run should not be too far from the MR system. Short-term exercise sessions have to be modified so that that they can be performed in the magnet bore, using MR compatible ergometers and equipment. MR methods in general, and 1H MRS in particular, are very susceptible to movement of the observed region. Movement during the acquisition of MR images can lead to smearing effects in phase direction. If the 1H MRS voxel hits a fat layer during one or several acquisition steps due to movement of the extremity, the spectrum can be hidden by a large signal from the fat. Thus, immobilization of the observed muscle is imperative. Spurious signals from the wrong location which may pass the filters built into the MR sequence (so called ‘ghosts’) can introduce erroneous variations in the signal amplitudes, resulting in inaccurate IMCL levels. The potential effect of spurious signals is obviously larger in individuals with thicker fat layers. Thus, it is especially important in over-weight patients, e.g. elderly patients with non-insulin-dependent diabetes, to avoid methodological imperfection. Fig. 2 shows that the m. tibialis anterior is an ideal muscle in which to investigate IMCL levels, since the separation of EMCL and IMCL resonances is optimal. In addition, this muscle is fixed to the adjacent tibia bone and can be immobilized efficiently if knee and foot are kept motionless. It is evident that the study of other muscles requires more
investigation and methodological improvement, e.g. for the determination of previous knowledge for the fitting algorithm (Slotboom et al. 1998). Another advantage of
m. tibialis anterior is the fact that it can be depleted without
causing large systemic effects, i.e. without a considerable challenge to the cardiovascular system which may be prohibitive for normal subjects and patients. This property was demonstrated in an earlier study (Boesch et al. 1997) in which IMCL levels in the m. tibialis anterior of an untrained girl were found to be considerably lower after moderate walking. In the present study, the depletion of the much larger m. vastus was achieved by marathon runs, obviously a situation which cannot be achieved by many individuals.
The present study shows that three different muscle groups behave similarly, but at different absolute levels. Muscles of the quadriceps group seem to have much larger stores of IMCL than other muscles, because of the higher concentration and a much larger volume. The example shows clearly that diet can modulate the repletion of IMCL levels markedly. The specific experiment using two consecutive marathon runs followed by two different diets was performed in the pilot phase of a larger study, with the aim of evaluting the conditions necessary for large changes in the IMCL levels. In order to determine the conditions that could maximize the range of IMCL levels, the subject exercised at his regular daily intensity on the low-fat diet, but rested during the 2 d recovery on the high-fat diet. Clearly, this outcome is only a case report producing limited evidence, since an individual reaction of a well-trained subject cannot be excluded. Specific precautions have to be taken when the two marathons are compared, since one marathon was completed during a competition and the other marathon was completed 2 weeks later at a slightly lower performance level (duration 5 min longer). It is unlikely, but cannot be excluded, that the results could be influenced by micro-trauma during the higher performance in the competition, or follow-on effects of the first marathon on the second marathon. However, this example shows dramatically the adaptability of the IMCL levels and the potential of 1H MRS to investigate this energy store repeatedly. It confirms earlier studies of diet-dependent changes after marathon runs (Staron et al. 1989); however, it should be noted that another 1H MRS study (Rico-Sanz
et al. 1998) did not report changes in IMCL levels as the
result of alternating intensity exercise and fatigue.
Some controversy exists as to whether or not IMCL are oxidized during exercise. Using morphometric, indirect, as well as biochemical methods, many workers have reported decreases in muscle triacylglycerol content in human subjects after prolonged exercise (Froberg & Mossfeldt, 1971; Oberholzer et al. 1976; Essen, 1977; Hurley et al. 1986; Staron et al. 1989), while other workers have not (Kiens et al. 1993; Starling et al. 1997; Kiens & Richter, 1998; Bergman et al. 1999). It has been suggested that the discrepancy could be resolved, based on the evidence that muscle triacylglycerol is oxidized in the early recovery phase after exercise rather than (Kiens & Richter, 1998), or in addition to (Staron et al. 1989), during exercise. Another possibility is that lipid analysis from biopsy samples is too variable (Wendling et al. 1996) to measure small decreases, with one study (Bergman et al. 1999) using this method
even indicating a paradoxical rise in muscle triacylglycerol required during exercise.
The experiments presented in the present paper are not intended to answer the specific question as to whether IMCL are used during and/or after exercise, as their purpose was to: (a) illustrate methodological aspects of the use of 1H MRS to determine IMCL non-invasively; (b) document the adaptability of IMCL stores in different muscles. However, results shown in Fig. 4 for the low-fat diet confirm evidence for a continued use of IMCL during the first phase of recovery. With the reasonable assumption that the difference in the IMCL levels pre- and post-marathon (within 2 h) is mainly explained by oxidation during the actual run, it is possible to estimate their energy contribution to fuel requirement from the changes measured in three muscles of the leg. The decline in IMCL ranged from 2·4 mmol/kg wet weight (m. vastus intermedius) to 4·0 mmol/kg wet weight (m. vastus medialis). The energy supplied by IMCL therefore amounted to a value between 1·36 MJ (10 kg active muscle similar to m. vastus
intermedius; high estimate) and 0·57 MJ (7 kg active muscle
similar to m. vastus medialis; low estimate). With a net cost of running of 4 kJ/kg body weight per km (Margaria et al. 1963), energy expenditure during the marathon was estimated at 10·4 MJ. If it is postulated that 50 % of the energy is derived from lipids, IMCL may have contributed between 26 and 11 % of the lipid fuel during the marathon run, the remainder being supplied by circulating fatty acids. The estimation of the absolute concentrations does not account exactly for the pulse profiles, chemical shift displacements, or oedema after the marathon. MR-invisible compartments of the volume, and triacylglycerol compo-sition, were estimated from the literature. Fixed transversal relaxation time values were used for lipid resonances (80 ms), and fully-relaxed lipid (T1 approximately 300 ms) at a repetition rate of 3 s was assumed as well as fully-relaxed water signals at a repetition rate of 12 s. However, this estimation yields results of the correct order of magnitude, and the values of 0·5–0·75 ml IMCL/100 ml at rest for the m. vastus are in reasonable agreement with biopsy examinations that showed 0·85 ml/100 ml in highly-trained athletes and 0·34 ml/100 ml in unhighly-trained males (Hoppeler et al. 1973).
MR provides several methods for characterizing human muscle non-invasively. While measurement of volume by means of MRI is a well-established method, the use of 1H MRS needs validation (Boesch et al. 1998) and method-ological improvement, e.g. for application in other muscle groups and in pathologically-altered muscles, and simul-taneous data acquisition in multiple voxels. However, it is clear that 1H MRS has the potential to replace invasive determinations of IMCL levels. Knowledge of storage and use of IMCL in human subjects is not only important for sports and exercise (Boesch et al. 1996, 1997; Ericsson et al. 1998; Krssak et al. 1998), but also for the understanding of prevailing pathologies such as diabetes (Stein et al. 1997, 1998; Ericsson et al. 1998; Krssak et al. 1999).
The strength of MR will be the combination of MRI for the evaluation of muscle volumes and activity patterns, 13C MRS for the determination of muscle glycogen levels, and 1H MRS for the measurement of IMCL (Boesch & Kreis,
1999). These variables account for the intramuscular energy supply in human subjects. Further combination with the MRS determination of short-term metabolites such as lactate, acetylcarnitine, myoglobin, high-energy phosphates etc. is technically feasible and illustrates the potential of MR.
Acknowledgements
The authors would like to acknowledge invaluable discussions with H. Hoppeler and H. Howald, as well as support by the Swiss National Fund (no. 31–42162.94).
References
Andersson A, Sjodin A, Olsson R & Vessby B (1998) Effects of physical exercise on phospholipid fatty acid composition in skeletal muscle. American Journal of Physiology 274, E432–E438.
Avison MJ, Rothman DL, Nadel E & Shulman RG (1988) Detection of human muscle glycogen by natural abundance 13C NMR. Proceedings of the National Academy of Sciences USA 85, 1634–1636.
Barany M & Venkatasubramanian PN (1989) Volume-selective water-suppressed proton spectra of human brain and muscle in vivo. NMR in Biomedicine 2, 7–11.
Barker PB, Soher BJ, Blackband SJ, Chatham JC, Mathews VP & Bryan RN (1993) Quantitation of proton NMR spectra of the human brain using tissue water as an internal concentration reference. NMR in Biomedicine 6, 89–94.
Basser PJ (1995) Inferring microstructural features and the physiological state of tissues from diffusion-weighted images. NMR in Biomedicine 8, 333–344.
Bassett LW & Gold RH (1989) Magnetic resonance imaging of the musculoskeletal system – an overview. Clinical Orthopedics and Related Research 244, 17–28.
Becker ED, Fisk C & Khetrapal CL (1996) The development of NMR. In Encyclopedia of Nuclear Magnetic Resonance, pp. 1–160 [DM Grant and RK Harris, editors]. Chichester, West Sussex: John Wiley.
Bergman BC, Butterfield GE, Wolfel EE, Casazza GA, Lopaschuk GD & Brooks GA (1999) Evaluation of exercise and training on muscle lipid metabolism. American Journal of Physiology 276, E106–E117.
Boesch C & Kreis R (1997) MR-spectroscopy (MRS) of different nuclei applied to human muscle: Additional information obtained by 1H-MRS. International Journal of Sports Medicine 18, S310–S312.
Boesch C & Kreis R (1999) Imaging and spectroscopy of muscle. In Encyclopedia of Nuclear Magnetic Resonance – Medical Spin-Off [IR Young, DM Grant and RK Harris, editors]. Chichester, West Sussex: John Wiley & Sons (In the Press).
Boesch C, Kreis R, Howald H, Matter S, Billeter R, Essen-Gustavsson B & Hoppeler H (1998) Validation of intra-myocellular lipid (IMCL) levels determined by 1H-MRS, using morphometry and chemical analysis in human biopsy samples. Proceedings of the International Society of Magnetic Resonance in Medicine Annual Meeting 3, 1785 Abstr.
Boesch C, Slotboom J, Hoppeler H & Kreis R (1997) In vivo determination of intra-myocellular lipids in human muscle by means of localized 1H-MR-spectroscopy. Magnetic Resonance in Medicine 37, 484–493.
Boesch C, Slotboom J, Kamber M, Koster M, Hoppeler H & Kreis R (1996) Activity-dependent distribution of intra-myocellular
lipids determined by 1H-MRS. Magnetic Resonance Materials in Physics, Biology, and Medicine 4, Suppl., 154–155 Abstr. Bottomley PA (1984) US Patent no. 4,480,228.
Brooks GA & Mercier J (1994) Balance of carbohydrate and lipid utilization during exercise: the ‘crossover’ concept. Journal of Applied Physiology 76, 2253–2261.
Brown SM & Bradley WG Jr (1994) Kinematic magnetic resonance imaging of the knee. Magnetic Resonance Imaging Clinics of North America 2, 441–449.
Bruhn H, Frahm J, Gyngell ML, Merboldt KD, Haenicke W & Sauter R (1991) Localized proton NMR spectroscopy using stimulated echoes: Applications to human skeletal muscle in vivo. Magnetic Resonance in Medicine 17, 82–94.
Conley KE, Cress ME, Jubrias SA, Esselman PC & Odderson IR (1995) From muscle properties to human performance, using magnetic resonance. Journal of Gerontology 50A, Special no., 35–40.
Cooper DM & Barstow TJ (1996) Magnetic resonance imaging and spectroscopy in studying exercise in children. Exercise and Sport Sciences Review 24, 475–499.
Elliott MA, Walter GA, Gulish H, Sadi AS, Lawson DD, Jaffe W, Insko EK, Leigh JS & Vandenborne K (1997) Volumetric measurement of human calf muscle from magnetic resonance imaging. Magnetic Resonance Materials in Physics, Biology, and Medicine 5, 93–98.
Ericsson A, Franck A, Sjödin A, Andersson A & Wesby B (1998) Intra-myocellular lipids in human skeletal muscle, after an ultra marathon race studied by in vivo 1H-MRS. Magnetic Resonance Materials in Physics, Biology, and Medicine 6, Suppl. 1, 219 Abstr.
Essen B (1977) Intramuscular substrate utilization during prolonged exercise. Annals of the New York Academy of Sciences 301, 30–44.
Evanochko WT & Pohost GM (1994) Structural studies of NMR detected lipids in myocardial ischemia. NMR in Biomedicine 7, 269–277.
Fleckenstein JL, Bertocci LA, Nunnally RL, Parkey RW & Peshock RM (1989) Exercise-enhanced MR imaging of variations in forearm muscle anatomy and use: importance in MR spectroscopy. American Journal of Roentgenology 153, 693–698.
Fleckenstein JL, Canby RC, Parkey RW & Peshock RM (1988) Acute effects of exercise on MR imaging of skeletal muscle in normal volunteers. American Journal of Roentgenology 151, 231–237.
Fleckenstein JL, Weatherall PT, Bertocci LA, Ezaki M, Haller RG, Greenlee R, Bryan WW & Peshock RM (1991) Locomotor system assessment by muscle magnetic resonance imaging. Magnetic Resonance Quarterly 7, 79–103.
Froberg SO & Mossfeldt F (1971) Effect of prolonged strenuous exercise on the concentration of triglycerides, phospholipids and glycogen in muscle of man. Acta Physiologica Scandinavica 82, 167–171.
Fukunaga T, Roy RR, Shellock FG, Hodgson JA, Day MK, Lee PL, Kwong-Fu H & Edgerton VR (1992) Physiological cross-sectional area of human leg muscles based on magnetic resonance imaging. Journal of Orthopaedic Research 10, 926–934.
Fusch C, Slotboom J, Fuehrer U, Schumacher R, Zimmermann W, Moessinger A, Blum JW & Boesch C (1998) Measurement of neonatal body composition: Validation of 1H-3D-CSI and MRI by chemical analysis in piglets. Proceedings of the International Society of Magnetic Resonance in Medicine Annual Meeting 3, 1811 Abstr.
Gruetter R, Prolla TA & Shulman RG (1991) 13C NMR visibility of rabbit muscle glycogen in vivo. Magnetic Resonance in Medicine 20, 327–332.
Havel RJ, Carlson LA, Ekelund LG & Holmgren A (1964) Turnover rate and oxidation of different free fatty acids in man during exercise. Journal of Applied Physiology 19, 613–618. Hennig J (1992) The application of phase rotation for localized in
vivo proton spectroscopy with short echo times. Journal of Magnetic Resonance 96, 40–49.
Herzog RJ (1994) Efficacy of magnetic resonance imaging of the elbow. Medicine and Science in Sports and Exercise 26, 1193–1202.
Heymsfield SB, Gallagher D, Visser M, Nunez C & Wang ZM (1995) Measurement of skeletal muscle: laboratory and epidemiological methods. Journal of Gerontology 50A, Special no., 23–29.
Hoppeler H, Lüthi P, Claassen H, Weibel ER & Howald H (1973) The ultrastructure of the normal human skeletal muscle. A morphometric analysis on untrained men, women, and well-trained orienteers. Pflügers Archiv 344, 217–232.
Hurley BF, Nemeth PM, Martin WH, Hagberg JM, Dalsky GP & Holloszy JO (1986) Muscle triglyceride utilization during exercise: effect of training. Journal of Applied Physiology 60, 562–567.
Kamber M, Koster M, Kreis R, Walker G, Boesch C & Hoppeler H (1999) Creatine supplementation and performance. Part I: Physical performance, clinical chemistry, and muscle volume. Medicine and Science in Sports and Exercise (In the Press). Kiens B, Essen-Gustavsson B, Christensen NJ & Saltin B (1993)
Skeletal muscle substrate utilization during submaximal exercise in man: effect of endurance training. Journal of Physiology 469, 459–478.
Kiens B & Richter EA (1998) Utilization of skeletal muscle triacylglycerol during postexercise recovery in humans. American Journal of Physiology 275, E332–E337.
Kneeland JP (1997) MR imaging of muscle and tendon injury. Eu-ropean Journal of Radiology 25, 198–208.
Kreis R (1997) Quantitative localized 1H MR spectroscopy for clinical use. Progress in Nuclear Magnetic Resonance Spectro-scopy 31, 155–195.
Kreis R & Boesch C (1994) Liquid-crystal-like structures of human muscle demonstrated by in vivo observation of direct dipolar coupling in localized proton magnetic resonance spectroscopy. Journal of Magnetic Resonance 104B, 189–192.
Kreis R & Boesch C (1996) Spatially localized, one- and two-dimensional NMR spectroscopy and in vivo application to human muscle. Journal of Magnetic Resonance 113B, 103–118. Kreis R, Ernst T & Ross BD (1993) Absolute quantitation of water and metabolites in the human brain. II. Metabolite concentrations. Journal of Magnetic Resonance 102B, 9–19. Kreis R, Jung B, Rotman S, Slotboom J & Boesch C (1999)
Non-invasive observation of acetyl-group buffering by 1H-MR spectroscopy in exercising human muscle. NMR in Biomedicine (In the Press).
Kreis R, Koster M, Kamber M, Hoppeler H & Boesch C (1997) Peak assignment in localized 1H MR spectra of human muscle based on oral creatine supplementation. Magnetic Resonance in Medicine 37, 159–163.
Krssak M, Petersen KF, Bergeron R, Price T, Roden M & Shulman GI (1998) 13C and 1H NMR assessment of glycogen and intramyocellular lipid utilization during prolonged exercise and recovery in man. Proceedings of the International Society of Magnetic Resonance in Medicine Annual Meeting 1, 389 Abstr. Krssak M, Petersen KF, Dresner A, DiPietro L, Vogel SM, Rothman DL, Shulman GI & Roden M (1999) Intramyocellular lipid concentrations are correlated with insulin sensitivity in humans: a 1H NMR spectroscopy study. Diabetologia 42, 113–116.
LeBlanc AD, Schneider VS, Evans HJ, Pientok C, Rowe R & Spector E (1992) Regional changes in muscle mass following
17 weeks of bed rest. Journal of Applied Physiology 73, 2172–2178.
McColl RW, Fleckenstein JL, Bowers J, Theriault G & Peshock RM (1992) Three-dimensional reconstruction of skeletal muscle from MRI. Computerized Medical Imaging and Graphics 16, 363–371.
McCully KK & Posner JD (1995) The application of blood flow measurements to the study of aging muscle. Journal of Gerontology 50A, Special no., 130–136.
Margaria R, Cerretelli P, Aghemo P & Sassi G (1963) Energy cost of running. Journal of Applied Physiology 18, 367–370. Mendez J & Keys A (1960) Density and composition of
mammalian muscle. Metabolism 9, 184–188.
Narayana PA, Hazle JD, Jackson EF, Fotedar LK & Kulkarni MV (1988) In vivo 1H spectroscopic studies of human gastrocnemius muscle at 1·5 T. Magnetic Resonance Imaging 6, 481–485. Narici MV, Landoni L & Minetti AE (1992) Assessment of human
knee extensor muscles stress from in vivo physiological cross-sectional area and strength measurements. European Journal of Applied Physiology and Occupational Physiology 65, 438–444. Ntziachristos V, Kreis R, Boesch C & Quistorff B (1997) Dipolar
resonance frequency shifts in 1H-MR spectra of skeletal muscle: Confirmation in rats at 4·7 T in vivo and observation of changes post-mortem. Magnetic Resonance in Medicine 38, 33–39. Oberholzer F, Claassen H, Moesch H & Howald H (1976)
Ultrastrukturelle, biochemische und energetische Analyse einer extremen Dauerleistung (100 km-Lauf) (Ultrastructural, bio-chemical and energy analysis of extreme duration performance (100 km run)). Schweizerische Zeitschrift für Sportmedizin 2, 71–98.
Pan JW, Hamm JR, Hetherington HP, Rothman DL & Shulman RG (1991) Correlation of lactate and pH in human skeletal muscle after exercise by 1H NMR. Magnetic Resonance in Medicine 20, 57–65.
Price TB, Rothman DL, Taylor R, Avison MJ, Shulman GI & Shulman RG (1994) Human muscle glycogen resynthesis after exercise: insulin-dependent and independent phases. Journal of Applied Physiology 76, 104–111.
Rico-Sanz J, Hajnal JV, Thomas EL, Mierisova S, Ala-Korpela M & Bell JD (1998) Intracellular and extracellular skeletal muscle triglyceride metabolism during alternating intensity exercise in humans. Journal of Physiology 510, 615–622.
Roberts N, Cruz-Orive LM, Reid NMK, Brodie DA, Bourne M & Edwards RHT (1993) Unbiased estimation of human body composition by the Cavalieri method using magnetic resonance imaging. Journal of Microscopy 171, 239–253.
Romijn JA, Coyle EF, Sidossis LS, Gastaldelli A, Horowitz JF, Endert E & Wolfe RR (1993) Regulation of endogenous fat and carbohydrate metabolism in relation to exercise intensity and duration. American Journal of Physiology 265, E380–E391. Schick F, Eismann B, Jung WI, Bongers H, Bunse M & Lutz O
(1993) Comparison of localized proton NMR signals of skeletal muscle and fat tissue in vivo: Two lipid compartments in muscle tissue. Magnetic Resonance in Medicine 29, 158–167.
Sjogaard G & Saltin B (1982) Extra- and intracellular water spaces in muscles of man at rest and with dynamic exercise. American Journal of Physiology 243, R271–R280.
Slotboom J, Boesch C & Kreis R (1998) Versatile frequency domain fitting using time domain models and prior knowledge. Magnetic Resonance in Medicine 39, 899–911.
Sonin AH (1994) Magnetic resonance imaging of the extensor mechanism. Magnetic Resonance Imaging Clinics of North America 2, 401–411.
Starling RD, Trappe TA, Parcell AC, Kerr CG, Fink WJ & Costill DL (1997) Effects of diet on muscle triglyceride and endurance performance. Journal of Applied Physiology 82, 1185–1189.
Staron RS, Hikida RR, Murray TF, Hagerman FC & Hagerman MT (1989) Lipid depletion and repletion in skeletal muscle following marathon. Journal of the Neurological Sciences 94, 29–40. Stein DT, Szczepaniak I, Garg A, Malloy C & McGarry JD (1997)
Intramuscular lipid is increased in subjects with congenital generalized lipodystrophy. Diabetes 46, Suppl.1, 242A Abstr. Stein DT, Szczepaniak LS, Dobbins RL, Snell P & McGarry JD
(1998) Skeletal muscle triglyceride stores are increased in insulin resistant states. Proceedings of the International Society of Magnetic Resonance in Medicine Annual Meeting 1, 388 Abstr. Terk MR & Kwong PK (1994) Magnetic resonance imaging of the
foot and ankle. Clinics in Sports Medicine 13, 883–908. Thomas EL, Cunnane SC & Bell JD (1998) Critical assessment of
in vivo 13C NMR spectroscopy and gas-liquid chromatography in the study of adipose tissue composition. NMR in Biomedicine 11, 290–296.
Tung GA & Brody JM (1997) Contemporary imaging of athletic injuries. Clinics in Sports Medicine 16, 393–417.
Vessby B, Tengblad S & Lithell H (1994) Insulin sensitivity is related to the fatty acid composition of serum lipids and skeletal muscle phospholipids in 70-year-old men. Diabetologia 37, 1044–1050.
Vock R, Hoppeler H, Claassen H, Wu DXY, Weber JM, Taylor CR & Weibel ER (1996) Design of the oxygen and substrate pathways. VI. Structural basis of intracellular substrate supply to mitochondria in muscle cell. Journal of Experimental Biology 199, 1689–1697.
Walker CW & Moore TE (1997) Imaging of skeletal and soft tissue injuries in and around the knee. Radiologic Clinics of North America 35, 631–653.
Wary C, Bloch G, Jehenson P & Carlier PG (1996) C13 NMR spectroscopy of lipids: A simple method for absolute quantitation. Anticancer Research 16, 1479–1484.
Wendling PS, Peters SJ, Heigenhauser GJ & Spriet LL (1996) Variability of triacylglycerol content in human skeletal muscle biopsy samples. Journal of Applied Physiology 81, 1150–1155.
Williams SR, Gadian DG, Proctor E, Sprague DB, Talbot DF, Young IR & Brown FF (1985) Proton NMR studies of muscle metabolites in vivo. Journal of Magnetic Resonance 63, 406–412.