© 1988 European Dialysis and Transplant Association-European
Renal Association
Nephrology
Dialysis
Transplantation
Registry Report
Survival on Renal Replacement Therapy: Data from the EDTA Registry
F. P. Brunner Departement fur Innere Medizin,Universitat Basel, Switzerland
M. Broyer Hopital Necker Enfan'ts Malades, Paris, France
H. Brynger Department of Surgery I, Sahlgrenska Sjukhuset, Goteborg, Sweden
S. Challah St Thomas' Hospital, London, United Kingdom
S. R. Dykes St Thomas' Hospital, London, United Kingdom
W. Fassbinder Klinikum der Johann Wolfgang Goethe-Universitat, Frankfurt am Main, Federal Republic of Germany
R. Oules Centre Hospitalier Regional et Universitaire de Nimes, France G. Rizzoni Ospedale Pediatrico Bambino
Gesu, Istituto Scientifico di Ricerca, Roma, Italy
N. H. Selwood UK Transplant Service, Bristol, United Kingdom
A. J. Wing St Thomas' Hospital, London, United Kingdom
Abstract. Extensive survival data are presented from the EDTA Registry's files for patients who started renal replacement therapy in 1970-1974 compared to 1980-1984. The contribution of the different treatment modalities (haemodialysis, continuous peritoneal dialysis, and transplantation) to the survival of patients according to geographical region is also shown. Survival on renal replacement therapy, irrespective of treatment modality and of primary renal disease, was best in the 10-14-year-old patients, with 58% at 10 years and 52% at 15 years, and decreased with rising age to 28% at 10 years and 16% at 15 years in patients aged 45-54 when they commenced therapy in 1970-1974. When comparing the 0-4-year-old with the 10-14-year-old cohort of the paediatric patients, 5-year survival rates for patients starting renal
replace-Correspondence and offprint requests to: Prof. F. P. Brunner. European Dialysis and Transplant Association Registry. St Thomas' Hospital. London SE17EH.UK.
ment therapy in the early eighties declined from 85% to 70% with decreasing age.
Treatment policy, as reflected by the proportion of patients on different modes of therapy, varied markedly between European regions but affected survival to a small extent only. The large population with diabetic nephro-pathy incurred annual mortality rates 2-3 times greater than those observed in patients with 'standard' primary renal diseases. Haemodialysis and continuous peritoneal dialysis, although not comparable because of important differences in selection policy, yielded similar survival rates.
Patient and graft survival rates have improved markedly when comparing patients starting renal replace-ment therapy in the early seventies with the eighties; particularly for cadaveric transplantation. Patient sur-vival after second grafting was similar to that after first grafting, with 83% at 5 years after second cadaveric grafting in the 15-44-year-old cohort, vs 85% after first
110
cadaver transplantation in 1980-1984. Second cadaveric graft survival was superior to average first-graft survival for those recipients whose first graft had been functioning for more than 1 year. However, second-graft survival in rapid rejectors of a first graft as well as third cadaveric graft survival were curtailed by the large number of early losses, with only 52% of third grafts functioning at 1 year. For living related donor transplantation, parents were mostly used in children whilst identical siblings pre-dominated in adults older than 45. In the early eighties, patient survival was 92% at 5 years for recipients younger than 15. 87% for the 15-45 year old cohort and 72% for those aged 45 or older. From the overall survival rates on renal replacement therapy obtained at 5 years in the early eighties, it appears safe to predict that at least 65% of young adults and 25% of patients aged 55-64 will be surviving at 10 years after starting therapy.
Key words: EDTA Registry; Diabetic nephropathy; Graft
survival; Patient survival after renal transplantation; Regraft survival; Survival on CAPD; survival on haemo-dialysis; Survival on renal replacement therapy
Introduction
The EDTA Registration Committee has been asked by many members of EDTA-ERA to provide comprehensive survival data for patients on renal replacement therapy in Europe. Particular interest is anticipated, on the one hand for survival achieved in recent years, and on the other hand for long-term survival beyond 10 years. It seemed appropriate, therefore, to present survival data for patients starting treatment during the first 5 years of the last decade (1970-1974) and compare them to the cohort starting from 1980 to 1984. Factors that might affect survival such as age and primary renal disease are also taken into account. Finally, the contribution of different methods of treatment to the survival on renal replacement therapy is examined in relation to age of patients at start of treatment and its wide variation between geographical regions.
Methods
The methods of data collection used by the EDTA Registry have been described previously [1]. This report is based on data provided on individual patient question-naires and relates to treatment up to 31 December 1985. Patient and graft survival estimates were calculated using the actuarial method, and calculations to define the proportional contributions of the various treatment
modalities to renal replacement therapy and patient survival were carried out by the methodology developed by Dr. Neville Selwood and previously described [2].
Survival After First Renal Replacement Therapy
Survival on renal replacement therapy has improved markedly in one decade. This is readily apparent for all age groups up to 65 shown in Table 1 and to a lesser extent also for the group aged over 65 at start of treatment. However, the survival figures given in Table 1 for patients over 65 may not usefully be compared, as the large differ-ence in the numbers of patients in this group for the two periods studied was due to a substantial number of 70-80-year-olds beginning renal replacement therapy in 1980-1984. It is possible that the more liberal intake of older patients in recent years has also included an increas-ing number of high-risk candidates. It is no surprise that survival on renal replacement therapy still does not approach survival rates of the general population which, according to official statistics from many European countries, show an annual mortality of some 0.05% for children aged 5-14 years, of 0.1 %-0.2% for young adults aged between 15 and 45 years, of 0.3%-0.8% for the 45-54 age cohort and of 0.7%-1.0% for females and 1.5%-2.0% for males aged 55-64 [3].
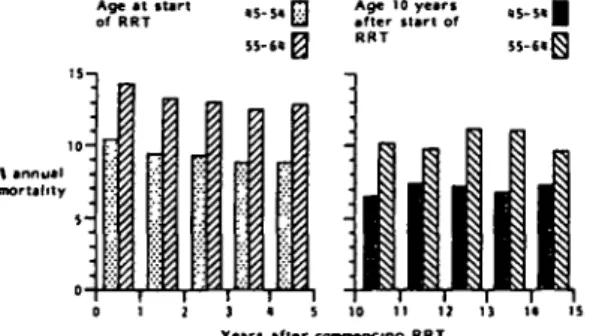
Annual mortality on renal replacement therapy decreased with length of time on therapy, which is demon-strated in a semilogarithmic plot (Fig. 1) by an upturn in the survival curves [4]. This was more apparent in the younger as compared to the older cohorts, and also in those starting treatment in the early seventies as compared to those starting in the early eighties. That annual mor-tality decreased with time on renal replacement therapy is also shown in Fig. 2 for the three large age cohorts starting treatment in 1970-1974. Annual mortality decreased from 13.5% during the first year of therapy to 2%-3% at 10-15 years in the 15-34-year-old cohort, from 16% to 5%-7.5% in those aged 35-44 at start of therapy, and from 17% to 10%-ll% in the 45-54-year-old group. Decreasing mortality with time is encouraging, since rising age is. in general, associated with a steady increase in mortality.
Most likely explanations for this finding include the more rapid drop-out of high-risk patients, such as young patients with diabetes mellitus, higher transplantation rates in the early years on renal replacement therapy with increased mortality in the first few months after trans-plantation, and improving quality of treatment in the course of the last 10-15 years. Figure 3 suggests that improving quality of renal replacement therapy is unlikely to be the sole explanation. This compares the interval mortality of two age cohorts. Those patients who com-menced renal replacement therapy in 1980-1984 (shown
Survival on Renal Replacement Therapy
Table 1. Patient survival after first renal replacement therapy, according to age at start of treatment. Results are given according to year of first renal
replacement therapy (RRT). Number of patients at risk at time zero (n) is shown. An asterisk (*) denotes less than 30 patients at risk Age at first RRT 0-4 5-9 10-14 15-34 35-44 45-54 55-64 £ 6 5
Year of first renal replacement therapy 1980-1984 n 297 676 1404 18 972 15048 21866 21885 16 562 % Survival l y r 86 91 96 93 91 90 86 78 2yr 80 87 91 88 84 81 74 61 3yr 75 85 89 85 79 74 65 49 4 y r 73 82 87 82 74 67 57 39 5yr 70 82 85 80 70 61 49 31 1970-1974 n 34 182 570 9404 7073 7 160 3 251 584 % Survival 2yr 59 70 80 78 73 71 64 56 4yr * 55 72 68 59 54 43 33 6 y r • 47 66 62 51 44 30 20 Syr • 44 61 58 45 35 21 12 10 yr * 43 58 54 41 28 14 7 12 yr • 41 57 51 35 23 10 * I5yr * * 52 48 28 16 • • 100J 0 • 0 7 0 6 0 5 0 -• • 0 -\ surviving J 0 1 0 1 0 -Age at first RRT 1*10-1. \ \
\ X
\\
V \ \ \ \ \ \ \ 1 1 i9>o-n s N \.5-5. \ \ \ \ \55-.. - 10 - M - 1 0 - 7 0 - 6 0 - 5 0 - . 0 - J O -20 - 1 0 Years after first RRTFig. 1. Patient survival after first renal replacement therapy according to age group and year at start of treatment.
\ annual |B. mortality
Illllr
Age group I S - J . Age group 1S-M• • • • • • • • • • • I
Ag« groupIllllllllllllll
S 10 IS Years after commencing RRTFig. 2. Annual mortality after first renal replacement therapy (RRT) 1970-1974. according to age group.
in the left panel) had higher annual mortality rates than their counterparts of the same age who had spent 10 additional years on treatment (right panel). Although interval mortality was decreasing less with time in the cohort commencing treatment in 1980-1984, it would seem safe to predict that survival at 10 years for patients who commenced renal replacement therapy in 1980-1984 would be going to exceed 72% (i.e. 85% of 85%, Table 1 and Fig. 1) for the paediatric cohort aged 10-14 years and 25% (i.e. 50% of 50%) for the 55-64-year-old cohort.
Age at start of RRT
.0
Age 10 years after start of RRT \ annual mortality 0 1 2 1 . 5 10 I I I I 11 I . 15 Years after commencing RRTFig. 3. Annual mortality on renal replacement therapy (RRT) 1980-1985. according to age group.
Survival on Renal Replacement Therapy in
Different Regions of Europe
In order to compare geographical differences in the approach to renal replacement therapy, six groups of countries were studied. The proportional use of different methods of therapy were similar within each of the groups. Comparison between these groups of countries should highlight different survival trends on the European scene. Patient survival figures computed for these geographical regions (Table 2) can be regarded as a summary of the results of national programmes. (National
Table 2. Patient survival after first renal replacement therapy (RRT), according to age at start of treatment in six regions of Europe Age at first RRT (years) Year of first i 1980-1984 n
renal replacement therapy
% Survival 1 yr 2 yr Latin (France. Italy. Portugal,
0-14 15-44 45-64 »65 867 10113 15 505 6 798 95 97 92 81 Spain) 91 93 84 64 3yr 89 91 76 52
Benelux (Belgium. Luxembourg, Netherlands) 0-14 15-44 45-64 5=65 149 1395 2 348 I 145 95 95 88 78 British Isles (United Kingdom.
0-14 15 44 45-64 » 65 359 3 649 3 830 609 93 94 84 69 91 92 79 63 Ireland) 91 89 73 53 Federal Republic of Germany. Austria
0-14 15-44 45-64 2s 65 285 5 072 8 886 3 877 Nordic (Denmark. Finland
0-14 15-44 45-64 2*65 93 1609 2 080 849 95 95 88 79 94 89 78 61 89 89 70
so
87 86 65 44 93 85 69 49 . Iceland. Norway. Sweden)93 88 79 66 90 81 67 48 88 76 56 35 4yr 87 88 70 41 87 86 62 38 85 83 57 33 92 82 61 40 85 72 50 28
Eastern (Bulgaria. Czechoslovakia. GDR. Hungary. Poland) 0- 14 15-44 45 64 2s 65 173 3 671 2 341 72 83 86 80 74 73 73 63 38 72 64 49 * 70 56 41 * 5yr 85 85 64 33 85 83 55 30 85 80 50 20 92 80 54 32 * 69 44 21 0 52 34 • 1970-1974 n 286 5510 3 672 272 65 1 143 911 40 144 2 473 956 7 134 3215 2 300 145 53 1078 1210 50 34 1262 408 1 % Survival 2yr 80 84 78 63 82 81 79 68 77 77 65 • 75 74 64 54 81 70 54 • • 45 40 • 4yr 71 74 60 38 80 72 60 * 62 65 ' 48 • 65 62 47 32 74 57 38 • * 29 19 • 6yr 64 68 48 23 75 64 47 * 57 58 38 * 60 55 36 19 70 51 27 * * 20 10 * Syr 60 63 39 16 75 60 36 * 51 53 30 • 55 50 28 * 64 47 22 • * 16 6 * 10 yr 58 59 31 * 75 55 26 * 47 49 23 * 52 46 21 • 62 44 17 * • 13 • •
Number of patients at time zero (n) is shown An asterisk (*) denotes less than 30 patients at risk
survival figures were given in the Combined Report on Regular Dialysis and Transplantation in Europe, XVI, 1985, which was provided for all the renal units supplying their patient data to the EDTA Registry.) Survival rates differed little between the Latin group of countries, where the proportional contribution of transplantation has been relatively small, and the Benelux countries and the British Isles where transplantation rates have been intermediate. Lower survival was obtained in the Nordic countries with their traditionally high transplantation rates. Eastern countries showed low survival rates and the contribution of transplantation was small.
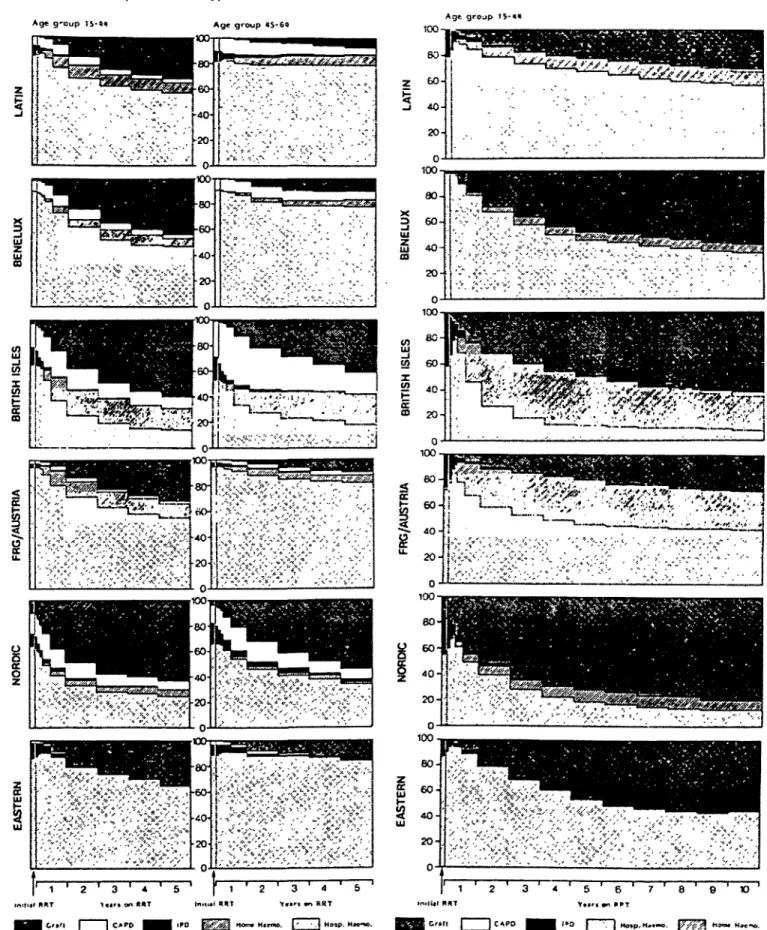
The proportional contribution of hospital (or centre) haemodialysis, home haemodialysis, intermittent perito-neal dialysis, continuous peritoperito-neal dialysis and trans-plantation to patient survival in the six geographical regions is shown in Fig. 4 for the two large cohorts aged
15-44 and 45-64 years at commencement of renal replace-ment therapy in 1980-1984, and in Fig. 5 for patients aged 15-44 years who commenced renal replacement therapy in 1970-1974. The contribution of transplantation was larger and that of hospital haemodialysis smaller in paediatric patients of all regions, whilst the opposite, a larger contribution of hospital haemodialysis and a smaller contribution of transplantation, was observed in the older age groups than are shown in Figs 4 and 5.
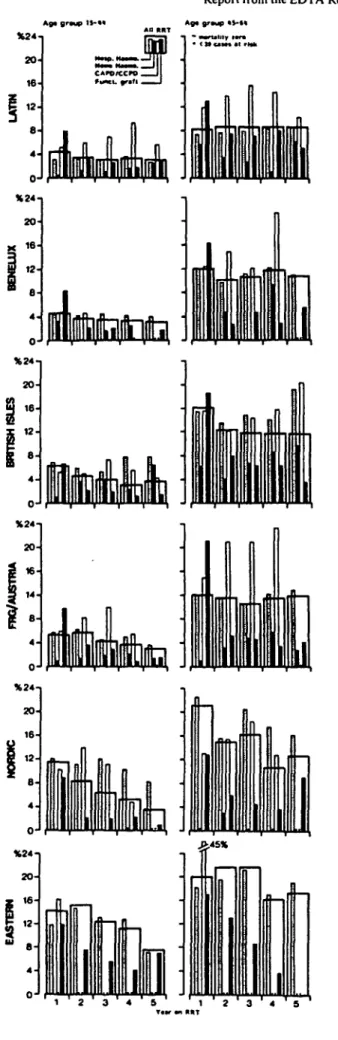
Figure 6 summarises interval mortality on all forms of treatment as well as separately on hospital haemodialysis, home haemodialysis, continuous peritoneal dialysis and with a functioninggraft (primary or regraft, and all sources of donor kidney) for patients commencing treatment in the six geographical regions in 1980-1984. There were clearly marked differences between geographical regions in annual death rates (i .e. the proportion of patients at risk in
Survival on Renal Replacement Therapy 113
Age g'oup li-ft* Age group I5-««
1 0 0 - . j
SSrA^aoJi-:
1
1 ' 2 ' 31 4 T 5 ' f t ' 2 ' 3 4 &
Fig. 4. Proportional contribution of different forms of renal replacemenl iherapy at intervals after the dale of staning renal replacement therapy in patients commencing treatment I9S0- f9S44. shown according to age group. Geographical regions are defined in Table 2.
Fig. 5. Proportional contribution ot'different forms of renal replacemenl therapy at intervals after the dale ofstaning renal replacemenl therapy in patienis commencing treatment 1970-1974. age group 15-44 years. Geographical regions are defined in Table 1.
Report from the EDTA Registry
any one year after start of renal replacement therapy who died) on specific treatment modalities. These differences appear to have resulted from differing treatment policies. The trend in the British Isles to move patients on to home haemodialysis might have generated a greater number of high-risk home-dialysis patients and thus perhaps explain the higher mortality rates in British patients as compared to residents of Latin countries. The high transplantation rates in Nordic countries can be assumed to have decreased rapidly the number of healthy long-term dialy-sis patients and generated a sizeable number of transplant failures who were at increased risk of dying whilst back on dialysis. The Nordic population on any form of dialysis during the third to fifth year of renal replacement therapy would thus in no way be comparable to the dialysis populations in the Federal Republic of Germany, Austria and the Latin countries.
In the course of the years, the annual death rates in patients on hospital haemodialysis changed little, and the variability in death rates on continuous peritoneal dialysis showed no regular trends. Death rates with a functioning graft were definitely at their peak during the first year of this therapy, when all grafted patients go through the early high-risk post-transplant period. Thereafter, during the second to fifth year of renal replacement therapy, death rates with a functioning graft were consistently low because patients going through the early post-transplant period after a first graft or regraft were outnumbered by far by recipients of a graft that had been functioning for a few months or longer. It should be kept in mind that complications acquired with a failing graft may ultimately cause death weeks or months later, which appear as deaths on dialysis in this type of analysis.
Survival According to Primary Renal Disease
Systemic diseases, including diabetic nephropathy, primary hypertension and malignancies which cause end-stage renal failure, increase the risk of dying in comparison to the common primary renal diseases [4-9]. Separate survival rates were, therefore, calculated for patients with so-called standard primary renal diseases (chronic renal failure of uncertain aetiology, chronic glomerulonephritis, chronic pyelonephritis/interstitial nephritis, toxic nephro-pathies, polycystic kidney diseases), for patients with diabetic nephropathy, and for those with all other diseases including lupus erythematosus, myeloma, renal vascular diseases, etc. Mortality was confirmed to be higher in patients with systemic diseases (Table 3). This was par-ticularly obvious in young patients with diabetes mellitus
Ag> gr*m> !»-•«
Fig. 6. Per cent mortality in each of the first 5 years of renal replacement therapy according to method of renal replacement therapy 1980-1985. shown according to age group. Geographical regions are defined in
Table 2. o
Table 3. Patient survival after first renal replacement therapy (RRT) 1980-1984 with standard primary renal disease (PRD) (which includes chronic renal failure aetiology uncertain, glomerulonephritis, pyelonephritis/ interstitial nephritis, nephropathy caused by drugs or toxic agents and cystic kidney diseases), with diabetic nephropathy and with other primary renal diseases
Age at RRT (years) 0-14 15-44 45-64 £ 6 5 Standard PRD n 1505 24 977 31027 11 141 % Survival 2yr 90 89 82 65 5yr 83 79 60 34 Diabetic nephropathy n * 2 678 3 739 1240 % Survival 2yr * 66 57 42 5yr * 44 25 13 Other PRD n 818 5 700 8344 3 526 % Survival 2yr 88 86 72 55 5yr 82 75 49 26 An asterisk (*) denotes less than 30 patients at risk
who succumbed at three times the rate of their counter-parts with standard primary renal diseases (Fig. 7).
From this analysis of survival according to primary renal disease emerges an explanation for the lower overall survival figures obtained in Nordic countries particularly in the 15-44-year-old cohort. There, only 53% of patients had standard primary renal diseases against almost 40% with diabetic nephropathy. As patient survival according to primary renal disease differed little between Western European regions both for standard primary renal disease and for diabetic nephropathy (Table 4), the lower overall survival results were mainly due to the high proportion of patients with diabetes mellitus among the uraemic population in Nordic countries.
Survival on Haemodialysis/Haemofiltration
In the section of the EDTA patient questionnaire which relates to treatment sequence and which is used for sur-vival calculations, no distinction has been made between various methods of extracorporeal blood purification. We know, however, that a minority of patients have under-gone haemofiltration, haemodiafiltration, or haemo-dialysis combined with haemoperfusion [10] and not infrequently have been changed from one of these methods to another. The majority have been treated with haemodialysis, which continues to be the most widely used mode of renal replacement therapy all over the world with the exception of the Nordic and British groups of countries, where the numbers of patients with functioning grafts exceed those on haemodialysis [10].
The figures presented in Table 5 show survival from the start of renal replacement therapy with haemodialysis/ haemofiltration. The end point of the calculation was either the date of death or the date of change to another treatment mode, i.e. peritoneal dialysis or transplan-tation. A change from centre to home haemodialysis/
% Annual mortality Age at first RRT 15- 34 35- 44 45-54 55-60 > 6 5 301 2 0 -30-1 2 0 - 40- 30- 20-
10-Standard Diabetic 5 year survival
standard diabetic 82% 75% s i t 371 6 6 * 271 54% 23% 34% 13% 1
Years after commencing RRT
Fig. 7. Per cent annual mortality of patients with standard primary renal diseases compared to diabetics, shown according to age at first renal replacement therapy (RRT). Percent survival at 5 years is given for each of these groups. Standard primary renal diseases are defined in Table 3.
haemofiltration was disregarded, since home treatment is not performed in some countries, and only available to a small group of more or less selected patients in many other countries. With the majority of patients with end-stage
Table 4. Patient survival after first renal replacement therapy in 1980-1984 for patients with standard primary renal diseases (PRD) and with diabetic
nephrnpathy. Results are shown according to geographical region Geographical region Latin Benelux FRG/Austria British Isles Nordic Eastern Standard PRD Age group 15-44 n 8617 1 190 4 225 2640 859 3 443 % Survival 2yr 95 95 92 93 93 74 5yr 89 88 84 84 85 54 45-64 n 11827 1729 7311 2 574 1472 2114 % Survival 2yr 87 85 82 77 74 65 Syr 69 64 60 56 52 36 Diabetic nephropathy Age group 15-44 n 634 147 567 346 617 138 % Survival 2 yr 5 yr 68 41 75 66 46 70 47 66 48 38 45-64 n 1423 208 1114 296 261 100 % Survival 2yr 63 52 57 57 45 30 5yr 30 * 24 * * *
An asterisk (*) denotes less than 30 patients at risk Standard primary renal diseases are defined in Table 3 Geographical regions are defined in Table 2
Table S. Patient survival on first haemodialysis (including home haemodialysis and haemofiltration) according to age at start of treatment. Results are given according to year of first renal replacement therapy (RRT)
Age at RRT (years) 0-14 15-34 35-44 45-54 55-64 £ 6 5 Year of first 1980-1984 n 1894 16 858 13 252 19 507 18919 13217 renal replacement % Survival l y r 95 94 92 91 88 81 2yr 91 89 86 83 77 65 therapy 3yr 89 85 80 76 69 53 4yr 86 82 75 70 60 43 5yr 82 80 71 63 53 35 1970-1974 n 733 9 060 6 843 6907 3 099 549 % Survival 2yr 79 81 77 75 68 59 4yr 73 72 64 59 46 35 6yr 65 66 56 47 32 21 8yr 62 62 49 38 23 12 10 yr 60 58 45 31 15 7 I2yr 59 55 39 25 10 * 15yr * 51 31 17 * *
Number of patients at risk at time zero (n) is shown. An asterisk (*) denotes less than 30 patients at risk
renal disease receiving treatment by haemodialysis, it is not surprising that survival figures for any age group and at any point in time closely resemble those obtained for all forms of renal replacement therapy combined, shown in Table 1.
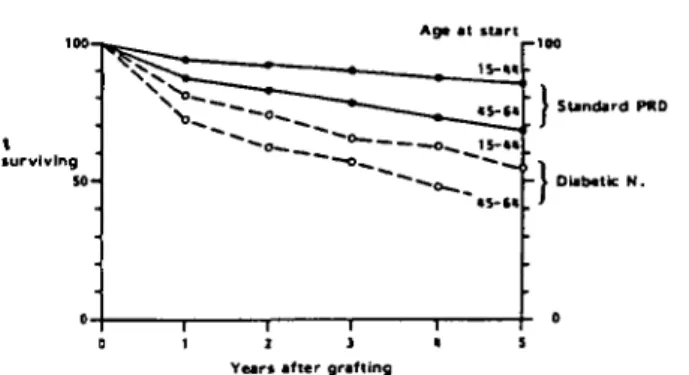
Figure 8 shows the lower survival rates on haemo-dialysis for patients with diabetic nephropathy as com-pared to patients with standard primary renal diseases. The difference in survival is entirely comparable to that shown for patients on renal replacement therapy in Fig. 7 or Table 3.
Lower survival rates resulting from higher annual mortality of 12.7% for 20-44-year-old and 34% in over 65-year-old patients on dialysis were reported from the United States for patients starting dialysis in 1977 [9]. Apart from the acceptance of more high-risk patients in the United States, this difference in the calculated survival
'Standard PRD
T u n «n ririt
Fig. 8. Patient survival on first haemodialysis 1980-1984. standard pri-mary renal diseases (PRD) compared to diabetic nephropathy. Standard primary renal diseases are defined in Table 3.
rates might be explained by the fact that patients who had received transplants were excluded from the analysis. This effectively removed from the analysis a part of the patient population, particularly in the younger age groups, which
Survival on Renal Replacement Therapy
was surviving at least up to the moment of transplan-tation. The number of patients surviving on dialysis was thereby reduced, whilst all the deaths on dialysis were included. The European survival rates for patients on haemodialysis should, therefore, not be weighed against these American figures.
Survival on Continuous Peritoneal Dialysis
(CAPD/CCPD)
Continuous peritoneal dialysis as a distinct entity was introduced as one of five methods of treatment on the EDTA Registry patient questionnaire in 1981. Accordingly, patient survival on continuous peritoneal dialysis is shown for patients starting treatment in 1981-1984 (Table 6). The survival rates do not differ appreciably from those obtained for patients on all forms of renal replacement therapy shown in Table 1. For several reasons these figures should not be compared to those of patients on haemodialysis. Selection of patients for either haemodialysis or CAPD is unlikely to have occurred in a randomised fashion. Local preference, availability of facilities, anticipated complications with vascular access, or diabetes mellitus may have determined whether a patient was started on CAPD rather than on haemodialy-sis. Conditions which might have been associated with definite differences in mortality were thus likely to show an uneven distribution between patients on CAPD as compared to haemodialysis. In fact, a much higher pro-portion of patients with diabetes mellitus was treated with CAPD. and the difference in survival on CAPD compared to that of patients with standard primary renal diseases (Fig. 9) was almost as striking as shown in Table 3 for any type of renal replacement therapy. Thus, taking primary renal disease into account, survival achieved by CAPD wascertainly no lower, and possibly even better, than with other modes of treatment.
Age at start r-IQ|
Table 6. Patient survival on first CAPD,CCPD. Results are shown according to age at start of renal replacement therapy in 1981-1984 Aeeat first RRT (years) 0-14 15-44 45-64 5 6 5 n 452 3082 5 399 2 403 % Survival lyr 95 94 87 77 2yr 90 88 74 57 3yr 90 82 63 42 4yr * 74 54 30 Y u r i on CAPO
An asterisk (*) denotes less than 30 patients at risk
Fig. 9. Patient survival on first CAPD 1981-1984, standard primary renal diseases (PRD) compared with diabetic nephropathy. Standard primary renal diseases are defined in Table 3.
Survival After Renal Transplantation
Patient and Graft Survival After First Cadaveric
Graft
The improvement in patient and graft survival rates between the early seventies and the eighties is particularly striking for cadaveric transplantation (Tables 7,8). This is not only due to the tremendous decline in the risk of dying during the early postoperative period, but also results from a lower interval mortality at any time after the first few post-transplant months a decade later. Figure 10 shows annual mortality after grafting, which was higher during the first year and then decreased to below 3% interval mortality in the 15-44-year-old recipients, and to some 6% in the 45-64-year-old cohort. This mortality involves all deaths, including also those occurring at any time after first graft failure. Taking all these deaths into account, patient survival rates in all age groups have, nevertheless, risen above those of the dialysis population as a whole. Several explanations are possible. Some lethal complications encountered in dialysed patients might no longer occur with a successful transplant, or transplan-tation might be performed in a physically fitter dialysis population that would have better survival despite trans-plantation. Whatever the explanation, it seems no longer true that the prospect of a better quality of life with a functioning transplant has to be balanced against a markedly increased risk of an early death after transplantation.
Two different ways of computing and depicting survival in transplantation are demonstrated in Fig. 11. The upper curve shows survival with a graft, i.e. only those deaths occurring whilst the graft was still functioning were con-sidered, and all patients who survived graft failure were treated as lost to follow-up at the moment when they moved to any other mode of renal replacement therapy (or were regrafted). Interval mortalities were lower using this method for computing survival, despite the fact that the number of patients at risk becomes smaller at each interval. However, increased mortality after graft failure or during the early post-transplant period of repeated
Table 7. Patient survival after cadaver first graft, shown according to age at grafting and year of grafting
Age at grafting (years)
Year of cadaver first graft
1980-1984 1970-1974 % Survival % Survival 0 - 4 15-44 45-64 » 6 5 911 12 794 6 161 173 l y r 93 93 86 78 2 y r 91 91 81 71 3yr 90 88 77 66 4yr 88 86 71 58 5yr 86 83 67 53 191 4 396 I 837 7 2yr 79 72 55 * 4 y r 71 64 45 * 6yr 64 58 37 * Syr 59 53 30 * 10 yr 57 49 24 * 12 yr 54 45 21 * 15 yr . . 39 15 *
An asterisk (*) denotes less than 30 patients at risk
Table 8. Survival of cadaver first grafts, shown according to age of recipient and year of grafting
Age at grafting
(years) 1980-1984
Year of cadaver first graft
1970-1974
% Graft survival % Graft survival
0-14 15-44 45-64 > 6 5 908 12761 6 150 173 l y r 69 69 67 63 2 y r 60 63 61 58 3yr 54 58 56 54 4yr 50 54 50 46 5yr 44 51 46 * 189 4 385 1837 7 2yr 56 47 39 * 4 y r 48 40 31 * 6yr 41 34 26 * Syr 35 31 22 • 10 yr 29 27 18 * 12yr 25 24 15 * 15yr * 20 11 #
An asterisk (*) denotes less than 30 patients at risk
Age at grafting 15-411
Yean after grafting
Fig. 10. Annual mortality after first cadaver graft 1980-1984. according
to age at grafting.
grafting is not considered. The survival curve, therefore, has a 'better' appearance. The EDTA Registry has usually shown survival after grafting by considering all deaths occurring at any time after the event of transplantation [11]. This is depicted by the lower curve in Fig. 11, and as
shown in this paper in all the Tables on patient survival after grafting.
The age dependence of survival on renal replacement therapy in general was also apparent in patient and graft survival for cadaveric transplantation performed in 1970-1974. A decade later, patient survival continued to be better in the younger compared to the older graft recipients, but the difference was less marked. Low mor-tality, particularly in cadaveric graft recipients older than 65 at grafting might be explained by more careful selection of low-risk candidates for transplantation in older patient groups. This may also explain why the impact of age on the first cadaveric graft survival was almost completely lost in 1980-1984. In contrast, more high-risk (including increasingly younger) paediatric patients have received grafts in more recent years. Graft survival has thus improved in all paediatric age groups, but the rising pro-portion of high-risk paediatric recipients aged 0-4 and 5-9 years (Fig. 12) has resulted in almost unchanged average graft survival rates for the paediatric population as a whole.
Patients with diabetic nephropathy had lower graft sur-vival as shown in Fig. 13. The obvious reason for lower
119
5 10 15 Years after grafting
Fig. II. Per cent patient survival, cadaver first graft 1970-1974 and age at grafting 15-44 years.
Standard PRD
0 1 1 J « 5 Years after grafting
Fig. 14. Per cent patient survival after first cadaver transplant 1980-1984 according to age at start of treatment, standard primary renal diseases (PRD) compared to diabetic nephropathy. Standard primary renal dis-eases are denned in Table 3.
Years after grafting
Fig. 12. Per cent cadaver first graft survival in paediatric patients 1980-19S4, according to recipient age at grafting.
I graft! surviving Age at grafting - \ Standard PRD Diabetic N. ) • 2 J Years after grafting
Fig. 13. Per cent first cadaver graft survival 1980-1984 according to recipient age al grafting, standard primary renal diseases (PRD) com-pared to diabetic nephropathy. Standard primary renal diseases are defined in Table 3.
graft survival was the markedly higher rate of death with a functioning graft which restricted survival at 5 years to 54% in the 15-44-year-old diabetic nephropathy recipients (Fig. 14).
Patient and Graff Survival After Living Related Donor First Transplantation
Tables 9 and 10 show results obtained in patients with living related donor first grafts. The exact genetic relation-ship was not recorded in the early seventies but, in 1980—
1984, the percentage of HLA-identical sibling grafts was 29%, of haploidentical sibling grafts 11 %, and of parental grafts 58% (Table 11). Non-identical sibling grafts were used rarely (1 %) and genetic relationship of sibling graft donor to recipient was recorded as unknown in 1% of cases. The great majority of paediatric recipients received parental grafts, whereas almost half of the recipients aged over 45 at grafting received identical sibling grafts. Both patient and graft survival rates were superior to those obtained in cadaveric transplantation and improved during the last decade. Graft survival of haploidentical sibling and parental grafts were similar and, as was to be expected, was inferior to the graft survival of identical sibling grafts (Fig. 15).
Regraft Survival
Selection of patients by age at regrafting can be problem-atical with the current analytical software available for the EDTA computer. For this reason, and in order to obtain a sample of patients comparable to recipients of first grafts, age groups for second cadaveric transplan-tation were formed by using the year of birth. Similarly to first transplantation, results of graft and patient survival after second cadaveric transplantation have markedly improved within the last decade. The living donor second graft survival rate was much better than that obtained for cadaveric second grafts and did not differ from the living donor first graft survival rate (Tables 12 and 13).
Second cadaveric graft survival for patients aged 15-44 years at regrafting was also computed according to the fate of the first graft. One group was selected because the first graft had been lost within 6 months due to rejection, the other group because of a first-graft survival of over one year. The difference in second cadaveric graft survival between these two groups is striking. In those patients whose first graft had been functioning for more than one year, second graft survival was superior even to average first graft survival (Fig. 16). As many as 9% of second grafts in patients who had rejected the first graft within 6
Report from the EDTA Registry
Table 9. Patient survival after live related donor first graft, shown according to age of recipient and year of grafting
Age at grafting (years) 0-14 15-44 >45
Year of live related donor first graft 1980-1984 n 268 1913 229 % Survival l y r 95 95 88 2yr 95 93 83 3yr 94 91 78 4yr 92 89 72 Syr 92 87 72 1970-1974 n 11 766 88 % Survival 2yr 92 85 81 4yr 82 78 64 6yr 75 72 62 Syr 71 68 53 10 yr 69 65 47 12 yr 69 62 45 15 yr • 56 • An asterisk (*) denotes less than 30 patients at risk
Table 10. Survival of live related donor first grafts according to age of recipient and year of grafting Age at
grafting (years)
Year of live related donor first graft
1980-1984 1970 1974
% Graft survival % Graft survival
0-14 15-44 5*45 268 1912 229 l y r 83 82 77 2 y r 78 77 72 3yr 71 74 67 4yr 63 70 62 5yr 61 66 60 77 766 85 2yr 74 70 66 4yr 58 63 56 6yr 44 56 55 8yr 39 52 46 10 yr * 49 39 12 yr • 43 * 15 yr * 37 * An asterisk (*) denotes less than 30 patients at risk
Table I I . Source of living related donor first graft 1980-1984
Age at grafting (years) 0-14 15-44 £ 4 5 All Percent Parent 94 58 20 58 Sibling ident 5 29 53 29 haplo 1 10 25 11 non/? 0 3 2 2
Ident = HLA identical sibling graft; haplo = haploidentical sibling graft: non/? = non-identical sibling graft, or genetic relationship of sibling graft donor to recipient recorded as unknown
Fig. 15. Per cent live related donor first graft survival 1980-1984 for sibling and parental grafts, recipient age at grafting 15-44 years.
months never functioned, and another 27% failed within 3 months. Thereafter, no difference could be detected in the interval graft failure rates of the two groups, which was also similar to the interval failure rate of first grafts. Rapid rejectors of a first graft thus appear to lose second or subsequent grafts at a much higher rate. This same reason may explain the restricted survival of third cada-veric grafts, which nevertheless has improved in recent years (Table 14). A sizeable proportion of third cadaveric grafts never functioned, i.e. 10% of third grafts as com-pared to 6% on average of second grafts and 3% of first grafts performed in 1980-1984. Only 58% of third grafts functioned up to three months, although interval graft failure rates thereafter did not appear to differ from those of first or second cadaveric grafts.
Conclusions
Despite differing treatment strategies, survival rates all over Europe were found to be similar. Transplantation has been used preferentially and for all age groups in Nordic countries, hospital or centre dialysis was the salient mode of treatment in Latin countries, and both home haemodialysis and CAPD were prominently applied in the British Isles. Survival rates improved between the seventies and the early eighties, and this was particularly
Table 12. Patient survival after second graft according to year of grafting. Results are shown separately for patients with cadaver grafts according to age at grafting and with living related donor grafts
Source _r second graft Cadaver Living donor Age at (years) 0-19 15-44 £ 4 5 All
Year of second grafting 1980-1984 n (Year of birth) 205 (£1965) 1 504 (1940-64) 458 (<1935) 139 (any) % Survival lyr 95 94 84 96 2yr 94 91 76 90 3yr 92 89 70 88 4yr 88 87 65 88 5yr * 85 61 * 1970-1974 n 37 518 152 25 (Year of birth) (£1955) (1930-54) (<1925) (any) % Survival lyr 81 77 63 2yr 78 71 49 3yr * 66 43 5yr 57 30 8yr 10 yr * * 49 45 20 •
An asterisk (•) denotes less than 30 patients at risk
Table 13. Survival of second grafts according to year of grafting. Results are shown separately for cadaver grafts according to age at grafting and for living related donor grafts
Source of second graft Cadaver Living donor Age at grafting (years) 0-19 15-44 £ 4 5 All
Year of second grafting 1980-1984 n (Year of birth) 205 (£1965) 1495 (1940-64) 457 ( < 1935) 139 (any) % Graft Survival l y r 68 65 54 82 2yr 62 59 46 76 3yr 51 54 41 75 4 yr 5 yr • * 50 47 37 • 75 * 1970-1974 n 37 516 152 25 (Year of birth) (£1955) (1930-54) (<1925) (any) % Graft Survival l y r 43 49 45 2yr 41 35 3yr 38 28 Syr 31 22 8yr 10 yr 24 20 14 *
An asterisk (•) denotes less than 30 patients at risk
t intervil failure
1 2 3 « 5 Yeari after second grafting
Fig. 16. Per cent second cadaver graft survival and interval failure 1980-1984. recipient age group 15-44 years and year of birth 1940-1964.
striking in transplantation. Some differences in patient survival between geographical regions might be attributed to differing treatment policies. The early post-transplant period still carries an increased risk of dying, although this has been reduced with grafts performed in recent years. The high rate of transplantation early in the course of renal replacement therapy in Nordic countries is, there-fore, associated with slightly lower survival of the uraemic population during the early phase of treatment. However,
the most important explanation for the higher overall mortality in Nordic as compared to Latin countries is given by the large proportion of Nordic patients with diabetic nephropathy who, particularly in the younger age groups, succumbed at a markedly higher rate than their non-diabetic counterparts.
Because of differing treatment policies or differing reasons for preferentially selecting one or another method of renal replacement therapy, one should not compare survival or mortality on different treatment modalities. All methods have their virtues and their disadvantages and may contribute equally to the survival of the uraemic population as demonstrated in the various tables shown in this paper.
Patients on renal replacement therapy are still far from approaching the survival rates of the general population which has a mortality of less than 1 % annually below the age of 65 in females and 55 in males. Nevertheless, survival rates have improved in the course of the last decade and can be expected to exceed 65% for young adults and 25% for patients aged 55-64 years at 10 years after starting renal replacement therapy in the early eighties.
Table 14. Survival of cadaver third grafts according to year of grafting Year of grafting
1980-1984 1970-1974
% Graft survival % Graft survival
l y r 285 52 2yr 47 3yr 39 4yr 35 5yr * 71 lyr 41 2yr * An asterisk (*) denotes less than 30 patients at risk
Acknowledgements. The EDTA Registry is supported by grants from Governments or National Societies of Nephrology. Grants were also made by Asahi Medical Co Ltd, B. Braun Melsungen AG, Bellco S.p.A., CD Medical International Ltd, Enka AG, Fresenius Ltd. Gambro AB, Hospal Ltd, Sandoz AG, Sorin Biomedica S.p.A. and Travenol Laboratories Ltd.
We gratefully acknowledge the assistance of Mrs Ann Kaniuk in the preparation of this paper, and we would like to thank all doctors and their staff who have completed questionnaires.
References
1. Demography of dialysis and transplantation in Europe, 1984. Report from the European Dialysis and Transplant Association Registry. Nephrol Dial Transplant 1986; 1:1-8
2. Kramer P, Broyer M, Brunner FP et al. Combined report on regular dialysis and transplantation in Europe, XIV, 1983. Proc Eur Dial Transplant Assoc-ERA 1985; 21: 2-68
3. WHO (1978), Demographic Year Book, Geneva
4. Wing AJ, Broyer M, Brunner FP et al. Combined report on regular
dialysis and transplantation in Europe. XIII. 1982. Proc Eur Dial Transplant Assoc-ERA 1983; 20: 2-75
5. Wing AJ, Brunner FP. Brynger H, Jacobs C, Kramer P. Compara-tive review between dialysis and transplantation. In Drukker W, Parsons FM, Maher JF, eds. Replacement of Renal Function by Dialysis. 2nd Edition, 1983:850-879. Martinus Nijhoff, Boston and the Hague
6. Kramer P, Broyer M, Brunner FP et al. Combined report on regular dialysis and transplantation in Europe, XII. 1981. Proc Eur Dial Transplant Assoc 1982; 19: 2-59
7. Jacobs C, Broyer M, Brunner FP et al. Combined report on regular dialysis and transplantation in Europe. XI, 1980. Proc Eur Dial
Transplant Assoc 1981; 18: 2-58
8. Brynger H, Brunner FP, Chantler C et al. Combined report on regular dialysis and transplantation in Europe, X, 1979. Proc Eur Dial Transplant Assoc 1980; 17: 2-86
9. Held PJ, Pauly MV, Diamond L. Survival analysis of patients undergoing dialysis. JAMA 1987; 257:645-650
10. EDTA Registry centre survey, 1985. Report from the European Dialysis and Transplant Association Registry. Nephrol Dial Transplant (in press)
11. Wing AJ. Survival on integrated therapies—what assumptions shall we make? Am J Kidney Dis 1984; 4: 224-232
Received for publication 11.9.87 Accepted 2.10.87