MRS Internet J. Nitride Semicond. Res. 3, 10 (1998). 1 © 1998-1999 The Materials Research Society
M R S
Internet
J
ournal
N
itride
S
emiconductor
R
esearch
Direct SIMS Determination of the In
xGa
1-xN Mole
Fraction
A. P. Kovarsky1, Yu. L. Kretser1, Yu A. Kudriavtsev1, D. N. Stroganov1, M. A. Yagovkina1, Tilman Beierlein 2 and S. Strite2
1Surface Diagnostics Lab., Mekhanobr-Analyt Co., 2IBM Research Division, Zurich Research Laboratory,
(Received Thursday, January 15, 1998; accepted Monday, July 27, 1998)
We demonstrate that our secondary mass ion spectroscopy (SIMS) method for the determination of the mole fraction in solid InxGa1-xN solutions is accurate and reproduceable without need of reference samples. The method is based on measuring relative current values of CsM+ (M=Ga, In) secondary ions. The claim of reliable SIMS determination without reference samples was confirmed by four independent analytical methods on the same samples with a relative error in the InN mole fraction determination below 15%.
1 Introduction
III-V nitride semiconductor heterostructures are useful for light-emitting devices, especially at shorter wave-lengths than are reachable with conventional compound semiconductors. The device properties depend critically on the metal cation composition of the emitting layer, i.e. generally the InxGa1-xN mole fraction [1]. The accurate determination of the alloy composition in InGaN solid solutions is a difficult but important task, especially in the presence of phase segregation effects.
Secondary ion mass spectrometry (SIMS) is a widely used method for the analysis of layer composi-tions in semiconductors and semiconductor devices [2]. SIMS is complementary to photoluminescence and x-ray diffraction for InGaN mole fraction determination because it measures an overall In/Ga ratio insensitive to phase segregation into In-rich and In-poor regions. However, the calibration of SIMS data for elements present in greater than 1 atomic percent (at. %) is com-plicated by non-linearities in the signal vs. at. % depen-dence in many experimental configurations. Furthermore, each SIMS measurement generally requires a standard of known and similar composition to the sample under interrogation to permit quantitative determination of elemental concentrations.
Here we show that a SIMS determination in InxGa
1-xN composition is accurate over a wide range of InN
mole fractions. The determination of this mole fraction can be done with relative intensities of the analytical
signals MCs+ of matrix cations, as has been shown by Gnaser [3] [4] who used molecular secondary ions to determine relative sensitivity factors (RSF) in the AlGaAs/GaAs system. Once the RSFs for a given appa-ratus are known over an appropriate alloy range, the SIMS process is calibrated and produces the alloy mole fraction. In our system, the In and Ga RSFs are equal and stable over time, permitting us to reproduceably determine the InxGa1-xN mole fraction to within a
rela-tive accuracy of 15% without the need of a reference layer. The SIMS data were verified by four independent measurement techniques.
2 Experimental
2.1 Samples
Four III-nitride thin film samples were studied. Two het-eroepitaxial GaN/SiC halide vapor phase epitaxy depos-ited samples were ion implanted with 100 keV and 200 keV In+ ions at doses of 1x10¹⁴ atoms/cm2 and 1x10¹⁵ atoms/cm2, respectively. In addition, two InxGa1-xN/ glass films (denoted as P1 and P2) deposited by plasma-enhanced molecular beam epitaxy (PEMBE) were stud-ied. The details of the PEMBE deposition of InGaN have been described elsewhere [5]. Sample P1 had an estimated InN mole fraction of 30% and thickness of 700±70 nm based on prior PEMBE flux calibrations. Sample P2 had an estimated InN mole fraction of 40% and thickness of 1000±100 nm based on the same cali-brations.
https://doi.org/10.1557/S109257830000082X
2 MRS Internet J. Nitride Semicond. Res. 3, 10 (1998). © 1998-1999 The Materials Research Society
2.2 SIMS
A CAMECA IMS4f SIMS instrument operating at a pressure of 2x10⁻⁹ mbar was used. A Cs+ primary beam focussed to a 70 µm diameter at a current of ~100 nA with an 5.5 keV impact energy scanned over an area of 250x250 µm2. Positive secondary ions of CsM+ (M = In,Ga) were accepted from circular area 60 µm in diam-eter by means of ion optical system. A mass resolution of M/∆M=300 and an energy window of 130 eV were used during data collection.
2.3 X-ray Diffraction
X-ray diffraction was performed using the Cu Kα line on a Geigerflex D/max.-RC diffraction system manufac-tured by Rigaku Corporation. The InN mole fraction was determined from Vegard's law.
2.4 Energy Dispersive X-ray Fluorescence Spectroscopy
Energy dispersive x-ray fluorescence (EDXRF) spec-troscopy of the Ga Kα and In Kα lines was carried out using a Spectrace 5000 instrument manufactured by Tracor Corporation. The calculation of the InN mole fraction in samples P1 and P2 was done using the stan-dardless variant of the fundamental parameters method. 2.5 Electron Probe Microanalysis
Electron probe microanalysis (EMPA) was performed using a CAMSCAN-4DV scanning electron microscope with an energy dispersive analyzer AN-10000 manufac-tured by Link Analytical Corporation. Energy dispersive analysis was employed for the In Lα, Ga Lα and Ga Kα lines. Systemic errors were avoided by analyzing the samples at 10 kV and 20 kV using two sets of standards: monocrystals of InP and GaP and thin films of InN and GaN. The InN mole fraction was determined by the intensity ratio of the standard samples versus P1 and P2. 2.6 Secondary Neutral Mass Spectrometry
Secondary neutral mass spectrometry (SNMS) measure-ments were performed using a Leybold-Heraeus INA-3 instrument. In this technique, sputtered neutral species from the thin film being interrogated are positively ion-ized in the same low pressure (4x10⁻³ mbar) rf Ar-plasma producing the sputtering ions. An Ar+ ion impact energy of 520 eV was chosen to permit the measurement of Ga and In signals at current densities ~10 mA/cm2 emanating from a sputtered field ~5 mm in diameter. A relative sensitivity factor (RSF) between In and Ga of RSFIn=0.9RSFGa was determined using pure InN and GaN films, and applied to determine the InN mole frac-tions of samples P1 and P2.
3 Results and Discussion
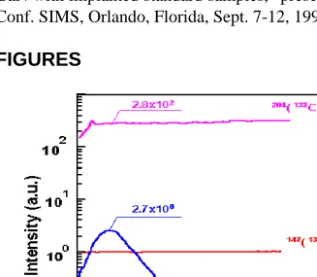
SIMS measurements performed on the In-implanted GaN samples confirmed that the CsIn+/CsGa+ signal intensity ratio is equal to the actual atomic concentration ratio of In in GaN at relatively low In concentrations. One SIMS measurement is shown in Figure 1. In these data, the CsN+ reference signal is normalized to unity, and the observed CsIn+ and CsGa+ count rates are plot-ted on this scale. For simplicity, the 71Ga signal having a relative abundance of 0.396 is plotted. The 69Ga data were parallel to the 71Ga data. Taking into account the observed CsIn+ and CsGa+ count rates and the 69Ga rel-ative abundance, we find that the ratio of In/Ga counts is: 2.7/(2.8x102÷0.396) = 0.0038. The InN concentra-tion at the maximum of the implantaconcentra-tion distribuconcentra-tion determined from the implantation dose is (1.8 + 0.1)×1020 at/cm-3. The accepted atomic density of Ga at GaN is 4.4×10²² at/cm-3. Hence, the mole fraction of In at maximum point of concentration is 0.004. The known In concentration from the implantation conditions is In0.004Ga0.996N. Therefore, the signal intensities
observed in our SIMS experiment provide us with a cal-ibration within 10% of the true In concentration in InGaN samples at low In content [6].
To determine if our technique extrapolates to higher InN mole fractions, we investigated the PEMBE sam-ples using SIMS, and then verified those measurements using four independent techniques. These results are shown in Table 1. The five independently measured val-ues shown permit us to determine the InN mole fraction to within P1=In0.30±0.04Ga0.70N and P2=In0.375±0.045Ga0.625N, which corresponds to an
absolute InN mole fraction measurement uncertainty of 12-13%.
Furthermore, the independent mole fraction mea-surements performed on P1 and P2 show a consistent trend. For example, x-ray and SIMS correspond closely. EDXRF and SNMS both measure several percent lower InN mole fraction and EMPA measures several percent higher InN content with respect to SIMS. These correla-tions suggest that given an expanded sample set which would provide us with improved statistics, the experi-mental uncertainty of the InN mole fraction determina-tion could be narrowed considerably from our present worst case relative mole fraction uncertainty of 13%. Furthermore, any one of these measurement techniques, depending on which is most convenient and reproduce-able, might be applicable towards the routine determina-tion of the InN mole fracdetermina-tion of InGaN, even in the abscence of a standard.
https://doi.org/10.1557/S109257830000082X
MRS Internet J. Nitride Semicond. Res. 3, 10 (1998). 3 © 1998-1999 The Materials Research Society
4 Conclusion
We have presented a SIMS-based method for the accu-rate determination of InN mole fraction in InGaN solid solutions without need of a reference sample, and veri-fied this claim by independent measurements of the InN mole fraction. The method is based on comparing the relative CsIn+/CsGa+ signal intensity ratios. Compari-sons with an ion implanted standard show that the SIMS signal intensity ratio reflects the actual In/Ga composi-tion of In-implanted GaN films to within 10%. The method was successfully extended to higher InN mole fraction alloys indicating that non-linear signal intensity effects are not present in our SIMS measurement. The SIMS data are sufficiently stable that we can reproduce-ably measure absolute InN mole fractions with a relative accuracy of 13% or below.
REFERENCES
[1] H. Morkoc, S. Strite, G. B. Gao, M. E. Lin, B. Sverdlov, M. Burns , J. Appl. Phys. 76, 1363-1398 (1994). [2] A. Benninghoven, F. G. Rudenauer, H. V. Werner, Secondary Ion Mass Spectrometry: Basic Concepts, Application and Trends, Wiley, New York (1987)
[3] H. Gnaser, J. Vac. Sci. Technol. A 12, p452-456 (1994). [4] H.Gnaser, “Quantification of SIMS depth profiling using MCs+ secondary ions”, in Proc. 10th Int. Conf. on SIMS, A. Beninghoven, B. Hagenhoff, H. W. Werner. Eds., J. Wiley & Sons, Chichester, pp.207-210 (1997)
[5] Tilman Beierlein , S. Strite, A. Dommann, D. J. Smith,
MRS Internet J. Nitride Semicond. Res. 2, 29 (1997). [6] A. P. Kovarsky, Yu. A. Kudriavtsev, V. S. Strykanov, M. P. Vatnik, "Quantitative in-depth SIMS analysis of impurities in
GaN with implanted standard samples," presented at 11th Intl. Conf. SIMS, Orlando, Florida, Sept. 7-12, 1997
FIGURES
TABLES
Figure 1. Depth profile In implanted in GaN with energy 200 keV and dose 1x1015 cm-2. The 147(133Cs14N)+ reference signal is normalized to unity.
Technique/Samples P1 P2 SIMS x=0.3 x=0.375 X-ray x=0.3 x=0.38 EDXRF x=0.275 x=0.345 EMPA x=0.35 x=0.42 SNMS x=0.26 x=0.33 https://doi.org/10.1557/S109257830000082X