ORIGINAL PAPER
Evaluation of an in-capillary approach for performing
quantitative cytochrome P450 activity studies
R. Curcio&R. Nicoli&S. Rudaz&J.-L. Veuthey
Received: 1 July 2010 / Revised: 25 August 2010 / Accepted: 29 August 2010 / Published online: 12 September 2010 # Springer-Verlag 2010
Abstract An automated in-capillary assay requiring very small quantities of reagents was developed for performing in vitro cytochrome P450 (CYP450) drug metabolism studies. The approach is based on the following: (i) hydrodynamic introduction of nanoliter volumes of sub-strate and enzyme solutions in the sandwich mode, within a capillary; (ii) mixing the reagents by diffusion across the interfaces between the injected solutions; (iii) collection of the capillary content at the end of the in-capillary assay; and (iv) off-line analysis of the incubation mixture by ultrahigh pressure liquid chromatography–tandem mass spectrometry (UHPLC-MS/MS). After optimizing the injection sequence of the reagents, the in-capillary approach was applied to the quantitative determination of the kinetics of drug metabo-lism reactions catalyzed by three CYP450 isozymes involved in human drug metabolism: CYP1A2, CYP2D6, and CYP3A4. It was demonstrated that this in-capillary method was able to provide similar kinetic parameters for CYP450 activity (e.g., Michaelis constants and turnover values) as the classical in vitro method, with a drastic reduction of reagent consumption.
Keywords Drug metabolism . Drug–drug interactions . CYP450 . In-capillary enzymatic assays . CYP450 kinetics
Introduction
Cytochrome P450 (CYP450) enzymes consist of a super-family of heme-containing proteins that generally catalyze the transfer of a single oxygen atom onto a xenobiotic or an endogenous substrate (e.g., steroids, fatty acids, and prostaglandins) with NADPH as the cofactor [1–3]. This monooxygenation reaction involves several steps and results in diverse chemical modifications of the substrates, such as C-atom hydroxylation, heteroatom oxygenation, and dealkylation [4, 5]. The CYP450-catalyzed modifications generally increase the polarity of xenobiotics, producing metabolites that are more amenable to excretion.
Hence, these enzymes are involved in human drug metabolism, accounting for as much as 75% of the biotransformation of marketed pharmaceuticals [2, 6]. In humans, CYP450-dependent drug metabolism is mainly mediated by five hepatic isozymes, namely CYP1A2, CYP2C9, CYP2C19, CYP2D6, and CYP3A4 [2]. The genetic polymorphism of some of these isoforms, e.g., CYP2D6, CYP2C9, and CYP2C19, together with other factors, such as age, gender, and nutritional habits, is at the origin of the observed strong variability in CYP450-mediated drug clearance [7]. Alteration of this enzymatic activity can also be the consequence of CYP450-based drug–drug interactions (DDI) [7, 8]. In this case, the metabolic rate of a drug is modified by the coadministration
R. Curcio
:
R. Nicoli:
S. Rudaz:
J.-L. Veuthey (*) Laboratory of Pharmaceutical Analytical Chemistry, School of Pharmaceutical Sciences, University of Geneva, University of Lausanne,Boulevard d’Yvoy 20, 1211 Geneva 4, Switzerland e-mail: jean-luc.veuthey@unige.ch Anal Bioanal Chem (2010) 398:2163–2171 DOI 10.1007/s00216-010-4175-9
of a second drug acting as a CYP450 isozyme(s) inhibitor or inducer. In addition, CYP450-catalyzed reactions can lead to the formation of pharmacologically active or toxic drug metabolites (e.g., the biotransformation of acetamin-ophen into N-acetyl-p-benzoquinone imine) [9].
As a result, knowledge about CYP450-mediated drug metabolism is of primary importance to the pharmaceutical industry, and the characterization of interactions between these enzymes and potential drug candidates is now a routine task in early drug discovery [10,11]. The purpose of these studies is to rapidly identify compounds with unfavorable metabolic properties, such as a high suscepti-bility to biotransformation (i.e., a low metabolic stasuscepti-bility) or with a high risk for CYP450-based DDI [10–12], reducing the risk of highly costly late-stage failures. For cost and time reasons, these early studies are generally carried out in vitro by incubating compounds of interest with human liver microsomes or recombinant expressed human CYP450 (rCYP450) isozymes [10, 13]. Although suitable for automation and for high-throughput studies using robotic systems, these enzymatic assays are commonly performed in relatively large incubation volumes (100μL or more) requiring large quantities of costly enzymes and candidate drugs. This is particularly disadvantageous if metabolic properties of numerous compounds have to be determined, as in the drug discovery phase.
Recently, a novel approach for performing qualitative in vitro CYP450-based drug metabolism and DDI studies in a fused silica capillary was presented [14]. As the volume of such a capillary was in the microliter range, only nanoliter volumes of reagents were required, allowing a drastic reduction of enzyme and compound consumption per assay compared to the classical approach (up to a factor of 100–500). The various solutions required for an enzymatic assay were introduced into the capillary as distinct plugs by hydrodynamic injection, i.e., by applying a positive pressure at the capillary inlet for a defined period of time. Thereafter, the enzymatic reaction took place within the capillary, the reagents encountering each other by diffusion across the parabolic interfaces between the plugs that result from their hydrodynamic injection. This type of mixing within a capillary is known as transverse diffusion of laminar flow profiles (TDLFP) [15,16]. Because diffusion is a fundamental property of all molecules [17], in-capillary assays with six major CYP450 isozymes and substrates were subsequently achieved by using the same generic procedure. Furthermore, in contrast to the electrophoretically mediated microanalysis technique [18–20] and other similar approaches used to perform enzymatic assays and analyte separation in a single capillary [21,22], this method was based on an off-line analysis of the incubation mixture. The decoupling of the in-capillary CYP450 assay from the analysis offered several advantages, such as the possibility of directly transferring the
experimental conditions from the classical in vitro assay (e.g., type, ionic strength, and pH of the incubation buffer) to the in-capillary approach, and rapidly analyzing the capillary content by ultrahigh pressure liquid chromatography–mass spectrometry (UHPLC-MS), a very suitable analytical technique for drug metabolism studies [23–25].
In this work, the development of the in-capillary approach focused on the quantitative determination of CYP450 kinetics of four well-known drug metabolism reactions, the CYP2D6-dependent O-demethylation of dextromethor-phan [26, 27] and tramadol [28], the CYP1A2-dependent deethylation of phenacetin [29], and the CYP3A4-dependent 1′-hydroxylation of midazolam [29,30]. The results of the in-capillary CYP450 activity studies, e.g., Michaelis con-stants and turnover values, were compared to those obtained with the conventional in vitro method.
Experimental
Chemicals and reagents
Human CYP450 Baculosomes Reagents were purchased from Invitrogen (Basel, Switzerland). β-Nicotinamide adenine dinucleotide 2′-phosphate reduced tetrasodium salt (NADPH), 4-(2-hydroxyethyl)piperazine-1-ethanesulfonic acid (HEPES), dextromethorphan hydrobromide, dextrorphan tartrate, phenacetin, acetaminophen, and ammonium hydrox-ide were obtained from Sigma-Aldrich (St-Louis, MO, USA). Tramadol and O-desmethyltramadol, as hydro-chloride salts, were a gift from Grünenthal (Stolberg, Germany). Midazolam was kindly donated by Dr. Y. Daali from the Division of Clinical Pharmacology and Toxicology at the Geneva University Hospitals. 1′-Hydroxymidazolam was purchased from Cerilliant (Round Rock, TX, USA). Methanol (MeOH), acetonitrile (ACN), and formic acid (99%) of UHPLC-MS grade were purchased from Biosolve (Valkenswaard, the Netherlands). Water was obtained from a Milli-Q Water Purification System (Millipore, Bedford, MA, USA).
Baculosomes stock solutions were stored at −80 °C. After initial thawing, small aliquots were prepared and refrozen to limit freezing/thawing cycles. Small aliquots of NADPH stock solutions at 50 mM were also prepared in water and stored at −80 °C. To reach suitable concen-trations for in-solution and in-capillary CYP450-based experiments, analyte stock solutions at 1 mg/mL in MeOH were appropriately diluted with 50 mM HEPES buffer solution. The latter (incubation buffer) was prepared by dissolving the appropriate amount of HEPES in water and adjusting pH to 7.4 with 1 M KOH in water. Ammonium formate buffer 10 mM was prepared by mixing the required volume of ammonium hydroxide with water and adjusting
the pH to 9.0 with formic acid. The pH of both buffer solutions was measured with a Metrohm pH meter (Herisau, Switzerland).
Classical in-solution CYP450 assays
Metabolite formation time course experiments
The classical in-solution CYP2D6-dependent dextrome-thorphan O-demethylation time course experiment (i.e., dextrorphan production as function of time) was performed in a final incubation volume of 150 μL. The rCYP2D6 stock solution (1.1 pmol/μL) was diluted eight times with the incubation buffer, i.e., 50 mM HEPES pH 7.4. Of this diluted enzyme solution, 7.5μL was taken and mixed with 61.5 μL incubation buffer and 75 μL of 100 μM dextro-methorphan solution to reach the final substrate concentra-tion of 50 μM (final CYP2D6 enzyme concentration 6.9 fmol/μL). After a pre-incubation of 5 min at room temperature, the enzymatic reaction was initiated by adding 6 μL NADPH 50 mM (final concentration 2.0 mM) and continued at 37 °C. Aliquots of 30μL were removed after 5, 10, 20, and 30 min and mixed with the same volume of ice-cold ACN to stop the reaction. After centrifugation (5 min at 10,000 rpm), 10μL of each supernatant was taken and mixed with 140μL of a water/ACN mixture (60:40 v/v) for injection (2μL) into the UHPLC-MS/MS system.
This procedure was then applied to dextromethorphan 0.5 μM and to other metabolite formation time course experiments, namely for CYP2D6-dependent O-demethylation of tramadol, CYP1A2-dependent deethylation of phenacetin (final CYP1A2 concentration 6.25 fmol/μL), and CYP3A4-dependent 1′-hydroxylation of midazolam (final CYP3A4 concentration 5.9 fmol/μL) at substrate concentrations of 5, 10, and 0.5μM, respectively. These additional assays were performed to determine the linear range of the four enzymatic reactions at the lowest substrate concentration employed in the classical and in-capillary enzyme kinetics studies and to choose the incubation time.
CYP450 enzyme kinetics studies
The same protocol was employed for the biotransforma-tions of dextromethorphan to dextrorphan and tramadol to O-desmethyltramadol catalyzed by CYP2D6, as well as for the conversion of phenacetin to acetaminophen and midazolam to 1′-hydroxymidazolam catalyzed by CYP1A2 and CYP3A4, respectively. The experiments were per-formed in a final volume of 100μL at increasing substrate concentrations: 0.25, 0.5, 1, 2, 5, 10, 25, 50 μM dextro-methorphan; 5, 10, 25, 50, 100, 200μM tramadol; 10, 20, 40, 60, 100, 150, 250μM phenacetin; and 0.5, 1, 2.5, 5, 10, 25, 50, 100μM midazolam. The corresponding rCYP450
isozyme stock solutions (CYP2D6, CYP1A2, and CYP3A4) were diluted eight times with the incubation buffer. Of these diluted enzyme solutions, 5μL was mixed with 41 μL incubation buffer and 50 μL of substrate solution at twice the concentration needed for the assay. After a pre-incubation of 5 min at room temperature, the enzymatic reactions were initiated by adding 4μL NADPH 50 mM (final concentration 2.0 mM) at 37 °C. Based on corresponding time course experiments (see above), the following incubation times were chosen: 5 min for CYP2D6/dextromethorphan and CYP3A4/midazolam, and 10 min for CYP2D6/tramadol and CYP1A2/phenacetin. The enzymatic reactions were then stopped by adding 100 μL of ice-cold ACN to the incubation mixtures. After centrifugation (5 min at 10,000 rpm), 10 μL of each supernatant was taken and mixed with 140 μL of a water/ ACN mixture (60:40 v/v) for injection (2 μL) into the UHPLC-MS/MS system.
In-capillary CYP450 assays
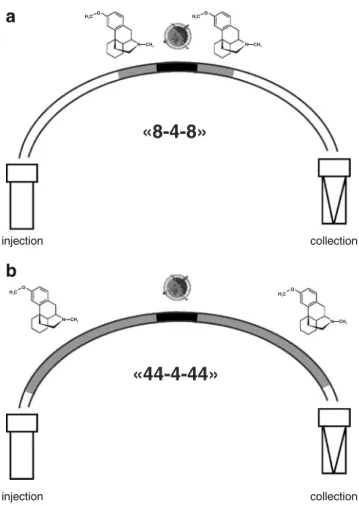
All experiments were performed in a fused-silica capillary of 1.4-μL volume (75-μm I.D., 32.5-cm length) coated with polyvinyl alcohol to reduce adsorption on the capillary wall [31, 32]. CYP2D6, CYP1A2, and CYP3A4 Baculosomes stock solutions were diluted six times with incubation buffer to obtain a final protein concentration of about 0.17 pmol/μL. NADPH was contained in the substrate(s) solution employed in the various assays at a concentration of about 2.0 mM. An HP3D capillary electrophoresis (CE) system (Agilent, Waldbronn, Germany) was employed to automate liquid handling and to thermoregulate the capillary at 37 °C. The first step consisted of rinsing the capillary with the incubation buffer by applying a pressure of 1 bar for 0.5 min. Thereafter, the required CYP450 enzyme and substrate solutions were injected into the capillary in a substrate-enzyme-substrate sequence, apply-ing a positive pressure of 50 mbar. To introduce substrate plugs of approximately 8% or 44% of the capillary length, this pressure was applied for 6 s (Fig.1a) or 33 s (Fig.1b), respectively, whereas 3 s was used to inject the enzyme plug (approximately 4% of the capillary length). In the case of substrate plugs of 8% capillary length (Fig. 1a), incubation buffer solution was injected (50 mbar for 30 s) to place the previously injected enzyme and substrates plugs in the central part of the capillary and ensure temperature control during the incubation by the CE instrument’s air-streaming system. The incubation time was chosen according to the experiment of interest (see below), and during this step, empty vials were placed at both extremities of the capillary. At the end of the chosen reaction time, the capillary was flushed with water (1 bar for 0.5 min) that, together with the reaction mixture, was
led into a vial containing 30μL of a water/ACN mixture (1:1 v/v) to stop the enzymatic reaction. The solution contained in this vial, 40μL in total, was directly injected (2 μL) into the UHPLC-MS/MS system for substrate and metabolite analysis.
This procedure was applied to perform the same assays as with the classical in-solution approach described above. For the CYP2D6-dependent dextromethorphan O-desmethylation time course experiment, in-capillary assays were performed for an incubation time of 5, 10, 20, and 30 min at a dextromethorphan concentration of 50 μM. For enzyme kinetics studies of CYP2D6-dependent O-desmethylation of dextromethorphan and tramadol, CYP1A2-dependent deethylation of phenacetin, and CYP3A4-dependent 1′-hydroxylation of midazolam, the same substrate concentrations and incubation times were used as with the conventional approach.
Since the in-capillary assays were performed in a consecutive manner with a CE instrument, the CYP450 assays were singularly carried out for each substrate concentration on the same day. As a consequence, the
kinetic parameter’s uncertainty was estimated from the regression error with the most appropriate enzyme kinetic model.
UHPLC-MS/MS analysis
Off-line analysis was achieved with an ACQUITY UPLC hyphenated to a triple quadrupole (TQD) MS/MS system (Waters, Milford, MA, USA) operated in the selected reaction monitoring (SRM) mode. The UPLC can withstand up to 1,000 bar and includes a binary solvent manager, a sample manager equipped with an injection loop volume of 2μL (full loop injection), and a column oven set at 40 °C. Data acquisition, data handling, and instrument control were performed by the Masslynx v 4.1. software (Waters, Milford, MA, USA). Analytes were separated in gradient mode (A: 10 mM ammonium formate pH 9.0; B: MeOH, 5 to 95% B in 1 min, hold at 95% B to 1.3 min, then column reconditioning at 5% B to 2 min) at 0.5 mL/min and the first 0.5 min was diverted to the waste. The column was a Waters ACQUITY UPLC BEH RP18(50 mm × 2.1-mm I.D., 1.7μm). Extra-column volume of the UPLC-MS/MS configuration was experimentally estimated at about 22μL and dwell volume at 100μL with the 2-μL injection loop [33]. For optimizing MS conditions and MS/MS analyte transitions, standard solutions of each compound at 1μg/mL in ACN/water 1:1 (v/v) were infused into the MS system at a flow rate of 10 μL/min. Optimal parameters and MS/MS transitions are summarized in Table1. MS/MS experiments were performed in positive ion mode under constant electrospray conditions. The capillary and the source extractor voltages were set at 3.5 kV and 2 V, respectively. The source temperature was maintained at 140 °C, the desolvation gas temperature and flow rate at 450 °C and 800 L/h, respectively, and the cone gas flow rate at 50 L/h. Analytes were monitored with a 50-ms dwell time for each MS/MS transition. Initial experiments were performed for evaluation of the response function in the range of 10 to 250 nM. Because the MS response followed a linear relationship without any significant intercept, an external calibration with one concentration level at 35 nM was selected. Another solution at the same concentration was employed as quality control and was regularly injected along with the analysis sequences of incubation mixtures to check the response of the detector.
Prism v. 4.0 (GraphPad Software, San Diego, CA, USA) was employed to determine the most appropriate enzyme kinetics model and the corresponding kinetic parameters (e.g., Michaelis constants and turnover values) for the four CYP450-catalyzed probe substrate biotransformations. The turnover, expressed in picomole of product per minute per picomole of CYP450, was calculated from the produced metabolite quantities (produced in-capillary or with the
H3C O H3C O H3C O N CH3 N CH3 N CH3
«8-4-8»
«44-4-44»
H3C O N CH3 injection collection injection collectiona
b
Fig. 1 a 8-4-8 and b 44-4-44 injection setups used for in-capillary CYP450 assays. Configurations refer to percentage of capillary length of substrate and enzyme plugs injected in the sandwich mode into the capillary. For detailed assays conditions, see text
classical approach), the employed enzyme quantities, and the incubation times. The presented 95% confidence intervals of the kinetic parameters result from the determi-nation of the regression error between experimental data and the most appropriate enzyme kinetics model.
Results and discussion
Qualitative studies with six CYP450 isozymes as well as CYP2D6 inhibition experiments were performed as a proof-of-concept of the in-capillary method and described elsewhere [14]. In all in-capillary assays, substrates and CYP450 enzyme solutions were injected within the capillary as short plugs of equal length in the sandwich mode, without any further optimization of the method. The efficacy of this injection mode compared to the injection of a single substrate and an enzyme plug has already been demonstrated in the literature for other in-capillary enzymatic assays [17].
In this paper, the performance of the in-capillary method in providing quantitative results on CYP450 activity was determined. For this purpose, some modifications of the injection sequence were evaluated for the kinetics of well-known drug metabolism reactions catalyzed by three CYP450 isozymes (CYP1A2, CYP2D6, and CYP3A4). Optimization of operating parameters can include the following: (i) length of the injected plugs, (ii) applied pressure, and (iii) initial concentration of the injected enzyme solution, i.e., dilution of the enzyme stock solution. Initial experiments were performed by diluting the enzyme stock solution six times with incubation buffer to decrease its viscosity and increasing diffusion of substrate molecules into the enzyme-containing zone.
Although the enzyme concentration was not uniform along the capillary [15, 16], this dilution was chosen to obtain average in-capillary enzyme concentrations similar to those used for classical in-solution assays performed within an incubation volume of 100 or 150μL (see Sect. “Classical in-solution CYP450 assays”). The injection
pressure was maintained at 50 mbar, the maximum programmable value on the commercial CE instrument, allowing the introduction of small enzyme plugs of 8 or 4% of the capillary length.
Thus, only the length of the substrate and enzyme plugs was varied, and its effect was evaluated on the kinetics of CYP2D6-catalyzed biotransformation of dextromethorphan into dextrorphan. Firstly, preliminary experiments at low dextromethorphan concentration (i.e., 1 μM) were carried out to evaluate the appropriate CYP450 amount for quantitative in-capillary assays by varying the length of the enzyme plug from 2 to 8% of the capillary length. Assays performed with the 8% enzyme plug did not double the initial rate of product formation as in the case of 2% and 4% enzyme plugs (data not shown), but resulted in a lower activity than expected, suggesting that mixing with the substrate was partially achieved with this configuration. Further experiments evaluating the modification of the substrate plug length were thus performed with the enzyme plug kept at 4% of the capillary length.
Effect of injection setup on in-capillary enzymatic activity Time course experiments performed at saturating enzyme conditions represent a suitable strategy for determining CYP450 turnover values for a given substrate. This can be achieved independently of chosen incubation times by determining slopes of the linear relationship between incubation times and obtained metabolite amounts. Thus, to study the effect of the length of the injected substrate plugs on enzymatic activity within the capillary, CYP2D6-catalyzed biotransformation of dextromethorphan into dextrorphan was determined as a function of time. All these time course experiments were performed at a dextro-methorphan concentration of 50 μM and results were compared to those obtained in-solution.
The starting point for in-capillary assays was an injection sequence, henceforth referred to as 8-4-8 method (Fig.1a), which consisted of the introduction of substrate plugs of 8% of the capillary length around the enzyme plug of 4% in
Table 1 MS and MS/MS parameters used for the analysis of the CYP450-mediated selected biotransformations
CYP450 Compounds SRM transition (m/z) Cone voltage (V) Collision energy (eV)
CYP1A2 Phenacetin 180Y110 25 15
Acetaminophen 152Y110 30 13
CYP2D6 Dextromethorphan 272Y171 50 39
Dextrorphan 258Y157 50 37
CYP2D6 Tramadol 264Y58 30 17
O-Desmethyltramadol (M1) 250Y58 25 15
CYP3A4 Midazolam 326Y291 46 28
the sandwich mode followed by a long plug of incubation buffer solution (approximately 40% of the capillary length). Injection of the latter was required to position the injected enzyme and substrate plugs in the central part of the capillary that was correctly thermoregulated at 37 °C by the air-streaming of the CE instrument. Application of this configuration to the O-demethylation of dextromethorphan by CYP2D6 resulted in a dextrorphan formation time course significantly different from the reference one (Fig. 2). Taking into account incubation time points from 5 to 20 min, in-capillary turnover with the 8-4-8 setup (3.9 pmol/min/pmol) was only 50% of the corresponding reference value (7.9 pmol/min/pmol). Thus, although the substrate injected into the capillary had the same concen-tration as in classical in-solution assay, the kinetics obtained with the 8-4-8 in-capillary setup was representative of a far more diluted substrate solution. As a matter of fact, injection of incubation buffer after introduction of reagents plugs improved their mixing within the capillary but also diluted them [17]. In contrast, when the capillary was almost completely filled with the substrate solution around the central enzyme zone, a significant improvement of the kinetics of dextrorphan formation was observed. In fact, by injecting substrate plugs of 44% of the capillary length (henceforth referred to as the 44-4-44 setup, see Fig.1b), the initial rate of the in-capillary CYP2D6-catalyzed biotransformation of dextromethorphan matched the refer-ence value. Good correspondrefer-ence in terms of turnover values was therefore obtained between in-capillary (8.0 pmol/min/pmol) assays with the 44-4-44 setup and the classical in-solution approach (7.9 pmol/min/pmol). Thus, although this injection setup consumed approximately 5.5 times more substrate solution than the 8-4-8 setup, the in-capillary CYP450 kinetics studies presented below were performed with the 44-4-44 configuration.
In-capillary and in-solution CYP450 kinetics studies Preliminary biotransformation time course experiments were initially performed with the classical in-solution approach to determine the suitable incubation time for the four selected probe substrate biotransformations, O-demethylations of dextromethorphan to dextrorphan and tramadol to O-demetyltramadol catalyzed by CYP2D6, deethylation of phenacetin to acetaminophen catalyzed by CYP1A2, and hydroxylation of midazolam to 1′-hydroxymidazolam catalyzed by CYP3A4 (Table 1). These assays were carried out at the lowest probe substrate concentration used for subsequent kinetics studies. The chosen incubation times (5 min for dextromethorphan and midazolam and 10 min for phenacetin and tramadol) were within the determined linear ranges of preliminary metabolite formation time course experiments.
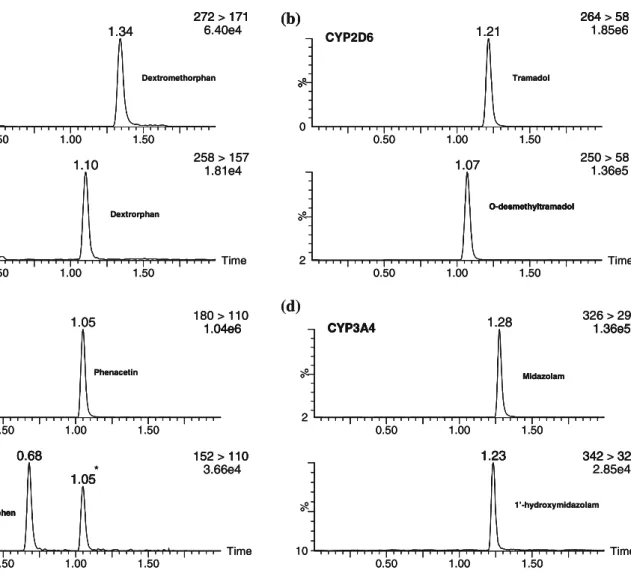
The in-capillary approach with the 44-4-44 injection setup was then applied to determine kinetics of four selected biotransformations. To this end, the initial metab-olite formation rates were assessed at increasing substrate concentrations and the results compared to those obtained with classical experiments. The conditions used for the latter, in particular probe substrate concentrations and incubation times, were directly transferred to the in-capillary approach. As already described, analysis of substrates and metabolites obtained from both approaches was performed off-line by UHPLC-MS/MS. Figure3 shows typical chromatograms obtained for the four studied CYP450 biotransformations using the in-capillary method.
The most appropriate enzyme kinetics model and the corresponding kinetic parameters (e.g., Michaelis constants and turnover values) for the four CYP450/substrate pairs were determined from the amounts of metabolites pro-duced. As reported in Fig. 4, the four CYP450 kinetics determined by the 44-4-44 in-capillary procedure showed a similar profile as those obtained in-solution. All studied biotransformations followed Michaelis–Menten kinetics except hydroxylation of midazolam catalyzed by CYP3A4. For the latter, a substrate inhibition kinetics was found in agreement with the literature [34, 35], resulting in a decrease of midazolam hydroxylation rates at high substrate concentrations. In all four cases, Michaelis constants and turnover values determined with the in-capillary approach by simply transferring experimental conditions from clas-sical assays were very close to those of the clasclas-sical method. No significant difference was observed in terms of Michaelis constants if taking into account 95% confidence intervals resulting from the determination of the regression error between experimental data and the most appropriate enzyme kinetics model. A good agreement was also found for turnover values between the two approaches, particularly for dextromethorphan/CYP2D6 and midazolam/CYP3A4 0 50 100 150 200 250 300 350 0 5 10 15 20 25 30 Time (min)
Pmol dextrorphan / pmol 2D6
«8-4-8» «44-4-44»
«in solution»
Fig. 2 Dextrorphan formation time course experiments performed with classical in-solution approach (continuous black line), 8-4-8 (grey line), 44-4-44 (black dotted line) in-capillary setups. Assays were carried out at a dextromethorphan concentration of 50 μM, corresponding to CYP2D6 saturating conditions
biotransformations (see Table2). Concerning estimation of the latter parameter, it should be noted that estimation of maximum velocities with the in-capillary method strongly depends on accurate determination of the incubation time (enzymatic reaction started before the complete injection of the reactants sequence, i.e., with the injection of the enzyme plug). This is particularly important when performing studies using single time points for the incubations at a given substrate concentration (e.g., Michaelis–Menten kinetics studies). Thus, for more accurate determination of turnover values, time course experiments (i.e., metabolite production as a function of time) at saturating concentrations of substrate have to be preferentially selected (see Sect.“Effect of injection setup on in-capillary enzymatic activity”).
Finally, the in-capillary determination of Michaelis constants was rapid, generic, and cost-effective, and this
method could be applied to a huge number of compounds, e.g., in the drug discovery process.
Conclusion
An attractive method for performing in-capillary CYP450 activity assays was presented. Nanoliter volumes of enzyme and substrate solutions were injected into the capillary as distinct plugs by hydrodynamic injection. This method is generic because, after introducing reagents in the sandwich mode, mixing within the capillary is achieved by TDLFP. This approach was evaluated by providing in vitro quantitative CYP450 enzyme kinetics data for four probe substrate biotransformations, namely CYP2D6-catalyzed O-demethylations of dextromethorphan to dextrorphan
264 > 58 272 > 171
(a)
272 > 171272 > 171(b)
264 > 58264 > 58(a)
(b)
1.21 1.34 264 58 1.85e6 272 171 6.40e4 CYP2D6 CYP2D6(a)
(b)
1.21 1.34 264 58 1.85e6 272 171 6.40e4 CYP2D6 1.34 CYP2D6 1.21 264 58 1.85e6 272 171 6.40e4 CYP2D6 CYP2D6(a)
(b)
% % Dextromethorphan % Tramadol % Dextromethorphan % Tramadol % Dextromethorphan % Tramadol % % % % % 0.50 1.00 1.50 0 0.50 1.00 1.50 3 0.50 1.00 1.50 0 0.50 1.00 1.50 3 0.50 1.00 1.50 0 0.50 1.00 1.50 3 1.07 1.10 258 > 1571.81e4 1.07 250 > 581.36e5 1.10 258 > 1571.81e4 1.07 250 > 581.36e5 1.10 258 > 1571.81e4 250 > 581.36e5 O desmethyltramadol O desmethyltramadol O desmethyltramadol % % O-desmethyltramadol Dextrorphan % % O-desmethyltramadol Dextrorphan % % O-desmethyltramadol Dextrorphan Time 2 Time 11 Time 2 Time 11 Time 2 Time 11 0.50 1.00 1.50 0.50 1.00 1.50 0.50 1.00 1.50 0.50 1.00 1.50 0.50 1.00 1.50 0.50 1.00 1.50 1.28 100 1.05 326 > 291 1 36e5 180 > 110 1 04e6 CYP1A2 CYP3A4(c)
(d)
1.28 100 1.05 326 > 291 1 36e5 180 > 110 1 04e6 CYP1A2 CYP3A4 1.28 100 1.05 326 > 291 1 36e5 180 > 110 1 04e6 CYP1A2 CYP3A4(c)
(d)
100 CYP1A2 1.04e6 CYP3A4 1.36e5
100 CYP1A2 1.04e6 CYP3A4 1.36e5
100 CYP1A2 1.04e6 CYP3A4 1.36e5
% % Phenacetin % Midazolam % Phenacetin % Midazolam % Phenacetin Midazolam 2 0 2 0 2 0 0.50 1.00 1.50 1 23 0.50 1.00 1.50 0 68 152 110 342 324 0.50 1.00 1.50 1 23 0.50 1.00 1.50 0 68 152 110 342 324 0.50 1.00 1.50 1 23 0.50 1.00 1.50 0 68 152 110 1.23 342 324 100 0.68 1.05 342 > 324 2.85e4 152 > 110 3.66e4 * 1.23 100 0.68 1.05 342 > 324 2.85e4 152 > 110 3.66e4 * 1.23 100 0.68 1.05 342 > 324 2.85e4 152 > 110 3.66e4 * % % 1.05 1’-hydroxymidazolam Acetaminophen % % 1.05 1’-hydroxymidazolam Acetaminophen % % 1.05 1’-hydroxymidazolam Acetaminophen Acetaminophen Acetaminophen Acetaminophen Time 0.50 1.00 1.50 10 Time 0.50 1.00 1.50 0 Time 0.50 1.00 1.50 10 Time 0.50 1.00 1.50 0 Time 0.50 1.00 1.50 10 Time 0.50 1.00 1.50 0
Fig. 3 Examples of SRM chromatograms corresponding to selected CYP450-mediated biotransformations: a dextromethorphan O-desmethylation by CYP2D6; b tramadol O-desmethylation by CYP2D6, c phenacetin O-deethylation by CYP1A2, and d midazolam 1′-hydroxylation by CYP3A4. Chromatograms correspond to in-capillary incubations with the 44-4-44 injection setup at substrate
concentrations close to the obtained Michaelis constant values, i.e., 1 μM for dextromethorphan, 25 μM for tramadol, 40 μM for phenacetin, and 2.5 μM for midazolam. The peak highlighted with an asterisk resulted from an in-source MS fragmentation of phenacetin in conditions used for the analysis
and tramadol to O-desmethyltramadol, CYP1A2-catalyzed deethylation of phenacetin to acetaminophen, and CYP3A4-catalyzed hydroxylation of midazolam to 1′-hydroxymidazolam. The substrate plug length had a strong influence on metabolite production for dextromethorphan O-demethylation. The results obtained by using the 8-4-8 injection setup were not in agreement with those obtained classically because substrate dilution occurred within the capillary. This was shown to significantly decrease the rate of dextromethorphan O-demethylation compared to the classical in-solution experiment. Substrate plugs were then increased to 44% of the capillary length (44-4-44 injection setup), avoiding in-capillary substrate dilution, and almost identical CYP450 kinetic profiles as with the classical
in-solution approach were obtained for the four selected CYP450/substrate pairs. With single incubation time points at a given substrate concentration, it was thus possible to determine kinetic parameters (e.g., Michaelis constants and turnover values) with the in-capillary method, which were very close to the reference values. This was particularly true for relative kinetic parameters, such as the Michaelis constant. Determination of absolute parameters, e.g., the turnover, is also possible, as shown for the initial rate of dextrorphan production catalyzed by CYP2D6. In this case, assays have to be preferentially performed at different incubation time points. Finally, to increase productivity of CYP450 assays, a multi-capillary system is under construction to perform twelve experiments in parallel.
(a) (b) 12 30 10 2D 6) D6 ) 8 mo l 2 20 mo l 2 D 6 mi n /p m min /p m 4 mo l/ m 10 mo l/ m 2 v ( p m v ( p m 0 10 20 30 40 50 0 0 50 100 150 200 0 v 0 10 20 30 40 50 [Dextromethorphan] (µM) 0 50 100 150 200 [Tramadol] (µM) [ ] (µ ) (c) (d) 40 12 30 1A 2) 10 3A 4) 30 pm ol 8 pm ol 20 mi n /p 6 min /p 10 pm ol /m 4 pm ol /m 10 v ( p 2 v ( p 0 50 100 150 200 250 0 0 25 50 75 100 0 0 50 100 150 200 250 [Phenacetin] (µM) 0 25 50 75 100 [Midazolam] (µM)
Fig. 4 Enzyme kinetics plots for selected CYP450-mediated biotransformations obtained with the 44-4-44 in-capillary setup (dotted line) and the classical approach (continuous line): a dextromethorphan O-desmethylation by CYP2D6; b tramadol O-demethylation by CYP2D6, c phenacetin O-deethylation by CYP1A2, and d midazolam 1′-hydroxylation by CYP3A4. A Michaelis–Menten kinetics resulted for all biotransformations, except for the conversion of midazolam into 1′-hydroxymidazolam catalyzed by CY3A4 (substrate inhibition kinetics)
Table 2 Enzyme kinetic models and corresponding kinetic parameters for the four selected CYP450-mediated biotransformations obtained with the 44-4-44 in-capillary setup and the classical approach
CYP450 Substrate Kinetic model KM(μM) Turnover (pmol/min/pmol) Ki(μM) r2
CYP1A2 Phenacetin Michaelis–Menten In-solution 51.0±5.0 39.0±1.3 – 1
In-capillary 47.0±5.5 35.2±1.4 1
CYP2D6 Dextromethorphan Michaelis–Menten In-solution 0.6±0.2 8.1±0.4 – 0.99
In-capillary 0.7±0.1 8.3±0.4 0.99
CYP2D6 Tramadol Michaelis–Menten In-solution 26.2±10.1 19.9±2.4 – 0.99
In-capillary 26.0±3.7 30.0±1.3 1
CYP3A4 Midazolam Substrate inhibitiona In-solution 2.9±1.5 13.8±3.3 53.8±31.2 0.9820 In-capillary 3.2±1.3 12.5±2.3 87.1±45.4 0.99
a
References
1. Ortiz de Montellano PR (1995) Cytochrome P450: structure, mechanism, and biochemistry, 2nd edn. Plenum, New York 2. Guengerich FP (2008) Chem Res Toxicol 21:70–83 3. Nebert DW, Russell DW (2002) Lancet 360:1155–1162 4. Guengerich FP (2001) Chem Res Toxicol 14:611–650
5. Isin EM, Guengerich FP (2007) Biochim Biophys Acta 1770:314–329
6. Venkatakrishnan K, von Moltke LL, Greenblatt DJ (2001) J Clin Pharmacol 41:1149–1179
7. Glue P, Clement RP (1999) Cell Mol Neurobiol 19:309–323 8. Lynch T, Price A (2007) Am Fam Physician 76:391–396 9. James LP, Mayeux PR, Hinson JA (2003) Drug Metab Dispos
31:1499–1506
10. Baranczewski P, Stanczak A, Sundberg K, Svensson R, Wallin A, Jansson J, Garberg P, Postlind H (2006) Pharmacol Rep 58:453– 472
11. Li AP (2001) Drug Discov Today 6:357–366
12. Riley RJ, Grime K (2004) Drug Discov Today Technol 1:365–372 13. Plant N (2004) Drug Discov Today 9:328–336
14. Nicoli R, Curcio R, Rudaz S, Veuthey JL (2009) J Med Chem 52:2192–2195
15. Okhonin V, Liu X, Krylov SN (2005) Anal Chem 77:5925–5929 16. Okhonin V, Wong E, Krylov SN (2008) Anal Chem 80:7482–7486 17. Krylova SM, Okhonin V, Krylov SN (2009) J Sep Sci 32:742–756 18. Zhang J, Hoogmartens J, Van Schepdael A (2008) Electrophoresis
29:3694–3700
19. Novakova S, Van Dick S, Van Schepdael A, Hoogmartens J, Glatz Z (2004) J Chromatogr A 1032:173–184
20. Glatz Z (2006) J Chromatogr B 841:23–37
21. Krylova SM, Okhonin V, Evenhuis CJ, Krylov SN (2009) Trends Anal Chem 28:987–1010
22. Wong E, Okhonin V, Berezovski MV, Nozaki T, Waldmann H, Alexandrov K, Krylov SN (2008) J Am Chem Soc 130:11862– 11863
23. Rainville PD, Wheaton JP, Alden PG, Plumb RS (2008) Rapid Commun Mass Spectrom 22:1345–1350
24. Plumb RS, Potts WB III, Rainville PD, Alden PG, Shave DH, Baynham G, Mazzeo JR (2008) Rapid Commun Mass Spectrom 22:2139–2152
25. Yu K, Di L, Kerns E, Li SQ, Alden P, Plumb RS (2007) Rapid Commun Mass Spectrom 21:893–902
26. Yu A, Haining RL (2001) Drug Metab Dispos 29:1514–1520 27. Yu A, Dong H, Lang D, Haining RL (2001) Drug Metab Dispos
29:1362–1365
28. Subrahmanyam V, Renwick AB, Walters DG, Young PJ, Price RJ, Tonelli AP, Lake BG (2001) Drug Metab Dispos 29:1146–1155 29. Testino SA, Patonay G (2003) J Pharm Biomed Anal 30:1459–
1467
30. Patki KC, von Moltke LL, Greenblatt DJ (2003) Drug Metab Dispos 31:938–944
31. Le Potier I, Taverna M, Fattal E, Benzaki J, Chevalier M, Ferrier D (2001) Chromatographia 53:563–570
32. Lucy CA, MacDonald AM, Gulcev MD (2008) J Chromatogr A 1184:81–105
33. Schappler J, Nicoli R, Nguyen D, Rudaz S, Veuthey JL, Guillarme D (2009) Talanta 78:377–387
34. Christensen H, Mathiesen L, Postvoll LW, Winther B, Molden E (2009) Drug Metab Pharmacokinet 24:261–268