HAL Id: hal-02764013
https://hal.inrae.fr/hal-02764013
Submitted on 4 Jun 2020HAL is a multi-disciplinary open access archive for the deposit and dissemination of sci-entific research documents, whether they are pub-lished or not. The documents may come from teaching and research institutions in France or abroad, or from public or private research centers.
L’archive ouverte pluridisciplinaire HAL, est destinée au dépôt et à la diffusion de documents scientifiques de niveau recherche, publiés ou non, émanant des établissements d’enseignement et de recherche français ou étrangers, des laboratoires publics ou privés.
The crop growth monitoring at a regional scale based on
the combination of remote sensing and process-based
models
Sophie Moulin, M. Launay, Martine Guerif
To cite this version:
Sophie Moulin, M. Launay, Martine Guerif. The crop growth monitoring at a regional scale based on the combination of remote sensing and process-based models. Crop monitoring and prediction at regional scales, Feb 2001, Tsukuba, Japan. �hal-02764013�
The crop growth monitoring at a regional scale based on the combination of remote
sensing and process-based models
Moulin, S., Launay, M., Guérif, M. INRA Unité Climat, Sol et Environnement Site Agroparc - 84914 Avignon Cedex 09 – France
Tel : +33-4 32 72 24 13 Fax : +33-4 32 72 23 62 e-mail : sophie.moulin@avignon.inra.fr
ABSTRACT
Two approaches can be distinguished for crop production forecasting : statistical methods, which are site-specific and can hardly allow to assess exceptional events, and crop growth models which allow dynamic diagnostic and prognostic. However, the use of process models at regional scale is limited by the lack of spatialized information on model parameters. Here, we propose an approach where remote sensing information is used to calibrate a crop growth model for regional application topics. As an illustration, we present a study performed over a sugar beet factory basin where the most variable in space within crop parameters are those related to the crop implantation at the beginning of the crop life, and those related to roots behavior during water stress episodes. In this study, not only the spatial variability of the crop growth parameters, but also that of the radiative transfer model parameters, was taken into account. High spatial resolution airborne and SPOT data were used to calibrate the crop model for each field of the region. Then the crop model was used to predict the sugar production on a number of fields representative of the basin. Both parameters estimates and final sugar production estimates were consistent with validation ground measurements.
1. INTRODUCTION
Regional forecast of crop production is of major interest. As satellite remote sensing supplies observations over large areas at even times, they may be helpful for the crop monitoring at regional scale. In particular, spatial variations of the environmental conditions, which influence crop growth and development, could be accounted for, without tedious ground field surveys. Currently, most of the operational applications are based on a descriptive analysis (see Allen, 1990; Meyer-Roux and King, 1992; Genovese, 1997). To estimate yields at a regional scale, quantitative analysis requires more complex methodologies, such as the coupling of satellite data with crop production models, as first suggested by Wiegand et al. (1986).
Remote sensing information can be used to monitor crop growth in many ways, from empirical to mechanistic approaches (see Moulin et al., 1998). The observed radiometric signal can be related to various canopy state variables through radiative transfer models or empirical relationships. Those canopy variables appear in some physiological functions, when integrated in time, they lead to the final yield determination. In particular, the reflectances acquired in the solar spectrum are related to the photosynthetically absorbed radiation and the leaf area index (Asrar et al., 1984). When reflectances are combined into vegetation indices and cumulated along the growing season, a correlation with the production is obtained (Tucker et al., 1981). However, due to the empirical nature of those relations, they only have local validity.
The knowledge of mechanisms such as the absorption of the photosynthetically active energy, its conversion into biomass and the allocation in plant organs is necessary. Kumar and Monteith (1981) proposed a method to combine radiometric measurements with the Monteith’s efficiency model (1977). Here the radiometric data, used as model input, gives a diagnosis concerning the canopy status and activity, the model therefore provides a dry
matter production estimation. This diagnostic model is rather simple to use but does not describe the growth and development processes. Such a description is available through agrometeorological mechanistic models.
Crop growth models (Whisler et al., 1986) are designed to describe the time course of the main crop state variables (leaf area index, organs biomass, phenological development…) and of energy and matter fluxes (carbon, water, nutrient) at the soil-plant-atmosphere interface. The simulation is computed depending on soil and climate conditions, and on farming practices usually defined at field scale. Crop mechanistic models give both diagnostic on crop status, and prognostic. But despite the mechanistic formalism, some processes like the allocation of daily assimilates in the different organs are described through empirical relationships. Therefore, inaccuracy in the coefficients may lead to important errors on the biomass production estimation (Porter, 1984). As introduced by Wiegand et al., 1986, the remote sensing measurements can be combined to agrometeorological models to correct the model simulations. Several methods were developed to correct the crop state variables estimations or adjust some unknown model parameters, by using the remote sensing signal dynamics along the crop cycle.
The monitoring of crop growth at regional scale using crop growth models, is hampered by the difficulty of obtaining information about local conditions or crop characteristics. Particularly, weather and soil conditions may vary a lot, as well as the characteristics depending on farmers cultural operations. Remote sensing, which gives extensive spatial information on the real crop growth status, is a practical way of estimating this spatially distributed information and make the spatial application of the model possible. One of the methods (Bouman et
al., 1990, Guérif and Duke, 1998) consists in assimilating remote sensing data into the crop model, providing a
local adjustment of the crop model. We show through a case study how such a method can be used on a sugar factory area to estimate sugar beet yields using a crop model and remote sensing data (optical domain).
2. A CASE STUDY
The objective was to evaluate the relevance of a method consisting in evaluating crop parameters and yield in virtual regional conditions where neither the initial condition (sowing date) nor some important crop parameters (crop establishment characteristics) are known (Guérif et al., 2000). First, the variability of emergence and early growth conditions at regional scale and its consequences on yield is illustrated. Then, the methodology of model adjustment developed on a local scale is described. A section is devoted to the sensitivity of the recalibration method to errors in radiative transfer model estimates. Finally, the possibility of application of the method on a larger scale was evaluated.
2.1. Variations in crop model parameters at regional scale
Farmers have tended to sow sugar beet earlier each spring during the past decade, in order to maximize the potential growth of the crop and the final root dry mass. These early sowing dates, when possible, raised the probability of more difficult conditions during the sowing-emergence phase which delays emergence (the temperature sum required for emergence may rise from 100°C day to 180°C day, base 0°C), decrease the proportion of plants which can emerge (50% emergence rates compared to normal rates of 95%) and therefore result in fewer and smaller plants at emergence (Boiffin et al., 1992). In the SUCROS model for sugar beet (Spitters et al., 1989), these characteristics of crop establishment are key parameters of the module for emergence and early growth (SEMERG, the thermal time from sowing to emergence, NPL the number of plants emerged, and LA0 the initial leaf area per plant at emergence (the product of NPL by LA0 being the initial LAI,
LAIinit). We have shown (Dürr et al, 1999) that the variation in emergence and early growth parameters could
explain up to 20% in yield variation. Moreover, sowing dates which is an initial condition of the model, may be highly variable according to weather conditions and farmers agenda; this variability increases the variability of yield results. We performed measurements (Fig. 1) that illustrate the variability of initial conditions, parameters and yields on sugar factory areas.
Figure 1. Variations in sowing dates, crop establishment characteristics (number of plants emerged per m2 and thermal time
from sowing to emergence (°C.days, base 3°C), and yields over 50 fields in 2 sugar factory areas .
Moreover, water stress may also have very heterogeneous effects on yield elaboration during drought summers, according to the structural and textural soil properties. This can be taken into account in the new version of the SUCROS model by the crop/soil water balance parameters (van Laar et al., 1992).
2.2. Crop model recalibration using assimilation of remote sensing data
The method was tested first on a local scale. SUCROS-sugar beet model was coupled to the SAIL radiative transfer model (Verhoef, 1984) by means of the LAI variable (Fig. 2). The models were calibrated to be adapted to the regional context in a previous phase, using experimental data obtained for a crop grown in optimal conditions (Duke, 1997). The method was tested on a different set of experimental data, for which crop establishment was intentionally disturbed (SEMERG increased and LAIinit reduced). The default values for the parameters were used in the SUCROS+SAIL model to simulate the spectral reflectance in 3 bands (green 500-590 nm; red 620-680 nm; near-infrared 790-890 nm), which was compared to four measurements made with a Cimel hand-held radiometer during crop establishment. Minimization of a criterion based on the differences between simulated and measured reflectance using an optimization software (Stol et al., 1992), enabled the method to re-estimate properly the emergence and early growth parameters as well as the crop yield of the test crop (Guérif and Duke, 1998).
Figure 2. Flowchart showing the assimilation of remote sensing data into the crop model.
Transposition of this method to large spatial domains adds new difficulties : (i) determining SAIL parameters, which depend on plant and soil characteristics other than LAI (canopy geometry, leaf optical properties, and soil reflectance) and may vary considerably from one place to another ; (ii) estimating for each field not only the emergence results but also the sowing date.
0 0,1 0,2 0,3 0,4 30 40 50 60 70 80
Roots fresh mass (tons/ha)
0 0,2 0,4 0,6 60 90 130 170 Sowing-emergence duration (°C.d) 0 0,2 0,4 21/03 04/04 18/04 02/05 Sowing dates 0 0,2 0,4 6 8 10 12 14 Number of plants per m2
2.3. Sensitivity of crop model recalibration to errors in SAIL parameters estimates
We proposed a method for estimating SAIL parameters that uses beforehand knowledge on crops and soils (Duke and Guérif, 1998):
- soil reflectance is derived from pre-established response curves to soil type (as given by soil maps) and humidity (as given by weather in the previous days).
- canopy geometry and leaf optical properties are derived from the age of the crop, as given by LAI.
We showed (Duke and Guérif, 1998) that this way of estimating SAIL parameters allowed to reduce greatly the errors made on reflectance estimates in the process of assimilation, as compared to the usual approaches with standard values.
Figure 3. Estimated LAI time changes and final root dry mass as resulting of the 250 processes of reflectance assimilation into SUCROS+SAIL model for a medium sowing date, poor emergence results, using 2 options for estimating SAIL parameters. The solid line on LAI graphs represents the real LAI changes with time, the dotted lines the simulated one. The vertical arrow on root dry mass graphs represents the « real » value of yield. RRMSE values are reported.
This reduction of errors on reflectance estimates reduced the errors in crop model recalibration. Fig. 3 shows the results of 250 processes of assimilation into the crop model of 5 reflectance data during crop establishment period, for one situation of medium sowing date and poor emergence results. We used a Monte Carlo type method where the “real” SAIL parameters were drawn from realistic distributions of values established by the beforehand measurements and the estimated values either by the cited method (option 2) or by standard values (option 1) (Guérif et al., 2000) : simulation of LAI and final roots dry mass are much better with option 2, and confirms the interest of bringing beforehand knowledge on soils and crops in the methodology of crop model recalibration.
Table 1. Comparison of 250 assimilation processes results on root dry mass (RDM), LAI, sowing date (SWD) and emergence parameters (SEMERG, LAIinit) estimates for a medium sowing date, good emergence results. RMSE or RRMSE* are given.
Spectral reflectance TSAVI
RDM* 0.022 0.008
LAI* 0.11 0.04
SWD 9.4 4.9
SEMERG 12.2 7.2
LAIinit* 0.28 0.11
The results of the method were greatly improved by using no longer the spectral reflectance variable, but a combination of them into a vegetation index, TSAVI (Baret and Guyot, 1991) which allowed to minimize the weight of remaining errors on canopy reflectance estimates. Not only the estimates of final root dry mass and LAI time change were improved, but also the estimates of sowing date and emergence parameters (Tab.1): the
RRMSE=0.43 RRMSE=0.29
assimilation method makes it possible to retrieve not only accurate values of some variables simulated by the model (yield, LAI,…) but also of unknown values of model parameters or initial conditions.
2.4. Validating the method at a regional scale
A large experiment was designed in 1995 to allow the validation of the method in farmer’s conditions. Two sugar factories were involved, providing each one 25 fields having experienced different sowing and emergence conditions, on many different soil textures (water storage from 0.5 m to 3.5 m in root zone). Measurements of emergence results were done and the root yield was precisely recorded at harvest (cf Fig. 1). Five remote sensing data were acquired during the canopy establishment period by airborne measurements (the 20th and the 28th of
June) and SPOT data (the 5th of May, the 24th of July and the 3rd of August). These data were geo-referenced, and
converted into soil surface reflectance by using a model of radiative transfer in the atmosphere (Launay et al., in press). The detailed soil map of the region and the field boundaries were superimposed to these images in order to extract for each field, the different functional soil units.
In order to take into account the water stress effects occurring during the summer, we used a modified version of SUCROS, simulating the effects of drought of leaf death rate and on redistribution of assimilates. A first step consisted in combining this model with the SAIL model and simulating vegetation index TSAVI change with time, using the recorded data of sowing date and emergence results, and the estimated SAIL parameters from soil map, weather conditions and LAI. This step allowed selecting the fields for which such a combined model was able to correctly represent crop growth and spectral signature. Different assimilation strategies have then been tested on a 9 field representative sample chosen inside this database (Launay and Guérif, 2001). We present here the results obtained with one of those strategies, re-estimating two crop establishment parameters of the SUCROS model (SEMERG and LAIinit) and two crop/soil water balance parameters (EZRTC and ZRTMC) and assuming that the sowing date is known (Tab.2). Range of those parameters have been determined from surveys and experiments in our area of interest.
Table 2. List of parameters to be re-estimated at regional scale.
Parameter Unit Meaning Default value Range
Crop
establishment SEMERG °C.j sowing to emergenceThermal time from 120 60, 170 LAIinit (NPL*LA0) m²/m² Initial leaf area index 0.00098 0.00024, 0.00378 Crop/soil
water balance
EZRTC mm.d-1 Constant for root
elongation
0.012 0.008, 0.016
ZRTMC m Maximum rooted depth 1.8 0.6, 1.8
Simulated yield / Observed yield (default parameter values)
40 50 60 70 80 90 100 40 50 60 70 80 90 100
fresh yield (t/ha)
fr es h y ie ld (t /h a ) 3 13 8 18 27 1 4 25 20
Simulated yield / Observed yield (re-estimated parameter values)
40 50 60 70 80 90 100 40 50 60 70 80 90 100
fresh yield (t/ha)
fr es h y ie ld (t /h a) 1 20 27 18 25 13 3 8 4
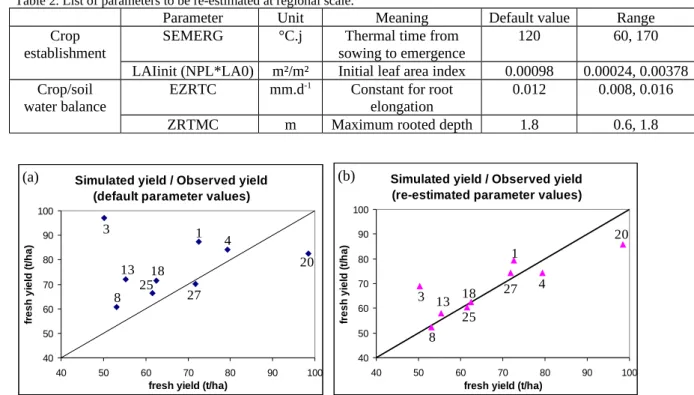
Figure 4. Simulated yields compared to observed yields on 9 fields (a) by the SUCROS model with default parameter values (b) by the SUCROS model with re-estimated parameter values.
The assimilation results on those 9 fields are presented on Figure 4. The simulated yields before assimilation (with default parameter values, Fig. 4a) and the ones after assimilation (with re-estimated parameter values, Fig 4b.) are compared to the measured yields.
By re-estimating those 4 parameter values, the yield Relative Root Mean Square Error has been reduced from 27.7% to 12.1% and the correlation between simulated and observed yields increased from 0.23 to 0.84. For the field 3 the assimilation method do not success in reducing enough the TSAVI curve as it is shown on Figure 5a. In fact, on this field the chalk is 0.3 m deep and the crop establishment is very long (around 200°C.j between sowing and emergence). The range given for the SEMERG and the ZRTMC parameters are not wide enough to reach those values, and then the SEMERG re-estimated value is 169°C.j and the ZRTMC re-estimated value is 0.61 m. For the other fields the assimilation method allow to predict satisfying yields through a good minimization of TSAVI error as it is shown for the field 4 on Figure 5b.
Figure 5. Simulated TSAVI by the SUCROS/SAIL model before and after assimilation compared to the observed TSAVI on remote sensing data (a) for the field 3 and (b) for the field 4.
The results yet obtained suggest that the method proposed have great potential for enabling crop model use everywhere spatial variations are involved. It may be applied in regional scale applications like yield prediction as presented here, or for precision agriculture, for adapting the cultural practices to within-field variability. The model, spatially updated thanks to remote sensing data assimilation, allows to make a diagnosis on crop status and to provide recommendations for a spatially variable application of cultural practices.
3. CONCLUSION
As shown through this example, remote sensing techniques represent an opportunity to upscale the crop model from field to regional scale. In particular, since the radiometric signal in the short wavelength range can be related to the canopy structure of the crop, the linkage of the crop model with a radiative transfer model round this canopy structure variable leads to the radiometric signal simulation. Conversely, one can utilize the radiometric signal to calibrate the crop growth model by minimizing the difference between simulated and observed reflectances with an optimization process. In this approach, the minimization is performed by tuning some unknown field-specific parameters.
The strategy of model calibration using remote sensing information is of great interest for regional production purpose through the local estimation of parameters. This approach can also be extended to some related topics like precision farming were a spatially accurate knowledge of some parameters is required.
However, some limitations of this method are related to the use of remotely sensed data. The expected results are limited by the quality of the remote sensing data used. For instance, at regional scale, the atmospheric corrections face the problem of uncertainty about water vapor and aerosol content. So the use of satellite observations implies the quantification of residual disturbing effects. An other drawback is related to use of the
Field 4: TSAVI 0,0 0,1 0,2 0,3 0,4 0,5 0,6 0,7 0 50 100 day 150 200 250 T S A V I TSAVI_default TSAVI_re-estimated TSAVI_measured Field 3: TSAVI 0,0 0,1 0,2 0,3 0,4 0,5 0,6 0,7 0 50 100 150 200 250 day T S A V I TSAVI_default TSAVI_re-estimated TSAVI_measured (a) (b)
crop models. Those models were initially built up to simulate crops at field scale. For regional scale topics, a field specific calibration is required.
REFERENCES
Allen, J.D., 1990, A look at the Remote sensing Applications Program of the National Agricultural Statistics Service, Journal of official Statistics ,Vol 6, n. 4, pp. 393-409.
Asrar G, Fuchs M, Kanemasu ET, and Hatfield JL, 1984, Estimating absorbed photosynthetic radiation and leaf area index from spectral reflectance in wheat. Agronomy Journal, 76, 300-306.
Baret F. and Guyot G., “Potentials and limits of vegetation indices for LAI and APAR assessment,” Remote Sens. Environ., 1991, 35, pp 161-173.
Boiffin J., Dürr C., Fleury A., Marin-Laflèche A. and Maillet I., “Analysis of the variability of sugar beet (Beta Vulgaris L) growth during the early stages. I. Influence of various conditions of crop establishment,” Agronomie, 1992, 12, pp 515-525.
Bouman B. and Goudriaan J., “Linking crop models and remote sensing data,” In : Proceedings 1st Congress E.S.A. Paris (FRA), 1990, 5-7 Dec.
Duke C., “Assimilation de données de réflectance dans un modèle de fonctionnement de la betterave sucrière en vue de la prévision des rendements à l’échelle régionale”, Doctoral Thesis, Institut National Agronomique Paris-Grignon, Paris, 1997, 141 pp.
Duke C. and Guérif M., “Crop reflectance estimate errors from the SAIL model due to spatial and temporal variability of canopy and soil characteristics,” Remote Sens. Environ., 1998, 66, pp 286-297.
Dürr. C., Guérif M., Brochery F., Ferré F., “Study of crop establishment effects on subsequent growth using a crop growth model (SUCROS),” E.S.A. International Symposium « Modeling cropping systems », June 1999, Lleida (Spain).
Genovese G., 1997, Yield Forecasting and operational approaches using Remote Sensing: overview of approaches and operational applications in 1994 in the EU. Proceedings of the Seminar on Yield
Forecasting, Villefranche sur Mer, 24-27 October 1994, ISBN92-827-9451-2, pp. 79-86.
Guérif M. and Duke C., “Calibration of the SUCROS emergence and early growth module for sugarbeet using optical remote sensing data assimilation,” European Journal of Agronomy, 1998, 9, pp 127-136.
Guérif M., Launay M., and Duke C., 2000, “Remote sensing as a tool enabling the spatial use of crop models for crop diagnosis and yield prediction”, IGARSS2000, 24-28 July 2000, Hawaï, USA, pp **.
Kumar M, and Monteith JL, 1981, Remote sensing of crop growth. In: Plants and the Daylight Spectrum (H Smith, eds) Academic Press, New York, 133-144
Launay M., Guérif M., Dedieu G., “Utilisation d’un modèle de correction atmosphérique (SMAC) pour le calcul de réflectances au sol à partir d’images SPOT ”, Photo-Interpretation, (in press).
Launay M. and Guérif M., “Remote sensing data assimilation in a sugar beet growth model as a tool for spatial crop development variability forecast and diagnosis”, 8th International Symposium “Physical Measurements and Signatures in Remote Sensing”, January 2001, Aussois (France).
Meyer-Roux J., King C., 1992, European Achievements in remote sensing: Agriculture and Forestry,
International Journal of Remote Sensing, Vol. 13, n.6-7, pp. 1329-1341.
Monteith JL, 1977, Climate and the efficiency of crop production in Britain. Philosophical Transactions of the
Royal Society of London, B281, 277-294
Moulin, S., Bondeau, A., and R. Delécolle, 1998, Combining agricultural crop models and satellite observations: from field to regional scales, Int. J. Remote Sensing, Vol 19-No 6, 1021-1036.
Porter JR, 1984, A model of canopy development in winter wheat. Journal of agricultural Sciences, Camb., 102, 383-392
Spitters C., van Keulen H., van Kraalingen D., “A simple and universal crop growth simulator : SUCROS87,” In Simulation and systems management in crop protection, eds R. Rabbinge, S.A. Ward, H.H. van Laar, Simulation Monographs 32, PUDOC, Wageningen, 1989, 434 pp.
Stol W., Rouse D.I., van Kraalingen D., Klepper O., “FSEOPT a FORTRAN program for calibration and uncertainty analysis of simulation models,” Simulation Report CABO-TT, n° 24, CABO-DLO and Agricultural University, Wageningen, 1992, 24 pp.
Tucker CJ, Holben BN, Elgin JH, and McMurtrey III JE, 1981, Remote Sensing of Total Dry-Matter Accumulation in Winter Wheat. Remote Sensing of Environnement, 11, 171-189.
van Laar H.H., Goudriaan J., van Keulen H., “Simulation of a crop growth for potential and water limited production situations (as applied to spring wheat)”, Simulation Reports CABO-TT, 27, CABO-DLO/TPE-WAU, Wageningen, 1992, 310pp.
Verhoef W., « Light scattering by leaf layers with application to canopy reflectance modeling : the SAIL model », Remote Sens. Environ., 1984, 16, pp 125-141.
Wiegand CL, Richardson AJ, Jackson RD, Pinter Jr PJ, Aase JK, Smika DE, Lautenschlager LF, and McMurtrey III JE, 1986, Development of agrometeorological crop model inputs from remotely sensed information.
IEEE Transactions on Geoscience and Remote Sensing GE, 24(1), 90-97
Whistler, F.D., Acock B., Baker D.N., Fye R.E., Hodges H.F., Lambert J.R., Lemmon H.E., McKinion J.M., and Reddy V.R., 1986, Crop simulation models in agronomic systems, Advances in Agronomy, 40,141-208.