Tracing glacier wastage in the Northern Tien Shan
(Kyrgyzstan/Central Asia) over the last 40 years
Peter Niederer&Viktor Bilenko&Natasha Ershova&
Hans Hurni&Sergeji Yerokhin&Daniel Maselli
Received: 6 February 2006 / Accepted: 15 March 2007 / Published online: 1 August 2007 # Springer Science + Business Media B.V. 2007
Abstract The status and dynamics of glaciers are crucial for agriculture in semiarid parts of Central Asia, since river flow is characterized by major runoff in spring and summer, supplied by glacier- and snowmelt. Ideally, this coincides with the critical period of water demand for irrigation. The present study shows a clear trend in glacier retreat between 1963 and 2000 in the Sokoluk watershed, a catchment of the Northern Tien Shan mountain range in Kyrgyzstan. The overall area loss of 28% observed for the period 1963–2000, and a clear acceleration of wastage since the 1980s, correlate with the results of previous studies in other regions of the Tien Shan as well as the Alps. In particular, glaciers smaller than 0.5 km2have exhibited this phenomenon most starkly. While they registered a medium decrease of only 9.1% for 1963–1986, they lost 41.5% of their surface area between 1986 and 2000. Furthermore, a general increase in the minimum glacier elevation of 78 m has been observed over the last three decades. This corresponds to about one-third of the entire retreat of the minimum glacier elevation in the Northern Tien Shan since the Little Ice Age maximum. 1 Introduction
Glacier wastage has been pervasive on a global scale during the last century. However, two regions exhibit an especially large retreat of glacial ice: Alaska– including the Coast Range – and Central Asia (Arendt et al.2002). While the glaciers in these two regions account for about 30% of all mountain and subpolar glaciers outside Greenland and the Antarctic ice sheets, they have been responsible for about 70% of global mass loss since the mid-twentieth century (Dyurgerov and Meier2005). As freshwater scarcity is a serious issue in
P. Niederer
:
H. Hurni:
D. Maselli (*)Centre for Development and Environment (CDE), NCCR North–South, University of Berne, Bern, Switzerland
e-mail: daniel.maselli@cde.unibe.ch
V. Bilenko
:
N. ErshovaKyrgyz-Russian Slavic University, Bishkek, Kyrgyzstan S. Yerokhin
Central Asia– especially during the dry summer period – glaciers play a crucial role. High-population areas in and near the mountains derive much of their usable water from snow and ice melt. In the former Soviet Union part of Central Asia Glacier contribution to annual runoff of important rivers such as Amu Darya, Syr Darya, and Ily is from 5 to 40% on the plains, and up to 70% in the upper basins (Dyurgerov and Meier 2005). River flow is characterised by major runoff in spring and summer, supplied by glacier- and snowmelt (Meier et al.2003). Maximum water supply thus ideally coincides with the critical period of water demand for irrigation. Furthermore, seasonal and long-term storage in snow cover and glaciers guarantees a disproportionately high and reliable discharge, which has a compensatory effect and attenuates water shortages in the lowlands (Viviroli et al.2003).
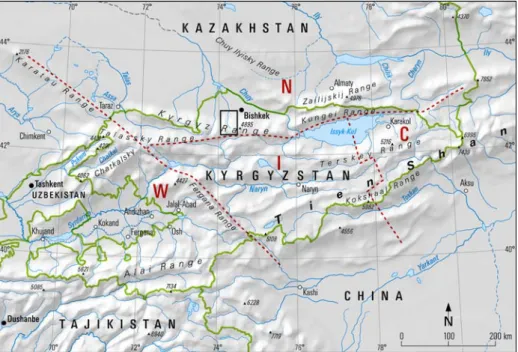
For these reasons, a thorough understanding of the status and dynamics of glaciers in this area is fundamental in order to anticipate water crises and plan appropriate measures. The present study examines glacier variations for the Sokoluk watershed, located in the Northern Tien Shan about 720 km2 in size (Fig.1), with the potential to contribute to a better understanding of possible impacts of climatic change in a region where little detailed data on this subject are available. Although determining mass balance of glaciers would deliver more accurate results concerning glacier wastage (Dyurgerov and Meier 2005; WGMS 2005), this approach has not been used mainly due to financial and time constraints. Instead, glaciers have been monitored on the basis of their size, using manual glacier mapping and thresholding of ratio images– a relatively simple, robust, and accurate approach extensively tested and described by Paul et al. (2002).
Fig. 1 Subdivision of the Former Soviet Union (FSU) part of the Tien Shan (dotted lines) into: W Western, I inner, N Northern, and C Central Tien Shan, its main sub-ranges, and the study area (black rectangle)
2 Material and methodological approach 2.1 Topographic maps and satellite images
The availability of cloud- and snow-free satellite imagery required for glacier mapping is usually very limited. For the study area, only two relatively cloud-free scenes with appropriate snow conditions were available: (a) a high-resolution image (5 m resolution) recorded by the KFA1000 sensor (24 August 1986), and (b) a Landsat ETM scene shot exactly 14 years later on 24 August 2000. In order to analyse a larger time period, alternative material had to be sought and tested. This resulted in the use of Russian topographic maps (scale 1:25,000) based on aerial photographs recorded in 1963.
2.2 Glacier mapping
Unless otherwise noted, ARC Info 9.1 software was used for processing spatial data. Glacier outlines were digitized from the topographic maps, which were previously georeferenced with an average rectification error of about 3 m root mean square error (RMS). In a second step, a Digital Elevation Model (DEM) with a cell size of 30 m – based on digitized contour lines derived from topographic maps at 1:50,000 – was generated. This product is essential to remove panoramic distortion, assure perfect overlay of spatial information from different sources, and obtain 3D glacier parameters such as minimum elevation, maximum elevation, elevation range, slope, and aspect. The Landsat ETM scene was orthorectified in the Erdas Imagine 8.7 orthorectification tool using the DEM in combination with a set of ground control points identified on topographic maps at 1:25,000 to a residual RMS error of one third of a pixel (10 m). The KFA1000 scene was orthorectified with a residual RMS error of 15 m.
After dividing band 4 by band 5 with the Landsat ETM image as an input, thresholding was performed with a value of 2.0, using Erdas Imagine 8.7 software. The output is a raster file with two classes (‘glaciers’ and ‘other’) corresponding to a glacier map (classified image).
2.3 GIS processing
In addition to the total surface, information concerning the dynamics of individual glaciers was gathered by defining ice divides between connected glaciers. This was done by on-screen digitizing of a glacier basin vector layer in arcedit with the help of automatically generated watersheds/basins. The ice divides were then extended to closed polygon roughly surrounding the glaciers taking into account the 1963, 1986 and 2000 outlines. The output is a new vector file, with boundaries that takes possible future variations of the glacier area into account. The glacier map was then converted from a raster file into a vector file and intersected with the previously mentioned vector file. The glacier outlines– including those derived from topographic maps – were then combined with the glacier basin layer. Simultaneously, individual IDs were attributed. The resulting data layers with the individual glaciers were then processed together with the DEM in Erdas Imagine 8.7 software, using the zonal attributes tool. 3D parameters were automatically written into the attribute table. The same procedure was repeated with a slope and an aspect model based on the DEM.
3 Results
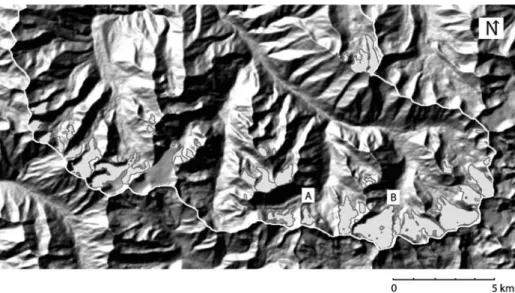
Of the 80 glaciers in the Sokoluk watershed, three had to be rejected due to unclear boundaries caused by clouds on the Landsat ETM scene. Figure2gives an overview of the 77 glaciers of the Sokoluk watershed used for analysis. The changes observed during the whole time period encompass (1) a decrease in average area, (2) melting along the perimeter, (3) complete disappearance of former small glaciers, (4) increase of the outcrop area, and (5) separation from parent glaciers (see Fig.3).
The widespread global glacier wastage observed since the late 1970s– with a marked acceleration in the late 1980s (Khromova et al.2003; Paul et al.2004)– also occurred in the Sokoluk watershed. In fact, the annual area decrease more than doubled, from 0.6% for the period 1963–1986 to 1.3% for the period 1986–2000. Table 1 shows the dramatic changes observed since the 1960s. The total area covered by ice was reduced by more than 28% between 1963 and 2000. From 1963 to 1986, 13.3% of the surface was lost and even greater losses occurred in the following 14 years, when 17.1% of the ice surface disappeared. However, since 1963 only eight glaciers have completely disappeared. They all belonged to class I (<0.5 km2). Although glaciers in this class cover only one-fourth of the total ice surface, they accounted for more than 40% of the entire area loss since 1963. While these glaciers only decreased by 9.1% for the period 1963–1986, they lost 41.5% of their surface between 1986 and 2000. Hence class 1 glaciers experienced by far the greatest decrease of all glacier classes, very similar to the area loss characteristics observed in the European Alps (Paul et al.2004).
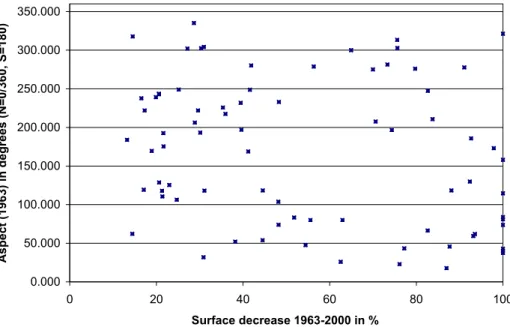
The 77 glaciers analysed cover the whole range of aspect. There was no significant relationship between retreat and aspect, either for the period 1963–1986 or the period 1986–2000 (Fig. 4). The minimum elevation increased by 78 m in average (±86 m) between 1963 and 2000. In addition to the retreat of glacier fronts, disintegration of the former compact glacier system also occurred.
Fig. 2 Overview of the glaciers analysed inside the upper part of the Sokoluk watershed (white borderline). Glacier outlines are digitised automatically from a Landsat ETM image without prior editing. The glacier changes for area A and B are depicted in detail in Fig.3. Background image: Digital Elevation Model derived from topographic maps 1:50,000
4 Discussion
4.1 Aspects related to the results
The considerable decrease of 28.1% in glacier area since 1963 in the Sokoluk watershed correlates with other wastage assessments in Central Asia: 29% in the Zailisky Alatau (Western Tien Shan) between 1955 and 1990 (Vilesov and Uvarov 2001), 23% in the Ak-Shirak (Central Tien Shan) between 1977 and 2001 (Khromova et al.2003), and 16% in the Pamir between 1957 and 1980 (Shetinnikov 1998). In the Alps, glacier wastage between 1973 and 1998 was 18% (Paul et al.2004). Given the close link between agriculture and freshwater – e.g. in Kyrgyzstan, 94% of the available freshwater is used for agricultural purposes (World Bank 2005)– and the importance of this sector for national economies, massive glacier retreat could become a serious threat in Central Asia in the near future.
In both mountain systems– the Tien Shan and the Alps – the rapid decrease of small glaciers is an alarming fact. Small glaciers indicate warming trends more clearly – even though they tend to have a higher temporal and spatial variability than large glaciers (Kääb et al.2002; Paul et al.2004).
Glacier recession in the Tien Shan began around 1943 and has accelerated since the 1980s (Khromova et al.2003). The main reason for this is related to a constant increase in
Table 1 Glacier surface change in the Sokuluk watershed (Northern Tien Shan, Kyrgyzstan) for 77 glaciers from 1963 to 2000, based on four area classes
Class (km2) Number Area in km2 Area change in %
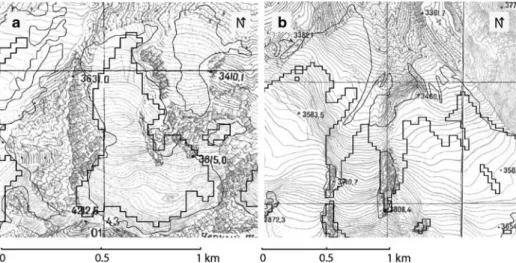
1963 2000 1963 1986 2000 1963/1986 1986/2000 Total Class I (<0.5) 61 53 7.652 6.953 4.067 −9.1 −41.5 −46.9 Class II (0.5–1.0) 7 7 5.779 5.102 4.465 −11.7 −12.5 −22.7 Class III (1.0–5.0) 9 9 18.293 15.435 14.265 −15.6 −7.6 −22.0 Total 77 69 31.724 27.490 22.796 −13.3 −17.1 −28.1 Fig. 3 2D illustration of glacier contour lines; background map delineates glacier extent in 1963; thin black contour line for 1986, fat black contour line for 2000. a Retreat of margins, disappearance of a small glacier, and separation from parent glaciers. b Expansion of the outcrop area
annual and summer air temperatures as well as a decrease in summer precipitation (Thompson et al.1993; Voloshina and Kang1995). Since summer precipitation in Central Asia plays a crucial role in annual mass balance, this combined effect amplifies the negative impact on glaciers (Ageta and Higuchi1984; Zichu et al.1999).
Since the maximum elevation has not changed over time (Fig. 3), the increase of minimum elevation of 78 m corresponds to a mean elevation of about 40 m. Given the fact, that the mean elevation is a rough but reasonable approximation to the equilibrium-line altitude (ELA) on individual glaciers at a regional scale (Haeberli and Hoelzle1995), the ELA has experienced the same magnitude of increase. Without marked changes in precipitation, this would roughly correspond to a 0.5°C change in mean annual air temperature (WGMS2005). In the entire Northern Tien Shan, the minimum elevation has risen on average by 215±140 m since the Little Ice Age (LIA) maximum around 1820 (Solomina et al.2004). Hence, the increase observed over the last 37 years for the Sokoluk watershed corresponds to one third of the total regional increase over the last 180 years. 4.2 Aspects related to the method
Glacier mapping by means of thresholded TM4/TM5 ratio images proved to be simple, robust and accurate. In general, the automatically derived glacier outlines fit the visible glaciers well. Small isolated ice and snowfields are not classified as glaciers, and even glacier areas that lie in cast shadow are correctly mapped (Paul et al.2002,2003).
The use of a median filter with a 3 by 3 kernel size, in order to reduce misclassification due to small snow fields, shadowy pixels, and small debris cover appears to be appropriate, despite the fact that glaciers smaller than 0.1 km2are altered significantly by this noise filter (Paul et al. 2002). In order to reduce the possibility of error, local glacier experts were involved in interpreting the contours of glaciers.
To generate more accurate glacier parameters– especially for smaller glaciers – a special DEM with better resolution would be needed (e.g., derived from ASTER). This is
0.000 50.000 100.000 150.000 200.000 250.000 300.000 350.000 0 20 40 60 80 100 Surface decrease 1963-2000 in % Aspect (1963) in degrees (N=0/360, S=180)
particularly true for the automatic mapping of debris-covered glacial ice, which remains a major challenge of the approach. In the absence of a high resolution DEM, Kyrgyz glaciologists who regularly visit the area added the debris-covered parts manually. This correction resulted in an increase of glacial ice surface of only 1.8%.
Despite all these correction measures, residual error is unavoidable due to (a) possible errors in glacier outlines in the original topographic maps, (b) inaccuracy due to a relatively coarse DEM, and (c) errors in the imagery transformation procedures. However, with regard to the massive glacier retreat that occurred, such residual errors can be considered negligible.
5 Conclusions and outlook
The investigations indirectly confirm the increase of air temperature and heat fluxes over the last decades observed in many other regions in the world (IPCC 2001) and the consecutive effect of global warming on glaciers not only in maritime regions but also in very continental high elevated areas. The study thus shows that high mountain glaciers in Central Asia are very sensitive to the global warming process and that this is a serious threat for the‘permanent’ fresh water resources of the entire region.
Besides the retreat of glacier fronts, disintegration of compact glacier systems with very rapid melting of their smaller parts was a very common phenomenon, observed not only in the Sokoluk watershed. According to Khromova et al. (2003) this pattern of disintegration represents a general process of glacier wastage, and once started, it can lead to major changes in glacier size, even without further changes in climate. Although this dramatic area loss of glaciers is not equivalent to similar volume loss-relative volume loss tends to be higher than area loss, because not only surface area but also ice depth is being reduced (see also Dyurgerov and Meier1997)– it has significant effects on irrigation and natural hazards that could affect the local economy and livelihoods in the very near future. If the current annual rate of decrease is maintained, the glaciers of the Sokoluk watershed will shrink to half of their current surface area by the middle of the twenty-first century.
With respect to the methodological approach, fusion of satellite image analysis and GIS technology turned out to be highly suitable for glacier inventorying of this remote region, with comparably little expenditure. In order to improve glacier mapping and monitoring, two elements must be improved: (a) a DEM with a higher resolution is necessary to improve (1) glaciological 3D parameters, (2) ortho-rectification, and (3) the detection of debris covered ice; (b) satellite image shooting should be more frequent. In this respect, the ASTER sensor with its along-track stereo capabilities offers the possibility of DEM generation and simultaneous glacier mapping (Bishop et al.2004; Kääb et al.2002). This could be the basis for a more accurate but still feasible analysis of glacier variations for the entire Tien Shan Range.
Acknowledgement This study was conducted within the framework of the Swiss National Centre of Competence in Research (NCCR) North–South: Research Partnerships for Mitigating Syndromes of Global Change. The NCCR North–South is co-funded by the Swiss National Science Foundation (SNSF) and the Swiss Agency for Development and Cooperation (SDC).
Our sincere thanks go to Andrey Shumakhov of EASTVIEW Company for providing necessary satellite images (KFA1000) and topographic maps; to Daniel Viviroli, Department of Geography, University of Berne; and Frank Paul, Department of Geography, University of Zurich, for fruitful discussions and professional advice. The authors would also like to thank the reviewers for their useful recommendations.
References
Ageta Y, Higuchi K (1984) Estimation of mass balance components of a summer-accumulation type glacier in Nepal Himalaya. Geogr Ann 66A(3):249–255
Arendt A, Echelmeyer K, Harrison W, Lingle G, Valentine V (2002) Rapid wastage of Alaska Glaciers and their contribution to rising sea level. Science 297(5580):382–386
Bishop MP, Olsenholler JA, Shroder JF, Barry RG, Raup BH, Bush ABG, Copland L, Dwyer JL, Fountain AG, Haeberli W, Kääb A, Paul F, Hall DK, Kargel JS, Molnia BB, Trabant DC, Wessels R (2004) Global land ice measurements from space (GLIMS): remote sending and GIS investigations of the Earth’s cyrosphere. Geocarto Int 19/2:57–84
Dyurgerov MB, Meier MF (1997) Year-to-year fluctuation of global mass balance of small glaciers and their contribution to sea level changes. Arct Alp Res 29(4):392–401
Dyurgerov MB, Meier MF (2005) Glaciers and the changing Earth system: a 2004 snapshot. Occasional paper no. 58, INSTAAR, University of Colorado, 117 pp
Haeberli W, Hoelzle M (1995) Application of inventory data for estimating characteristics of and regional climate-change effects on mountain glaciers: a pilot study with the European Alps. Ann Glaciol 21:206– 212 (Russian translation in: Data of Glaciological Studies (Moscow) 82:116–124
IPCC (2001) Climate change 2001: the scientific basis. Contribution of Working Group I to the Third Assessment Report of the Intergovernmental Panel on Climate Change. In: JT Houghton, Y Ding, DJ Griggs, M Noguer, PJ van der Linden, X Dai, K Maskell, CA Johnson (eds) Cambridge University Press, Cambridge, UK, p 881
Kääb A, Paul F, Maisch M, Hoelzle M, Haeberle W (2002) The new remote sensing derived Swiss glacier inventory: II. First results. Ann Glaciol 34:362–366
Khromova TE, Dyurgerov MB, Barry RG (2003) Late-twentieth century changes in glacier extent in the Ak-shirak Range, Central Asia, determined from historical data and ASTER imagery. Geophys Res Lett 30 (16):1863
Meier MF, Dyurgerov MB, McCabe GJ (2003) The health of glaciers: Recent changes in glacier regime. Clim Change 59(1/2):123–135
Paul F, Kääb A, Maisch M, Kellenberger T, Haeberli W (2002) The new remote sensing derived Swiss glacier inventory: I. Methods. Ann Glaciol 34:355–366
Paul F, Huggel C, Kääb A, Kellenberger T (2003) Comparison of TM-derived glacier areas with higher resolution data sets’, EARSeL Workshop on remote sensing of land ice and snow, Bern, 11.–13.3.2002, EARSeL eProceedings 2:15–21 (CD-ROM)
Paul F, Kääb A, Maisch M, Kellenberger T, Haeberli W (2004) Rapid disintegration of Alpine glaciers observed with satellite data. Geophys Res Lett 31:L21402
Shetinnikov AS (1998) Morfologiya i rezhim lednikov Pamiro–Alaya [The morphology and regime of Pamir–Alai glaciers]. Central Asia Hydro-Meteorological Institute, Tashkent
Solomina O, Barry R, Bodnya M (2004) The retreat of Tien Shan glaciers (Kyrgyzstan) since the Little Ice Age estimated from aerial photographs, lichenometric and historical data. Geogr Ann 86A(2):205–215 Thompson LG, Mosley-Thompson E, Davis M, Lin E, Yao T, Dyurgerov M, Dai J (1993) Recent warming: ice core evidence from tropical ice cores with emphasis upon Central Asia. Glob Planet Change 7:145– 156
Vilesov EN, Uvarov VN (2001) Evolyutsiya sovremenngo oledeneniya Zailiyskogo Alatau v XX veke’ [The evolution of modern glaciation of the Zailiyskiy Alatau in the XXth century]. Kazakh State University, Almaty
Viviroli D, Weingartner R and Messerli B (2003) Assessing the hydrological significance of the world’s mountains. Mt Res Dev 23:32–40
Voloshina AP and Kang X (1995) Climat vysokogornoi zony [The climate of high mountain regions]. In: M Dyurgerov, C Liu, Z Xie (eds) Tien-Shan Glaciers (Oledenenie Tyan Shanya), vol. 233. VINITI, Moscow, pp 43–59
WGMS (2005) Glacier Mass Balance Bulletin. In: Haeberli W, Noetzli J, Zemp M, Baumann S, Frauenfelder R, Hoelzle M (eds) IUGG(CCS)/UNEP/UNESCO/WMO
World Bank (2005) World development indicators: Table 3.5. Freshwater.http://www.worldbank.org. Cited 24 November 2005
Zichu X, Jiankang H, Chaohai L, Sciyin L (1999) Measurement and estimative models of glacier mass balance in China. Geogr Ann 81A(4):791–796