DOI 10.1007/s11135-009-9297-9
Testing for measurement equivalence of human values
across online and paper-and-pencil surveys
Eldad Davidov · Felix Depner
Published online: 20 December 2009 © Springer Science+Business Media B.V. 2009
Abstract The following study investigates the measurement equivalence of an online and paper-and-pencil (PAP) survey of human values. For this purpose, a total of 250 respondents completed the 21-item version of the Portrait Value Questionnaire either online (n= 125) or by PAP (n= 125). This questionnaire was developed by Schwartz (Advances in exper-imental social psychology, Academic Press, New York,1992) and has been included in the European Social Survey since 2002 to test his theory of basic human values. Measurement invariance was tested via a multiple group confirmatory factor analysis. The assessment of invariance included the three levels of configural, metric, and scalar invariance, and the latent means of the values between both samples were compared. Results of this study show that the measurements are invariant at the three levels (configural, metric, and scalar), but there are latent mean differences between the values across the surveys. These differences may be partly explained by age and level of education differences between the two samples. Based on these findings we conclude that the methods of measurement are essentially invariant.
Keywords Online survey· Paper-and-pencil survey · Measurement invariance · Multiple group confirmatory factor analysis
1 Introduction
Although unimaginable even 20 years ago, the increasing expansion of the Internet has made it a more popular source of information and research platform in many fields of research.
E. Davidov (
B
)Research Institute for Sociology, University of Cologne, Greinstr. 2, 50939 Cologne, Germany e-mail: E_Davidov@gmx.de
Present Address: E. Davidov
Institute of Sociology, University of Zurich, Andreasstr. 15, 8050 Zurich, Switzerland F. Depner
University of Mannheim, Mannheim, Germany e-mail: Felix.Depner@web.de
Data may be obtained on the Internet more quickly, globally, and cheaply. It is foreseeable that future surveys will apply the Internet as a complementary method of data collection to the commonly used paper-and-pencil (PAP) surveys (Fenlason 2006). However, a key imperative for researchers when combining data collected by different methods is that the data are, in effect, equivalent regardless of the collection method (De Beuckelaer and Lievens 2009).
Throughout the literature, there is no agreement regarding the level of equivalence of Internet-based and PAP questionnaires. Whereas several authors argue that PAP and online surveys do not produce equivalent measurements, others suggest that it is possible to construe them as two equivalent versions (Buchanan and Smith 1999;Wilhelm and McKnight 2002; Preckel and Thiemann 2003). This controversy demonstrates the necessity of further inves-tigations. One cannot assume that these two types of measurement are equivalent without testing them in different contexts and research domains.
In1992Schwartz introduced a theory of basic human values. This theory ignited the revival of empirical research on relations between values, attitudes, and behavior, both within and across cultures (for overviews seeHitlin and Piliavin 2004;Schwartz 2005a,b). Recently, the European Social Survey (ESS) incorporated a new instrument to measure the values from the theory in its semiannual studies of attitudes and opinions. This instrument has been frequently used in different studies in an attempt to explain the opinions, attitudes, and behavior of human beings in various research settings. In the present paper we will focus on the measurement equivalence of the measure assessing Schwartz’ values collected in an online, Internet-based versus a PAP survey. Of particular interest is the question of whether both measurements of values (collected using the two methods) are invariant. Demonstrating invariance of the two types of measurement will allow researchers to collect value data either via the Internet or by using PAP questionnaires and the merging of the two types of collected data for analyses more confidently.
2 Online and PAP interviews as methods of data collection
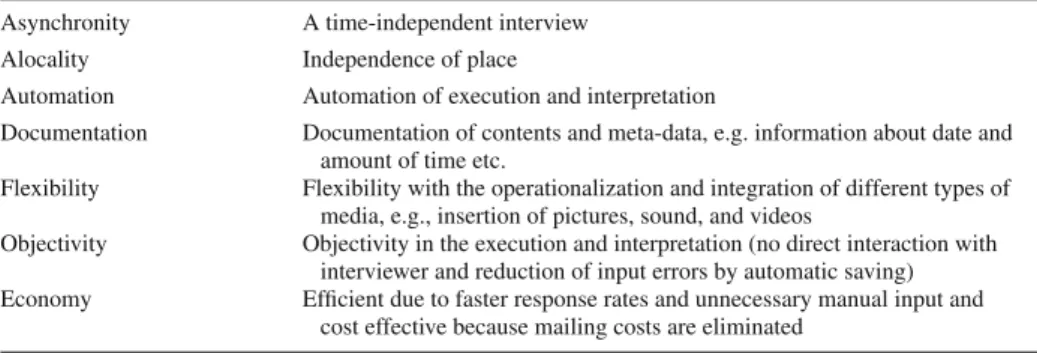
Online surveys have been increasing lately in their distribution and popularity (Bandilla et al. 2001;Batinic and Bosnjak 2000). The significant advantage of such a survey is its promptness and efficiency. It is possible to send a questionnaire to thousands of addressees. They will receive the questionnaire within seconds. In comparison to PAP surveys this implies shorter processing periods (Batinic and Bosnjak 2000). The aspects and innovations of interviews carried out by Internet questionnaires can be illustrated by seven fundamental characteristics (see Table1) which can still claim to be valid despite the rapid progress of the Internet. Table 1 The advantages of internet- based interviews (adopted from Batinic2001)
Asynchronity A time-independent interview Alocality Independence of place
Automation Automation of execution and interpretation
Documentation Documentation of contents and meta-data, e.g. information about date and amount of time etc.
Flexibility Flexibility with the operationalization and integration of different types of media, e.g., insertion of pictures, sound, and videos
Objectivity Objectivity in the execution and interpretation (no direct interaction with interviewer and reduction of input errors by automatic saving) Economy Efficient due to faster response rates and unnecessary manual input and
Nevertheless, there are also several problems with Internet-based interviews. Groves (1989) names five main sources of errors with online surveys (see alsoDillman and Bowker 2001):
1. The coverage error originates if there is not an equal chance for all the persons in a defined population to participate in the survey. An online survey almost never repre-sents the total population. Internet users are systematically different from the rest of the population, especially in respect to their age, level of education, and gender. The typical “Internet user” is on average 32–35 years of age, white, and male, and has a higher than average educational level (Bandilla 2002).
2. The second source of error is the sampling error (Hauptmanns 1999). Only a sample of a population is tested, and the basic population of this sample is not sufficiently known (Hauptmanns 1999;Sackmary 1998).
3. The third source of error is in the measuring instrument itself. Measurement error is caused by missing motivation, problems of comprehension, or by the instrument itself, for example, by ambiguous descriptions of the items, poor performance, technical prob-lems, or difficulties in comprehending portions of the questionnaire. A similar problem exists also in PAP surveys, because there is no interviewer available to help the respon-dent with difficult items (Weis and Steinmetz 2002).
4. Another common source of error in online surveys is the nonresponse error. It implies any kind of unwillingness to answer the questionnaire or parts of it. One differentiates between unit nonresponse (total lack of response) and item nonresponse (only certain portions of the questionnaire remain unanswered) (Schnell 1997). If many items are left unanswered, this will lead to a decreasing reliability of survey results (Bandilla et al. 2001). The extent of item nonresponse, therefore, has an important influence on the quality of the answer (Schnell et al. 1999). This is also regarded as a central disadvantage of PAP interviews (Schnell et al. 1999).
5. Another critical aspect of the online survey is the variability in the equipment of the Inter-net users. InterInter-net users differ widely in the hardware and software they have available as well as in the speed and cost of access to the Internet. Because of these differences it cannot be assumed that an online survey includes the same conditions for every person being interviewed. For instance, some respondents may give up and not complete the interview because of slow internet access or a slow computer. Thus, a standardization of the interviews will be difficult to achieve.
It is often necessary to combine Internet surveys with more conventional modes of data collection such as the PAP method (De Beuckelaer and Lievens 2009). This raises the ques-tion of whether combining the data is justified, and whether measurement invariance between online and PAP surveys can be guaranteed despite differences in the data collection tech-niques and in sources of errors. Establishing measurement equivalence between methods is crucial before interpreting the results of data collected by the various methods. In the next section we provide a brief overview of previous studies assessing measurement invariance across the two methods.
3 Measurement equivalence across online and PAP surveys
When online tests were first introduced, the question arose of whether they are able to pro-duce equivalent measurements with other tests.Buchanan(2002) points out the important fact that the equivalence of PAP and online surveys using the same questionnaire cannot be
presumed without first testing it. Here he is referring to the clinical field in particular but, nevertheless, this statement can be generalized to other fields of application as well.
In competence tests there are indications that online and PAP methods may be combined if the characteristics of the Internet situation are considered1 (Buchanan and Smith 1999; Wilhelm and McKnight 2002;Preckel and Thiemann 2003; De Beuckelaer and Lievens 2009).Buchanan and Smith(1999)) could show that an online self-monitoring test does not only have psychometric characteristics like its PAP equivalent, but its results also emphasize that people answer with a lesser tendency toward socially desirable answering behavior in online psychological tests.Ferrando(2005) also found measurement invariance of a person-ality questionnaire across PAP and online student samples in Spain. By contrast,Ployhart et al.(2003) reported some differences across online and PAP surveys in means and variances of their latent variables of interest.
Several studies show substantial convergence between the online and the PAP method in survey questionnaires as well (De Beuckelaer and Lievens 2009).Rietz and Wahl(2002) interviewed psychologists and nonpsychologists about their self-image and their perception of others. The answers were to a large extent comparable in online and PAP versions of the questionnaire. Respondents displayed a tendency to answer more openly in the online inquiry. This was regarded by the authors as a result of reduced social desirability. Other inquiries were concerned with questions about total quality management (Bachmann et al. 1999) or attitudes toward the environment (Bandilla et al. 2001). None of the inquiries demonstrated a significant difference between the online and the PAP method.
In a recent study,De Beuckelaer and Lievens(2009) tested, for the first time, measurement invariance between online and PAP surveys in a multinational context. Empirical data of the 16 countries included in their study provided support for measurement equivalence of the multi-item instruments they used.
Some studies argue that respondents display different levels of socially desirable answer-ing behavior in PAP and online surveys.Joinson(1999) compared two questionnaires that examined self-direction, self-confidence, and social desirability, and he could show that the respondents completing the online questionnaires showed a significantly lower social desir-ability than the persons questioned in a PAP random test (for similar results seeRietz and Wahl 2002). These findings indicate the necessity of further research of this question. It cannot always be assumed that test persons answer similarly in the online and the PAP ver-sions. Departing from the literature review, we will inquire whether the responses to the human values questions display invariance across online and PAP questionnaires. Before turning to the empirical test, we provide a short description of the theory underlying the value measurements we utilize in this study.
4 The theory of basic human values
In his theory of basic human values, Schwartz draws on and further develops research findings ofKluckhohn(1951)2andRokeach(1973)3and defines values as “desirable, transsituational goals, varying in importance, that serve as guiding principles in the life of a person or other
1For example, it has to be considered that computer phobia can prevent a person from responding to a web
questionnaire.
2 Kluckhohn(1951) defines value imaginations as “conception of the desirable”. This concept means
indi-vidually varying imaginations, beliefs, and ideals.
3Rokeach(1973) defines values as permanent personal or social beliefs about the preference of certain ways
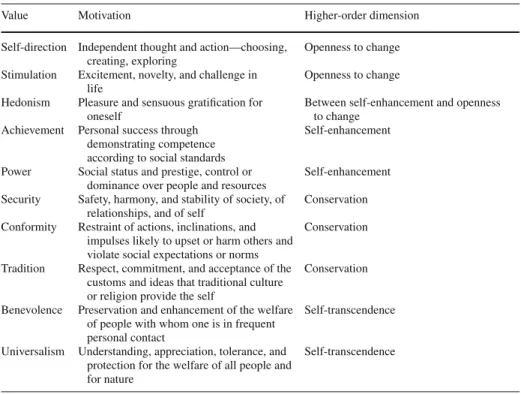
Table 2 The 10 types of values with motivational goals and the higher-order dimensions (adopted from Sagiv
and Schwartz1995)
Value Motivation Higher-order dimension
Self-direction Independent thought and action—choosing, creating, exploring
Openness to change Stimulation Excitement, novelty, and challenge in
life
Openness to change Hedonism Pleasure and sensuous gratification for
oneself
Between self-enhancement and openness to change
Achievement Personal success through demonstrating competence according to social standards
Self-enhancement
Power Social status and prestige, control or dominance over people and resources
Self-enhancement Security Safety, harmony, and stability of society, of
relationships, and of self
Conservation Conformity Restraint of actions, inclinations, and
impulses likely to upset or harm others and violate social expectations or norms
Conservation
Tradition Respect, commitment, and acceptance of the customs and ideas that traditional culture or religion provide the self
Conservation
Benevolence Preservation and enhancement of the welfare of people with whom one is in frequent personal contact
Self-transcendence
Universalism Understanding, appreciation, tolerance, and protection for the welfare of all people and for nature
Self-transcendence
social entity” (Schwartz 1994, p. 21). The main basic assumption is that values are driven by different motivations (Schwartz and Sagiv 1995, p. 93) (see Table2).
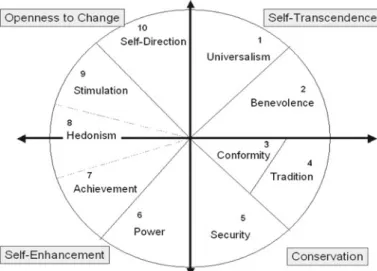
The theory postulates 10 different types of values and two value dimensions. The 10 types of values are arranged in a circumplex structure around the following dimensions: self-tran-scendence versus self-enhancement and openness to change versus conservation. Figure1 displays the circular structure of the types of values as well as the two dimensions behind them. Several empirical studies conducted in many countries and in five continents have supported the theoretical structure of the values (Schwartz 2003; Schwartz and Boehnke 2004).
The dimension of self-transcendence/self-enhancement describes the possible conflict between the acceptance of others as equal entities and the concern for their well-being (types of values: universalism and benevolence) versus the tendency to try to achieve personal suc-cess as well as predominance over others (types of values: power and achievement). The second dimension reflects the possible conflict between independent thought and action and preference for an exciting life (types of values: self-direction and stimulation) versus the tendency to seek stability, security, and attachment to customs, traditions, and conventions (types of values: security, conformity, and tradition). The different types of values correlate differently. Adjacent types of values with similar motivations behind them are found close together and correlate positively. This correlation diminishes with increasing distance of the types of values. The tenth value type, Hedonism, forms a link between openness to change and self-enhancement (Schwartz 2003).
Fig. 1 Circular structure of the values and the two dimensions
In several empirical studies, especially the types of values tradition and conformity, and, in some cases, additional other adjacent pairs of values could not be separated from each other empirically. For example, using data from the ESS,Davidov, Schmidt, and Schwartz(2008b), andDavidov et al.(2008a) unified three pairs of values: universalism with benevolence, tra-dition with conformity, and power with achievement. These values correlated too highly, and they could not be modeled separately. In another study with the same instrument (Billiet and Meuleman 2008;Davidov et al. 2008a) the authors unified universalism with benevolence and tradition with conformity and security. These results do not contradict the assumption of the circular structure because of the adjacent character of the values. According to Schwartz, research instruments often do not allow researchers to tap the subtle differentiation of the types of values as described in the theory. In the next section we provide a description of the questionnaire utilized in this study to assess the 10 values defined in Schwartz’ theory.
5 Method
5.1 The questionnaire
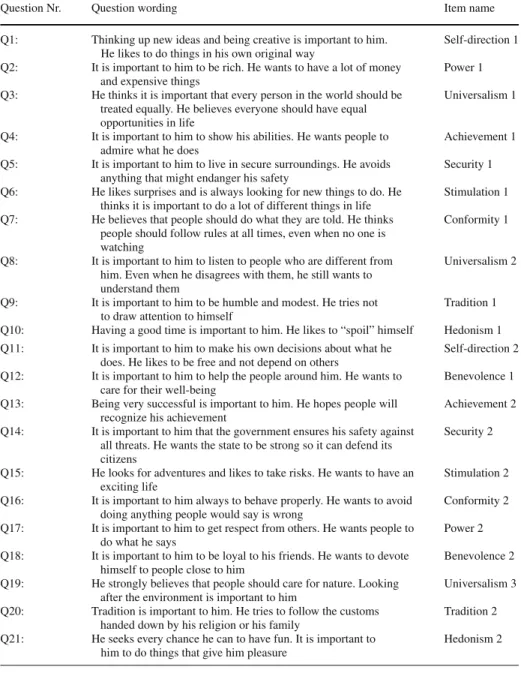
The 21-item question battery of the ESS is applied in the present study to measure value priorities.4This is a new instrument developed by Schwartz to capture the values in his the-ory. For this purpose, the interviewee is confronted with a description of a person (gender matched). He or she has to report on a six-point scale (1= not like me at all; 6 = very much like me) if the person in question is similar or not to him or her. The questions are displayed in Table 3.5In addition, sociodemographic variables were assessed (gender, age, nationality, highest level of education, and professional status). Two methods of data collection were
4Seewww.europeanscialsurvey.org.
5We used the German translation of these questions. They were controlled by Schwartz. All the items are
double-barreled because each includes two sentences.Schwartz(2003) discusses the rationale for this and presents evidence suggesting that it does not create a problem in this case.
Table 3 The value questions (male version)
Question Nr. Question wording Item name
Q1: Thinking up new ideas and being creative is important to him. He likes to do things in his own original way
Self-direction 1 Q2: It is important to him to be rich. He wants to have a lot of money
and expensive things
Power 1 Q3: He thinks it is important that every person in the world should be
treated equally. He believes everyone should have equal opportunities in life
Universalism 1
Q4: It is important to him to show his abilities. He wants people to admire what he does
Achievement 1 Q5: It is important to him to live in secure surroundings. He avoids
anything that might endanger his safety
Security 1 Q6: He likes surprises and is always looking for new things to do. He
thinks it is important to do a lot of different things in life
Stimulation 1 Q7: He believes that people should do what they are told. He thinks
people should follow rules at all times, even when no one is watching
Conformity 1
Q8: It is important to him to listen to people who are different from him. Even when he disagrees with them, he still wants to understand them
Universalism 2
Q9: It is important to him to be humble and modest. He tries not to draw attention to himself
Tradition 1 Q10: Having a good time is important to him. He likes to “spoil” himself Hedonism 1 Q11: It is important to him to make his own decisions about what he
does. He likes to be free and not depend on others
Self-direction 2 Q12: It is important to him to help the people around him. He wants to
care for their well-being
Benevolence 1 Q13: Being very successful is important to him. He hopes people will
recognize his achievement
Achievement 2 Q14: It is important to him that the government ensures his safety against
all threats. He wants the state to be strong so it can defend its citizens
Security 2
Q15: He looks for adventures and likes to take risks. He wants to have an exciting life
Stimulation 2 Q16: It is important to him always to behave properly. He wants to avoid
doing anything people would say is wrong
Conformity 2 Q17: It is important to him to get respect from others. He wants people to
do what he says
Power 2 Q18: It is important to him to be loyal to his friends. He wants to devote
himself to people close to him
Benevolence 2 Q19: He strongly believes that people should care for nature. Looking
after the environment is important to him
Universalism 3 Q20: Tradition is important to him. He tries to follow the customs
handed down by his religion or his family
Tradition 2 Q21: He seeks every chance he can to have fun. It is important to
him to do things that give him pleasure
Hedonism 2
used: online and PAP. The online version of the questionnaire corresponds with the PAP version with regard to contents but it is not identical with regard to format.
5.2 Data collection
In October 2007, 125 individuals completed the online questionnaire and another 125 indi-viduals the PAP questionnaire containing the value questions. The online questionnaire was sent by e-mail to students of the Faculty of Social Sciences and Economics of the University
of Mannheim, Germany, who were then asked to pass the e-mail on to five other persons.6 By opening the attachment to the e-mail the questionnaire could be filled in directly on the PC and sent back “anonymously” by pressing the button “send by e-mail”. Using this option did not allow us to know the e-mail address which was used to send the questionnaire, and respondents knew that they would remain anonymous. The PAP survey was completed by students at the University of Mannheim and clients of a bank in Mannheim. This survey was also completed anonymously and was sent back in preaddressed, postage paid return envelope.7
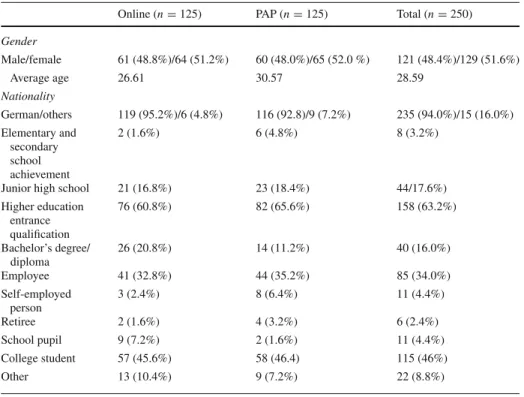
Table4displays some sociodemographic characteristics of the respondents in both sur-veys. The average age in the total sample was 28.6 years, ranging from 16 to 71 years. Slightly more than half (51.6%) of the respondents were female. The largest portion of the sample was German (94%), and 63.2% were either students or graduates of an institution of higher edu-cation. Logistic regression analysis demonstrates significant ( p< 0.05) differences between both groups in terms of age and educational level. The persons interviewed online were sig-nificantly younger and had a higher educational level in comparison to those completing the PAP survey. The differences between the groups in terms of gender, nationality, and profes-sional status were not significant. There were no missing values (item nonresponse) in the value questions.
5.3 Testing for invariance
To test for invariance of the value measurements across surveys a multiple group confirma-tory factor analysis (MGCFA) was applied (Jöreskog 1971). This is one of the most popular techniques to assess invariance (De Beuckelaer 2005). Each sample represents one group in the analysis. This technique allows testing different levels of invariance of the value questions hierarchically in four steps. The last step is the mean comparison of the value factors across the samples (Bollen 1989;Meredith 1993;Kline 1998;Steenkamp and Baumgartner 1998; Byrne 2001).
The study of invariance is subject to the following steps. Each of these steps represents a level of hierarchy of the measurement equivalence. The transition from one level to the next is tied to certain parameter restrictions:
1. The first step is to test for configural invariance. Configural invariance is the very basic form of invariance and assesses whether we find the same patterns of loading between indicators and factors in both groups. The parameter restrictions only refer to the pat-terns of “loading” and “nonloading”. Configural invariance is assumed if the same items measure the same factors in both groups. If configural invariance is not supported empiri-cally, there are fundamental distinctions in the measurement structure, which means that the manifest variables measure different latent variables.
2. In case of given configural invariance, the multigroup model can test for a higher level of invariance known as metric invariance. The metric invariance model is more stringent in comparison to the configural invariance model, as additional restrictions are adopted. Metric invariance means that, in addition to the conditions of configural invariance for all groups, the factor loadings are equivalent. If the model of metric invariance is
6The questionnaire was initially sent to 120 students. This technique is also called “snowball technique”.
It was chosen in order to increase response willingness and credibility of the survey. Participants were more willing to participate when they received the questionnaire from their friends or colleagues. The disadvantage was the rather homogeneity of the sample.
Table 4 Distribution of the sample characteristics across methods
Online (n= 125) PAP (n= 125) Total (n= 250) Gender Male/female 61 (48.8%)/64 (51.2%) 60 (48.0%)/65 (52.0 %) 121 (48.4%)/129 (51.6%) Average age 26.61 30.57 28.59 Nationality German/others 119 (95.2%)/6 (4.8%) 116 (92.8)/9 (7.2%) 235 (94.0%)/15 (16.0%) Elementary and secondary school achievement 2 (1.6%) 6 (4.8%) 8 (3.2%)
Junior high school 21 (16.8%) 23 (18.4%) 44/17.6%)
Higher education entrance qualification 76 (60.8%) 82 (65.6%) 158 (63.2%) Bachelor’s degree/ diploma 26 (20.8%) 14 (11.2%) 40 (16.0%) Employee 41 (32.8%) 44 (35.2%) 85 (34.0%) Self-employed person 3 (2.4%) 8 (6.4%) 11 (4.4%) Retiree 2 (1.6%) 4 (3.2%) 6 (2.4%) School pupil 9 (7.2%) 2 (1.6%) 11 (4.4%) College student 57 (45.6%) 58 (46.4) 115 (46%) Other 13 (10.4%) 9 (7.2%) 22 (8.8%)
maintainable, the manifest variables measure the latent variables equally well. If the model fit of the metric invariance model does not decrease significantly, metric equiva-lence of all items can be assumed. Given metric invariance, the contents of the factors are assumed to be equivalent (Steenkamp and Baumgartner 1998;Vandenberg and Lance 2000). Likewise, the relations of the variables with other variables may be compared across the groups. The test of metric invariance is conducted by comparing the fit of the metric and configural invariance models to the data with a Chi-square (χ2) dif-ference test. Further ‘modern’ indications for invariance are difdif-ferences in the indices comparative fit index (CFI), root mean square error of approximation (RMSEA), and standardized root mean residual (SRMR) (Chen 2007). Minimal differences in these global fit measures between the models may support a more restricted model.
3. The third step includes the scalar invariance test. On testing scalar invariance the item intercepts are equated across the samples. If the model fit does not prove to be sig-nificantly worse in comparison to the metric invariance model, this would mean that scalar invariance is given. Scalar invariance guarantees the comparability of values mea-surements and allows the comparison of latent means (Meredith 1993;Steenkamp and Baumgartner 1998). Comparisons of latent means between the groups are meaningful under these conditions as they guarantee that differences or similarities in factor means are a result of differences in the scores of the value questions and not due to differences in intercepts or factor loadings.8
8Here mean and covariance structure (MACS) analysis is applied (Sörbom 1974,1978) because means and
4. Finally, the latent means are compared across the samples. This step presupposes scalar invariance since otherwise latent mean comparison may not be meaningful. The means in one group are restricted to zero (in our case in the online sample) and in the other group (PAP sample) they are freely estimated. If estimated means in this latter group differ significantly from zero, the conclusion is drawn that means in both groups differ significantly from each other.
6 Data analysis
6.1 Single-sample analyses
Before the multigroup analysis, we conducted two separate confirmatory factor analyses for each sample.Byrne(2001) has emphasized the importance of conducting single-sample analyses before turning to the multiple-group comparison.
In line with previous research (e.g., Davidov et al. 2008b), we measured directly the higher-order dimensions of the values by their corresponding items. The relatively small sample size only allows for a limited number of parameters to be estimated. Measuring the higher-order dimensions directly does not contradict theory.Schwartz(1992) argues that dis-tinguishing between 10 different values is done only for convenience. We may consider the structure of values to be similar to the continuum of colors in a rainbow, and one may decide to distinguish between more or less values. We followed these suggestions and measured a more parsimonious model with two higher-order dimensions and four factors. The two higher dimensions self-transcendence/self-enhancement and openness to change/conservation con-stitute four factors. The factor hedonism and its two items remain excluded from the model, as this factor partly contains self-enhancement and openness to change. The remaining 19 items are attributed to the four factors. Analyses were conducted using the computer program Amos 7.0 (Arbuckle 2005).
The models required several modifications. At first, items that did not achieve adequate factor loadings were eliminated. The criterion we set for an item to load on a factor was 0.49 and higher. Some loadings were too low for the conservation, transcendence, and self-enhancement factors.10As the invariance test should be performed on the same measurement model, we eliminated the same items in both samples.11In the second step, modifications that proposed to allow error correlations of the value items were examined. From a theoretical point of view, however, allowing for error correlations is problematic as it may point out to possible multidimensionality of the items whose errors are allowed to correlate (Salzberger 1997;Joreskog 1993). They do suggest, however, that there is a systematic link between these residuals. In our case, the reasons could be similar content and similar patterns of reply. Two error correlations were allowed. The first was between the two items measuring achievement. This is not surprising because they measure the same aspect. The second error correlation was between the first stimulation item (important to do different things) and the first benevolence item (important to help other people). The reason for this modification may be that for both items individuals did not mark the response “not like me at all” and focused
9There is no absolute cut-off criterion for a factor loading, but it is recommended that it is at least larger than
0.4–0.5 (see, e.g., the dispute in Saris2001).
10Similar problems were encountered with the ESS data. However, factor loadings were not that low as in
our case (see, e.g.,Davidov et al. 2008b).
11The six items that we dropped were important to be humble, important to be traditional, important to think
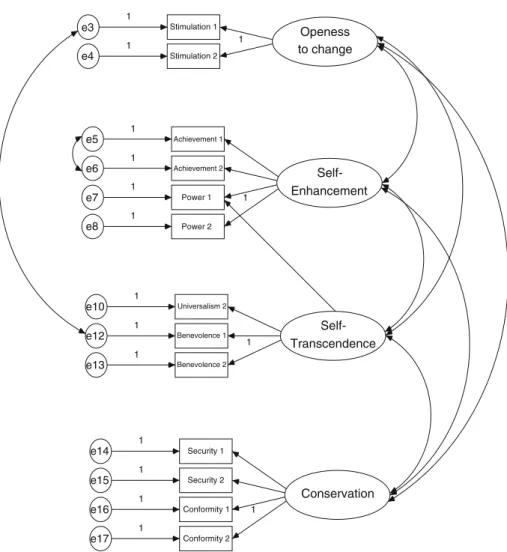
Openess to change Self-Enhancement Self-Transcendence Conservation Stimulation 2 e4 1 1 Stimulation 1 e3 1 Power 2 e8 1 1 Power 1 e7 1 Achievement 2 e6 1 Achievement 1 e5 1 Benevolence 2 e13 1 1 Benevolence 1 e12 1 Universalism 2 e10 1 Conformity 2 e17 1 1 Conformity 1 e16 1 Security 2 e15 1 Security 1 e14 1
Fig. 2 Model specification. For indicator names see Table3.
on the other categories instead. The last modification included a negative cross-loading of self-transcendence to the first power item (important to be rich). It is possible that the neg-ative cross-loading compensated an overestimated correlation between the two constructs self-transcendence and self enhancement.12Consequently, the final model that we tested for invariance included 13 items: stimulation 1+2, achievement 1+2, power 1+2, universalism 2, benevolence 1+ 2, security 1 + 2 and conformity 1 + 2 (see Fig.2).13
6.2 Multiple-group analysis
Now we turn to the simultaneous multiple-group comparison. This model will enable us to test to what extent the value measurements are invariant across the samples. To test it we use
12A positive cross-loading may balance a relation between constructs when it is underestimated.
13Knoppen and Saris(2007) come to similar conclusions with ESS data and suggest eliminating several of
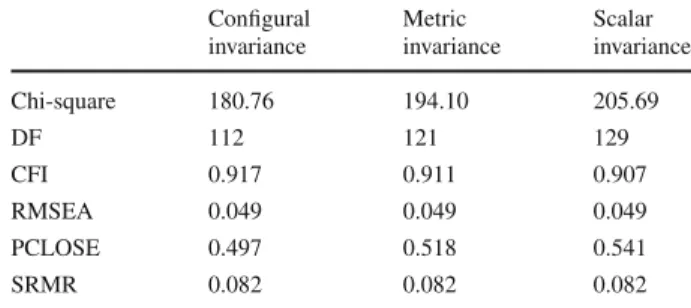
Table 5 Global fit measures for
the MGCFA assessing configural, metric, and scalar invariance DF degrees of freedom, CFI comparative fit index, RMSEA root mean square error of approximation,
PCLOSE probability of close fit, SRMR standardized root mean square of residuals
Configural Metric Scalar
invariance invariance invariance
Chi-square 180.76 194.10 205.69 DF 112 121 129 CFI 0.917 0.911 0.907 RMSEA 0.049 0.049 0.049 PCLOSE 0.497 0.518 0.541 SRMR 0.082 0.082 0.082
the same model that we ended up with in the single sample analyses. This model included 4 constructs, 13 items, 1 cross-loading, and 2 error correlations. The global fit measures of the configural invariance model displayed in Table5were acceptable and suggested that the model should not be rejected (χ2 = 180.76, DF = 112, χ2/DF= 1.614, CFI = 0.917, RMSEA= 0.049, PCLOSE = 0.497, SRMR = 0.082) (Hu and Bentler 1999;Marsh et al. 2004). This implies that the two samples display configural invariance.
To assess metric invariance, the factor loadings of all items were constrained to be identi-cal across the groups. As can be seen in Table5, the results indicate that the metric invariance model is supported by the data (χ2 = 194.10, DF = 121, χ2/DF= 1.604, CFI = 0.911, RMSEA= 0.049, PCLOSE = 0.518, SRMR = 0.082). A χ2 difference test between the configural and the metric invariance model revealed that there was no significant difference in the model fit. Furthermore, differences in the fit indices CFI, RMSEA, and SRMR can be taken as further indications for invariance (Chen 2007). The differences in these fit measures between the models are below the recommended criteria. Thus, we can conclude that the samples display metric invariance.
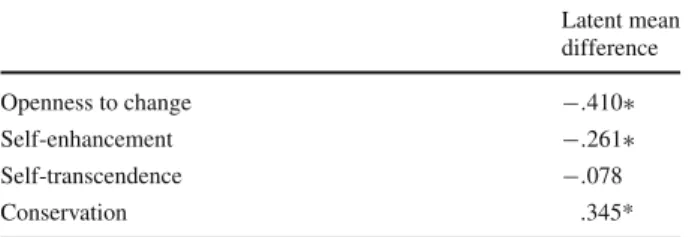
Next, we turned to the test of scalar invariance. In addition to the constraint of equal factor loadings, we constrained the intercepts of the items to be equal across the sam-ples.14As the results in Table5demonstrate, we cannot reject the scalar invariance model (χ2= 205.69, DF = 129, χ2/DF= 1.594, CFI = 0.907, RMSEA = 0.049, PCLOSE = 0.541, SRMR= 0.082) (Hu and Bentler 1999;Marsh et al. 2004). According toChen’s(2007) crite-ria, none of the global fit measures decreased in fit beyond the critical recommended values. Now that (partial) scalar invariance was guaranteed, it would be interesting to test whether value means differed across the samples. As configural, metric, and scalar invariance has been confirmed, the comparison of latent mean values between the survey samples is allowed. Table6displays the latent mean differences for the four constructs. The mean values were set to zero in the online survey and were freely estimated for the PAP sample. Results show significant mean differences for the constructs openness to change (Estimate= −0.410, p = 0.007), self-enhancement (Estimate = −0.261, p = 0.046), and conservation (Esti-mate= 0.345, p = 0.003). For the construct self-transcendence we found no significant mean difference (Estimate= −0.078, p = 0.383).
As differences have been found for the latent means of both samples for the constructs openness to change, self-enhancement, and conservation, the hypothesis that the latent means for value questions are identical in both groups is rejected. Individuals in the PAP survey display higher levels of conservation and lower levels of openness to change and self enhance-ment but similar levels of self-transcendence.
14We did not constrain all the intercepts to be equal as some of them were significantly different. At least two
intercepts per factor were set equal. This corresponds with the minimal conditions for partial scalar invariance (seeByrne et al. 1989;Steenkamp and Baumgartner 1998).
Table 6 Latent mean differences
of the four constructs (reference group: online sample survey)
* p< 0.05 Latent mean difference Openness to change −.410∗ Self-enhancement −.261∗ Self-transcendence −.078 Conservation .345*
7 Discussion and conclusion
The examination of values as explanatory variables of attitudes, opinions, and behavior has increased over the last decade. The inclusion of a 21-item battery to measure values in the ESS in 2002 has proven fertile ground for a considerable number of studies investigating this data. Since its introduction, researchers have also applied this questionnaire to collect their own data. Therefore, it is crucial to find out whether, with different techniques of data collec-tion, value constructs are invariant. The goal of the present study was to assess whether the human values questionnaire (Schwartz 1992), as applied in the ESS, displays measurement invariance across PAP and online surveys. If this is the case, researchers would be able to pool the data on values collected with these two methods with confidence.
Data was collected using PAP and online surveys. After conducting several modifications, the models provided support for configural, metric, and partial scalar invariance of the value constructs across the two samples. However, the test was conducted on only 13 items, as other items did not display sufficiently high factor loadings on the value dimensions in the two groups. This measurement problem calls into question the quality of the items that measure values (see alsoKnoppen and Saris 2007). Nevertheless, these are still good news for value researchers, as they provide some empirical justification for combining and comparing value data from online and PAP surveys at least for the questions that were included in the model. However, such an activity should be done with caution since the samples were not com-pletely invariant. There were significant latent mean differences for the values openness to change, self-enhancement, and conservation. This result opposed previous findings that suggested equal means across PAP and online surveys (Rietz and Wahl 2002). In separate regression analyses we tested whether and to what extent the mode of data collection (online or PAP) was responsible for the variance of the value questions while controlling for soci-odemographic characteristics of the respondents. It turned out that in most cases, the dummy variable indicating the data collection technique was not significant. This finding could point out that mean differences may be traced back, to a large extent, to differences in the com-position of respondents in each sample. It is possible that with large and random samples we would have found no mean differences (Bandilla 2002). Future replications of this study should address this issue and test whether invariance still holds.
The question of social desirability remains open: to what extent is it responsible for the mean differences we found between the values? It could well be the case that differences in the means were also partly affected by differential levels of social desirability in the two samples. Some authors have indicated that in online surveys respondents are less prone to display social desirability and thus provide more authentic responses (Rietz and Wahl 2002) but, by contrast, others have suggested that the two methods are similarly susceptible to social desirability (Richman et al. 1999). However, since our study did not include measurements of socially desirable answering behavior, we could not test this possibility. Its relationship
to invariance of ‘delicate’ questions across different modes of data collection remains an exciting topic for future research.
Based on these findings we conclude that the methods of measurement are essentially invariant for the values instrument. In this study we focused on only two modes of data collection, PAP and online surveys. It certainly would be valuable if future studies will try to replicate our findings and include additional techniques of inquiry and additional instruments. Such techniques may include, for instance, telephone and personal interviews, and their per-formance could be compared with that of online surveys. Further findings of invariance will encourage the future use of online surveys. Despite their limitations, their advantages especially in terms of reduced costs and flexibility seem to be promising.
Acknowledgements The authors would like to thank Lisa Trierweiler for the English proof of the manu-script.
References
Arbuckle, J.L.: Amos 6.0 User’s Guide. SPSS, Chicago (2005)
Bachmann, D.P., Elfrink, J., Vazzana, G.: E-mail and snail mail face off in rematch. Mark. Res. 11(4), 11–15 (1999)
Bandilla, W. : Web surveys—an appropriate mode of data collection for the social sciences?. In: Batinic, B., Reips, U.-D., Bosnjak, M. (eds.) Online Social Sciences, pp. 1–8. Hogrefe & Huber Publishers, Seattle (2002)
Bandilla, W., Bosnjak, M., Altdorfer, P.: Effekte des Erhebungsverfahrens? Ein Vergleich zwischen einer web-basierten und einer schriftlichen Befragung zum ISSP Modul Umwelt. ZUMA-Nachrichten 49, 7–28 (2001)
Batinic, B.: Fragebogenuntersuchungen im Internet. Shaker, Aachen (2001)
Batinic, B., Bosnjak, M.: Fragebogenuntersuchungen im Internet. In: Batinic, B. (ed.) Internet für Psycholo-gen, pp. 287–318. Hogrefe, Göttingen (2000)
Billiet, J., Meuleman, B.: Religious diversity in Europe and its relation to social attitudes and value orienta-tions. Paper presented at the mini-conference on Index construction for cross cultural research, ESADE Business School, Universitat Ramon Llull, Barcelona, Spain, 13–15 February 2008
Bollen, K.A.: Structural Equations with Latent Variables. Wiley, New York (1989)
Buchanan, T.: Online assessment: desirable or dangerous?. Prof. Psychol. Res. Pract. 33, 148–154 (2002) Buchanan, T., Smith, J.L.: Using the Internet for psychological research: personality testing on the World-Wide
Web. Br. J. Psychol. 90, 125–144 (1999)
Byrne, B.M.: Structural Equation Modeling with AMOS: Basic Concepts, Applications and Programming. Erlbaum, Mahwah (2001)
Byrne, B.M., Shavelson, R.J., Muthén, B.: Testing for the equivalence of factor covariance and mean structures: The issue of partial measurement invariance. Psychol. Bull. 105, 456–466 (1989)
Chen, F.F.: Sensitivity of goodness of fit indices to lack of measurement invariance. Struct. Eq. Model. 14, 464–504 (2007)
Davidov, E., Meuleman, B., Billiet, J., Schmidt, P.: Values and support for immigration. A cross-country comparison. Eur. Sociol. Rev. 24, 583–599 (2008a).
Davidov, E., Schmidt, P., Schwartz, S.H.: Bringing values back. In: The Adequacy of the European Social Survey to Measure Values in 20 Countries. Public Opin. Q. 72(3), 420–445 (2008b)
De Beuckelaer, A.: Measurement invariance issues in internationalmanagement research. Unpublished disser-tation, Limburg, Netherlands (2005)
De Beuckelaer, A. Lievens, F.: Measurement equivalence of paper-and-pencil and internet organisational surveys: a large scale examination in 16 countries. Appl. Psychol: Int. Rev. 58, 336–361 (2009) Dillman, D.A., Bowker, D.K.: The web questionnaire challenge to survey methodologists. In: Reips, U.-D.,
Bosnjak, M. (eds.) Dimensions of Internet Science, pp. 159–177. Papst, Lengerich (2001)
Fenlason, K.J., Suckow-Zimberg, K. : Online surveys. Critical issues in using the web to conduct surveys. In: Kraut, A.I. (ed.) Getting Action from Organizational Surveys, pp. 183–212. Jossey-Bass, San Franciso (2006)
Ferrando, P.J., Lorenzo-Seva, U.: IRT-based factor analytic procedures for testing the equivalence of paper-and-pencil and internet-administered questionnaires. Psychol. Methods 10, 193–205 (2005)
Groves, R.M.: Survey Errors a nd Survey Costs. Wiley, New York (1989)
Hauptmanns, P. : Grenzen und Chancen von quantitativen Befragungen mit Hilfe des Internet. In: Batinic, B., Werner, A., Graf, L., Bandilla, W. (eds.) Online Research: Methoden, Anwendungen und Ergebnisse, pp. 21–38. Hogrefe, Göttingen (1999)
Hitlin, S., Piliavin, J.A.: Values: reviving a dormant concept. Ann. Rev. Sociol. 30, 359–393 (2004) Hu, L.T., Bentler, P.M.: Cutoff criteria for fit indexes in covariance structure analysis: Conventional criteria
versus new alternatives. Struct. Eq. Model. 6, 1–55 (1999)
Joinson, A.: Social desirability, anonymity, and internet-based questionnaires. Behav. Res. Methods Instrum. Comp. 31(3), 433–438 (1999)
Jöreskog, K.G.: Simultaneous factor analysis in several populations. Psychometrika 36, 409–426 (1971) Joreskog, K.G.: Testing structural equation models. In: Bollen, K.A., Long, J.S. (eds.) Testing Structural
Equation Models. Sage, Newburry Park (1993)
Kline, R.B.: Principles and Practice of Structural Equation Modelling. Guilford Press, New York (1998) Kluckhohn, C.: Values and value-orientations in the theory of action: an exploration in definition and
clas-sification. In: Parsons, T., Shils, E. (eds.) Towards a General Theory of Action, pp. 338–433. Harvard University Press, Cambridge, MA (1951)
Knoppen, D., Saris, W.: Measuring value orientations across nations: analysis of the quality of the european social survey for measuring values. Paper presented at the 2nd European Survey Research Association (ESRA) conference. Prague, Czech Republic, June 2007
Marsh, H.W., Hau, K.T., Wen, Z.: In search of golden rules: Comment on hypothesis-testing approaches to set-ting cutoff values for fit indexes and dangers in overgeneralizing hu and bentler’s (1999) findings. Struct. Eq. Model. 11, 320–341 (2004)
Meredith, W.: Measurement invariance, factor analysis and factorial invariance. Psychometrika 58, 525–543 (1993)
Ployhart, R.E., Weekley, J.A., Holtz, B.C., Kemp, C.: Web-based and paper-and-pencil testing of appli-cants in a proctored setting: are personality, biodata, and situational judgment tests comparable?. Pers. Psychol. 56, 733–752 (2003)
Preckel, F., Thiemann, H.: Online- versus paper-pencil version of a high potential intelligence test. Swiss J. Psychol. 62, 131–138 (2003)
Richman, W.L., Kiesler, S., Weisband, S., Drasgow, F.: A meta-analytic study of social desirability dis-tortion in computer administered questionnaires, traditional questionnaires and interviews. J. Appl. Psychol. 84, 754–775 (1999)
Rietz, R., Wahl, S.: Comparison of psychologist’s self image and their image in the internet and in print. In: Batinic, B., Reips, U.D., Bosnjak, M. (eds.) Online Social Sciences, pp. 135–150. Hogrefe & Huber Publishers, Gottingen (2002)
Rokeach, M.: The Nature of Human Values. Wiley, New York (1973)
Sackmary, B.: Internet survey research: Practices, problems, and prospects. In: Proceedings of the Amer-ican Marketing Association Summer Educator’s Conference, Boston.http://faculty.buffalostate.edu/ sackmabd/sackmary/Ama98.pdf. Cited 2 February 2008 (1998)
Sagiv, L., Schwartz, S.H.: Value priorities and readiness for out-group social contact. J. Pers. Soc. Psychol.
69(3), 437–448 (1995)
Salzberger, T.: Statistically equivalent, yet different in meaning: different measurement model representa-tions—shown by means of the AGGLO-Scale. In: Reed, P.W., Luxton, S.L., Shaw, M. R. (eds.) Pro-ceedings of the ANZMEC 1997, Australia New Zealand Marketing Educators Conference, vol. 2, pp. 707–728, Department of Marketing, Monash University, Caulfield East, Vic., Australia (1997) Saris, W.E. : Measurement models in sociology and political science. In: Cudeck, R., du Toit, S., Sörbom,
D. (eds.) Structural Equation Modeling: Present and Future, pp. 97–115. Scientific Software Interna-tional, Chicago (2001)
Schnell, R.: Nonresponse in Bevölkerungsumfragen. Ausmaß, Entwicklung und Ursachen. Leske + Budrich, Opladen (1997)
Schnell, R., Hill, P.B., Esser, E.: Methoden der Empirischen Sozialforschung. Oldenburg, München (1999) Schwartz, S.H. : Universals in the content and structure of values: theory and empirical tests in 20
countries. In: Zanna, M. (ed.) Advances in Experimental Social Psychology, pp. 1–65. Academic Press, New York (1992)
Schwartz, S.: Beyond individualism/collectivism: new cultural dimensions of values. In: Kim, U., Triandis, H.C., Kagitcibasi, C., Choi, S.-C., Yoon, G. (eds.) Individualism and Collectivism: Theory, Methods, and Applications, pp. 85–119. Newbury Park, Sage (1994)
Schwartz, S.H.: A proposal for measuring value orientations across nations. Chapter 7 in the ESS Questionnaire Development Report.http://www.europeansocialsurvey.org(2003)
Schwartz, S.H.: Basic human values: their content and structure across countries. In: Tamayo, A., Porto, J.B. (eds.) Valores e Comportamento nas Organizações, pp. 21–55. Vozes, Petrópolis (2005a)
Schwartz, S.H.: Robustness and fruitfulness of a theory of universals in individual human values. In: Tamayo, A., Porto, J.B. (eds.) Valores e Comportamento nas Organizações, pp. 21–55. Vozes, Petrópolis (2005b) Schwartz, S., Boehnke, K.: Evaluating the structure of human values with confirmatory factor analysis. J. Res.
Pers. 38, 230–255 (2004)
Schwartz, S., Sagiv, L.: Identifying culture-specifics in the content and structure of values. J. Cross-Cult. Psychol. 26(1), 92–116 (1995)
Sörbom, D.: A general method for studying differences in factor means and factor structure between groups. Br. J. Math. Stat. Psychol. 27, 229–239 (1974)
Sörbom, D.: An alternative to the methodology for analysis of covariance. Psychometrika 43, 381–396 (1978) Steenkamp, J.B., Baumgartner, H.: Assessing measurement invariance in cross national consumer research.
J. Consum. Res. 25, 78–90 (1998)
Vandenberg, R.L., Lance, C.E.: A review and synthesis of the measurement invariance literature: suggestions, practices, and recommendations for organizational research. Organ. Res. Methods 3(1), 4–70 (2000) Weis, C.H., Steinmetz, P.: Marktforschung 5. Auflage. Vol. 25, Friedrich Kiehl Verlag, Ludwigshafen (2002) Wilhelm, O., McKnight, P.E. : Ability and achievement testing on the world wide web. In: Batinic, B.,