Received February 16, 2004 Address for correspondence: LUTZ BORNMANN
Swiss Federal Institute of Technology Zurich (ETH Zurich), Professorship for Social Psychology and Research on Higher Education, Zähringerstr. 24, CH-8092 Zurich, Switzerland
E-mail: [email protected]
Social origin and gender of doctoral degree holders
Impact of particularistic attributes in access to and in later career
attainment after achieving the doctoral degree in Germany
LUTZ BORNMANN,a JÜRGEN ENDERSb
a ETH Zurich, Professorship for Social Psychology and Research on Higher Education, Zurich (Switzerland) b University of Twente, Center for Higher Education Policy Studies (CHEPS), Twente (The Netherlands)
Within the scope of this article we went further into the question to what extent particularistic attributes – social origin and gender – can affect selection processes (1) in access to and (2) in later career attainment after achieving the doctoral degree. The analyses are based on a questionnaire survey (n = 2 244) among doctoral degree holders achieving the doctoral degree in six selected disciplines (biology, electrical engineering, German studies, mathematics, social sciences, and business studies/ economics) at German universities. In terms of our first object of investigation, the analyses show that in four out of six disciplines doctoral degree holders are a selected group compared to university graduates with regard to both social origin and gender. In terms of our second object of investigation – the impact of particularistic attributes on several indicators of further career attainment after achieving the doctoral degree (career inside or outside higher education and science, career position and income) – the results point to a stronger impact of gender compared to social origin.
Introduction
In the empirical research regarding the impact of particularistic attributes on scientific careers, gender has been the most studied attribute. Meanwhile many studies exist showing gender as a potential source of bias by using many different indicators (e. g. ANDERSEN, 2001; BLACK, 2002; BORNMANN, 2004; BOWDEN, 2000; FOX, 1994; HESS, 1997; LONG & FOX, 1995; NEUBAUER, 2001; OSBORN et al., 2001;PRPIC, 2003;
PRUTHI et al., 1997). DEWANDRE (2002) emphasizes in this context: “Women are facing discrimination in their scientific careers. The forms of discrimination are subtle, cumulative, and, for the most part, unconscious” (p. 278). LETA & LEWISON (2003) point out more specific: “Among the most frequent findings in the literature of ‘gender and science’ are that (i) male scientists usually outperform females and (ii) females have less access to high academic positions as well as to research resources and
high salaries” (p. 339 and p. 340). For SONNERT (1996), SONNERT & HOLTON (1996)
and SONNERT et al. (1995) gender as a potential source of bias can have two possible causes: “The deficit model concerns formal and informal exclusions of women scientists from resources. It emphasizes structural obstacles – legal, political, and social – that exist (or existed earlier) within the social system of science” (SONNERT, 1996,
p. 55). In contrast, the difference model focuses on deeply rooted, gender specific differences in the occupational and private goals, are “they innate or the result of socialization and cultural values. These differences are said to make women less likely to aspire to science careers and less likely to achieve success in them. Widely discussed in the psychological literature, these gender differences include women’s lower levels of career orientation, ambition, and aggressiveness” (SONNERT, 1996, p. 55 and p. 56;
see for further reasons for differential attainment: LONG & FOX, 1995).
Social origin is a classical theme in educational and occupational research that explores mechanisms of social mobility. Freshmen and students are one of the most examined groups in empirical research on social background and social accounting (e. g. LEWIN et al., 1998). Nevertheless, only few studies have been undertaken that address social origin of university graduates achieving a doctoral degree and the effect of social origin on their scientific careers. ANDERSEN (2001) demonstrates, for example,
evidences for a meaningful class bias in recruitment of Danish researchers and for a weaker one concerning later career attainment. In the following, we wish to contribute to fill this gap focussing on doctoral degree holders achieving the doctoral degree at German universities. For the purpose of comparison, we include the gender perspective, which is more extensively analysed in earlier studies. The aim is to test the assumption that particularistic attributes are effective in access to the doctoral degree as well as in later career attainment of doctoral degree holders.
Doctoral degree and career: the approach of the study
In 1998 we started a research project at the Centre for Research on Higher Education and Work at the University of Kassel supported by a basic research grant of the Deutsche Forschungsgemeinschaft (DFG). The aim of this study, Doctoral Degree and Career: Training, Professional Life Course and Success of Doctoral Degree Holders, was to analyse the status of the doctoral degree in the framework of the relationship between higher education and the labour world. The study is based mainly on a questionnaire survey circulated among a target group of doctoral degree holders achieving the doctoral degree in six selected disciplines (biology, electrical engineering, German studies, mathematics, social sciences, and business studies/ economics) at German universities. These disciplines cover a broad range of disciplines in terms of major fields of study, the so-called doctoral quota (that is the percentage of graduates going successfully for a doctoral degree in the respective discipline) ranging from less
than 10% in business studies/ economics to more than 60% in biology, and female participation among doctorates, which ranges from less than 10% in electrical engineering to nearly 50% in German studies. In order to analyse changes over time, three different cohorts of doctoral degree holders (1979/1980, 1984/1985, 1989/1990) in these disciplines were surveyed. Thus, the study design allows the analysis of the outcomes of the doctoral degree on the labour market in the long run covering a minimum period of ten years after achieving the doctoral degree for all selected cohorts. The survey was undertaken in 1999 and 2 244 doctoral degree holders (52% of survey population) responded to our questionnaire instrument. The questionnaire covers five major thematic areas: (1) structures, conditions and outcomes of the doctoral training; (2) transition from higher education to work; (3) further professional career and mobility; (4) current employment and job situation; and (5) educational and social background.
In order to analyse the impact of the doctoral degree on professional careers of academics, another survey was undertaken in 1999 involving a comparison group of university graduates (without doctoral degree) in the same disciplines from two selected cohorts (1979/80 and 1984/85). 1 895 university graduates responded to this questionnaire instrument (59% of survey population).1
In the following we first present results on the effects of social origin and gender on access to the doctoral degree. Second, we look at long term effects of doctoral degree holders’ social origin and gender on their later career success. For these purposes we attempt two basic comparisons: (1) we compare three different doctoral degree holders’ cohorts from our study (1979/80, 1984/85, 1989/90). Comparisons between different cohorts make it possible to examine processes of opening and closure of the doctoral degree for university graduates with different social origin and gender. (2) We compare doctoral degree holders with university graduates from different cohorts. In this comparison doctoral degree holders are compared with graduates leaving higher education four to five years earlier. Because possible career advancement of university graduates during these years must be taken into consideration, we compare doctoral degree holders and graduates having about the same age. Comparisons between doctoral degree holders and university graduates may help to answer the question whether doctoral degree holders are a selected group compared to university graduates with regard to social origin and gender.
1 An overview on the study and its findings is published in ENDERS & BORNMANN, 2001. Further articles
(BORNMANN & ENDERS, 2002; ENDERS & BORNMANN, 2002a, 2002b, and 2002c) focus on specific aspects of our study, like time to doctoral degree or international mobility of doctoral degree holders.
Social origin and access to the doctoral degree
In order to measure social origin and to facilitate comparisons, we applied a three-level categorization based on father’s occupational position and parents education, which is often used in German studies (BLOSSFELD, 1993; MEULEMANN, 1995).2 These
categories are explained in the notes of Table 1, which shows the frequency distributions for doctoral degree holders’ social origin broken down by cohort and discipline. Pearson’s chi-squared test statistic demonstrates that the relationship between social origin and discipline as detailed in Table 1 is not in fact statistically significant for cohorts 1979/80 and 1984/85: cohort 1979/80: 2 (10, n = 644) = 14.2, p = 0.2; cohort 1984/85: 2 (10, n = 658) = 5.4, p = 0.9. With regard to cohort 1989/90,
the relationship between both variables is statistically significant: 2 (10, n = 723) =
20.7, p < 0.05. Thus, by a statistical view, subject choices of doctoral degree holders graduating in 1989 or 1990 were apparently undertaken under the influence of social origin.
This statistical result, however, does not show the extent to which social origin influences subject choice. Pearson’s chi-squared test statistic only expresses whether attributes of two variables may or may not be statistically significant and does not give the strength of the relationship between the variables. As the result of the statistical significance test is dependent from sample size (BREDENKAMP, 1970; SEDLMEIER, 1996) and “statistical significance does not mean real life importance” (CONROY, 2002,
p. 290), the strength of the relationship is more interesting and important for the interpretation of empirical findings in social sciences. For calculating the strength of relationships we have to employ additionally measures of association. REYNOLDS
(1977, p. 32) recommends – because of the weaknesses of measures based on chi-square – proportional-reduction-in-error (pre) measures, like Goodman and Kruskal’s tau ( ; GOODMAN & KRUSKAL, 1954, 1959, 1963 and 1972). If the dependent and
independent variables are not statistically associated, the categories of the independent variable do not supply any information about the dependent categories and = 0.00. When they are completely related, = 1.0.
If we look on the notes in Table 1, the values of Goodman and Kruskal’s tau are 0.00 and 0.01, respectively. Thus, knowing doctoral degree holders’ social origin reduces errors in predicting their discipline by 0% resp. 1%. Apparently, both variables are independent in every cohort. These results do not indicate that the choice of certain disciplines is particularly susceptible to social origin hypothesized as a potential bias and to a dominant educational heredity.
2 In our questionnaire we asked for the highest general school leaving certificate, the highest vocational
Table 1. Social origin of doctoral degree holders by discipline and cohort (in percent) Paternal social
classa Biology engineering Electrical Germanstudies Mathematics sciencesSocial Economics Business/
Cohort 1979/801 1 32 21 30 30 43 29 2 35 41 34 31 30 41 3 33 38 36 39 27 30 Total 100 100 100 100 100 100 n 116 105 112 98 91 122 Cohort 1984/852 1 29 21 27 28 24 28 2 31 35 38 31 39 32 3 40 44 35 41 37 40 Total 100 100 100 100 100 100 n 120 101 109 117 103 108 Cohort 1989/903 1 27 19 23 20 26 40 2 33 45 37 40 33 31 3 40 36 40 41 41 29 Total 100 100 100 100 100 100 n 114 118 119 138 126 108 Notes:
a Level 1: Salaried employees or civil servants with leadership functions or self-employed in liberal profession
or large business + higher education degree. Level 2: Medium level salaried employees or civil servants or self-employed + entrance qualifications for higher education or secondary school level I certificate with vocational training. Level 3: Lower level salaried employees, civil servants or workers + secondary school level or secondary school level I certificate without vocational training.
1 2 (10, n = 644) = 14.1, p = 0.2, = 0.00 2 2 (10, n = 658) = 5.4, p = 0.9, = 0.00 3 2 (10, n = 723) = 20.7, p < 0.05, = 0.01
In order to study changes over time – processes of opening and closure of the doctoral degree for university graduates with different social origin – we compare frequency distributions of different cohorts within every discipline: cohort 1979/80 to 1984/85, cohort 1979/80 to 1989/90 and cohort 1984/85 to 1989/90. We use two statistics to assess differences in distributions between cohorts: the chi-squared test of goodness of fit and the Gini index (GI). The chi-squared test of goodness of fit proves the statistical significance of differences (BORTZ et al., 2000;SACHS, 2004). The Gini index shows the strength of differences in distributions. As we explicate above with
regard to Goodman and Kruskal’s tau, the Gini index is more important and provides “practically relevant” information for interpreting differences compared to the chi-squared test.
In normal use the Gini index is based on the Lorenz curve, which shows the degree of inequality in frequency distributions such as personal incomes (COWELL, 1977). If
the frequency distribution is equal, the Lorenz curve coincides with the 45 degree line in the Cartesian coordinate system. The Gini index measures the gap between the Lorenz curve and the 45 degree line. If the distribution is equal, the Gini index would be 0, since the Lorenz curve would match the 45 degree line perfectly. The higher the Gini index the greater is the distance and the more unequal the distribution. In practice, frequency distributions are usually characterized as unequal if the Gini index falls between 0.2 and 0.4.
In the new use of LEE (1999; see also STATA CORPORATION, 2003a, p. 410 to
p. 412), the Gini index shows the degree of inequality between different frequency distributions. Therefore, we use the Gini index for comparing social origin’s frequency distributions of different cohorts. If the cohort separates perfectly between frequency distributions, the corresponding Lorenz curve would coincide with the x-axis throughout and then jump to the uppermost point (1, 1). In the other case, the Lorenz curve would lay near the diagonal line and the Gini index is approaching 0 (see the case in Figure 1).
Figure 1. The Lorenz curve of cumulative percents of doctoral degree holders’ social origin in biology: x-axis = cohort 1979/80, y-axis = cohort 1984/85
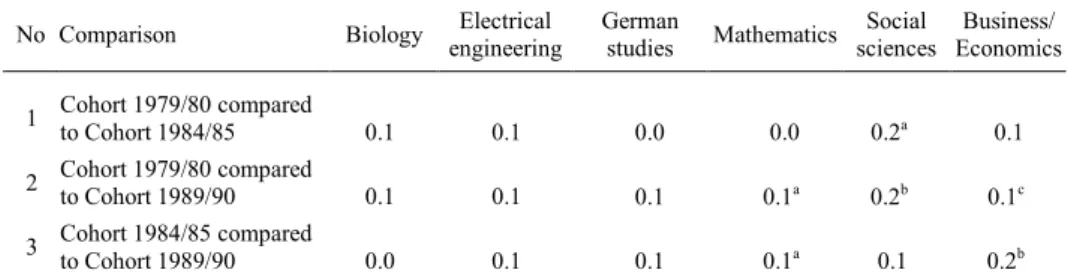
Table 2. Comparisons of social origin’s distributions between different cohorts of doctoral degree holders by discipline (Gini index and chi-squared test of goodness of fit)
No Comparison Biology engineeringElectrical Germanstudies Mathematics sciencesSocial EconomicsBusiness/
1 Cohort 1979/80 comparedto Cohort 1984/85 0.1 0.1 0.0 0.0 0.2a 0.1
2 Cohort 1979/80 comparedto Cohort 1989/90 0.1 0.1 0.1 0.1a 0.2b 0.1c
3 Cohort 1984/85 comparedto Cohort 1989/90 0.0 0.1 0.1 0.1a 0.1 0.2b
Notes:
Row 1: a 2 (df = 2) = 14.6, p < 0.01
Row 2: a 2 (df = 2) = 7.8, p < 0.05; b 2 (df = 2) = 18.3, p < 0.001; c 2 (df = 2) = 7.5, p < 0.05
Row 3: a 2 (df = 2) = 7.4, p < 0.05; b 2 (df = 2) = 8.6, p < 0.05
The remaining comparisons between distributions are statistically non-significant.
Table 2 shows the Gini indices and the results of the chi-squared tests for the comparisons between different cohorts, broken down by discipline. Three Gini indices are equal to 0.2: meaningful differences are pointed out in social sciences between the eldest and medium resp. youngest cohort (comparisons 1 and 2) and in business studies/ economics between the eldest and medium cohort (comparison 3). For all these comparisons the chi-squared tests show statistically significant differences. For the interpretation of these results we look on Table 1. Over time, we could statistically hedge for social sciences, (1) increasing rates of doctoral degree holders from a low- or medium-level paternal social class and decreasing rates of doctoral degree holders from a high-level paternal social class. (2) In business studies/ economics a trend is visible in the opposite direction: doctoral degree holders increasingly come from a high- and decreasingly from a low-level paternal social class.
For the remaining 15 comparisons of distributions in Table 2 the Gini indices do not show differences, although in three cases the chi-squared test is statistically significant. Differences between the medium resp. eldest and youngest cohort in mathematics as well as the medium and youngest cohort in business studies/ economics exist, but the degree of differences is not meaningful in a practical sense.
In a second analysis we compare doctoral degree holders with university graduates without a doctoral degree from different cohorts: doctoral degree holders from cohort 1984/85 with university graduates from cohort 1979/80 and doctoral degree holders from cohort 1989/90 with university graduates from cohort 1984/85. Both comparisons may help determine whether doctoral degree holders are a selected group compared to university graduates with regard to social origin. The frequency distributions in Table 3 show social origin of degree holders by discipline and cohort. These findings are taken from our second questionnaire survey of university graduates achieving the degree at German universities (see previous section).
Table 3. Social origin of university graduates (without a doctoral degree) by discipline and cohort (in percent) Paternal social
classa Biology engineeringElectrical Germanstudies Mathematics sciencesSocial EconomicsBusiness/
Cohort 1979/80 1 24 12 20 14 15 16 2 37 37 29 26 40 28 3 39 51 51 60 45 56 Total 100 100 100 100 100 100 n 136 142 129 124 91 164 Cohort 1984/85 1 23 14 22 12 21 17 2 26 30 30 28 34 37 3 51 56 48 60 45 46 Total 100 100 100 100 100 100 n 167 170 152 190 155 181 Note:
a Categories are explained in the note of Table 1.
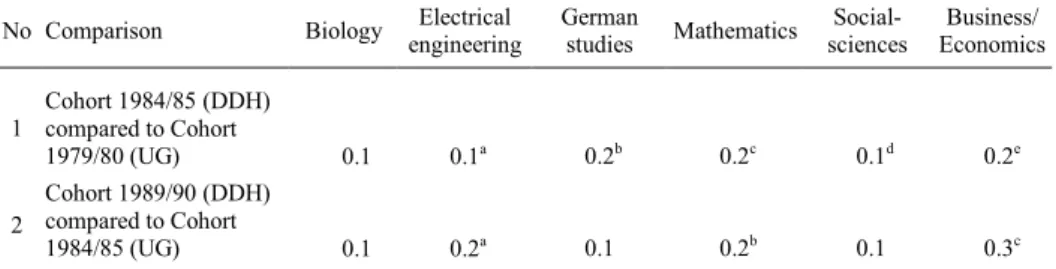
Table 4. Comparisons of social origin’s distributions between different cohorts of doctoral degree holders (DDH) and university graduates (UG) by discipline (Gini index and chi-squared test of goodness of fit) No Comparison Biology engineeringElectrical Germanstudies Mathematics sciencesSocial- EconomicsBusiness/
1 Cohort 1984/85 (DDH) compared to Cohort 1979/80 (UG) 0.1 0.1a 0.2b 0.2c 0.1d 0.2e 2 Cohort 1989/90 (DDH) compared to Cohort 1984/85 (UG) 0.1 0.2a 0.1 0.2b 0.1 0.3c Notes: Row 1: a 2 (df = 2) = 6.1, p < 0.05; b 2 (df = 2) = 11.3, p < 0.01; c 2 (df = 2) = 23.7, p < 0.001; d 2 (df = 2) = 6.8, p < 0.05; e 2 (df = 2) = 16.9, p < 0.001 Row 2: a 2 (df = 2) = 18.7, p < 0.001; b 2 (df = 2) = 23.8, p < 0.001; c 2 (df = 2) = 37.6 p < 0.001
The remaining comparisons between distributions are statistically non-significant.
Results of the chi-squared tests and the Gini indices for comparisons between different cohorts of doctoral (see Table 1) and non-doctoral (see Table 3) degree holders are displayed in Table 4. Table 4 shows in four out of six disciplines that doctoral degree holders are a selected group compared to university graduates. Doctoral degree holders in electrical engineering (GI = 0.2; comparison 2), German studies (GI = 0.2; comparison 1), mathematics (GI = 0.2) and business studies/ economics (GI = 0.2 and
GI = 0.3, respectively) derive more frequently from a high-level paternal social class than university graduates in the same discipline. The Gini indices point out meaningful unequal distributions in these comparisons and the results of the chi-squared test of goodness of fit are statistically significant.
Only in biology, electrical engineering (comparison 1), German studies (comparison 2) and social sciences meaningful inequalities are not detected in distributions of different levels of paternal social classes. The effect of social origin is very weak (GI = 0.1) and – with two exceptions – the results of the chi-squared test of goodness of fit are statistically non-significant.
Gender and access to the doctoral degree
In the Introduction we discussed the empirical literature about gender as a potential source of bias in scientific careers. Most of the studies point out statistical evidences for discriminations against female scientists. For our examination of possible gender bias we again chose two approaches and compared (1) three cohorts of doctoral degree holders and (2) different cohorts of doctoral degree holders and university graduates without a doctoral degree.
Table 5 shows frequency distributions for doctoral degree holders’ gender broken down by cohort and discipline. In each cohort the relationship between gender and discipline is in fact statistically significant: cohort 1979/80: 2 (5, n = 683) = 65.8, p < 0.001; cohort 1984/85: 2 (5, n = 688) = 86.0, p < 0.001; cohort 1989/90: 2 (5,
n = 756) = 69.0, p < 0.001. According to Goodman and Kruskal’s tau, knowing gender of doctoral degree holders reduces errors in predicting disciplines approximately 2% – 3% ( = 0.02 and = 0.03, respectively). Thus, the chi-squared tests point out statistically significant results and Goodman and Kruskal’s tau values show a weak explanation power of gender for doctoral degree holders’ discipline.
For changes over time, we again compare frequency distributions of different cohorts within each discipline on the basis of two measures: the chi-squared test and the Gini index. Table 6 shows the Gini indices and the results of the chi-squared test of goodness of fit for comparisons between different cohorts, broken down by discipline. Although the chi-squared test results only point out in four out of 18 comparisons statistically significant differences in distributions, all Gini indices are less than 0.2 and do not show meaningful changes in distributions of female and male doctoral degree holders over time.
Table 5. Gender of doctoral degree holders by discipline and cohort (in percent)
Gender Biology engineeringElectrical Germanstudies Mathematics sciencesSocial- EconomicsBusiness/ Cohort 1979/801 Female 36 2 34 11 28 15 Male 64 98 66 89 72 85 Total 100 100 100 100 100 100 n 120 112 123 104 97 127 Cohort 1984/852 Female 34 – 46 14 25 14 Male 66 100 54 86 75 86 Total 100 100 100 100 100 100 n 122 106 116 125 107 112 Cohort 1989/903 Female 33 2 45 25 33 19 Male 67 98 55 75 67 81 Total 100 100 100 100 100 100 n 115 123 128 145 132 113 Notes: 1 2 (5, n = 683) = 65.8, p < 0.001, = 0.02 2 2 (5, n = 688) = 86.0, p < 0.001, = 0.03 3 2 (5, n = 756) = 69.0, p < 0.001, = 0.02
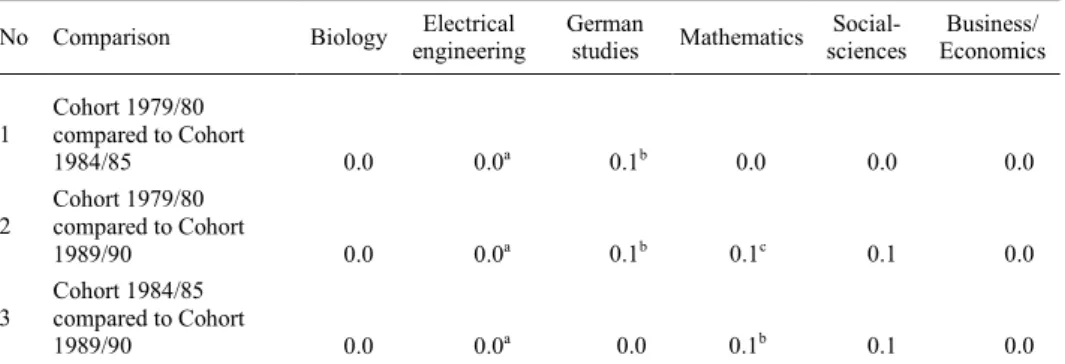
Table 6. Comparisons of gender distributions between different cohorts of doctoral degree holders by discipline (Gini index and chi-squared test of goodness of fit)
No Comparison Biology engineeringElectrical Germanstudies Mathematics sciencesSocial- EconomicsBusiness/
1 Cohort 1979/80 compared to Cohort 1984/85 0.0 0.0a 0.1b 0.0 0.0 0.0 2 Cohort 1979/80 compared to Cohort 1989/90 0.0 0.0a 0.1b 0.1c 0.1 0.0 3 Cohort 1984/85 compared to Cohort 1989/90 0.0 0.0a 0.0 0.1b 0.1 0.0 Notes:
aMore than 20% of cells in the table have expected frequences less than 5. The chi-squared test of goodness of
fit was not computed.
Row 1: b 2 (df = 1) = 6.9, p < 0.01
Row 2: b 2 (df = 1) = 7.1, p < 0.01; c 2 (df = 1) = 31.1, p < 0.001
Row 3: b 2 (df = 1) = 15.6, p < 0.001
In the next step we compare gender distributions of doctoral degree holders and university graduates (without a doctoral degree) from different cohorts: doctoral degree holders from cohort 1984/85 with university graduates from cohort 1979/80 and doctoral degree holders from cohort 1989/90 with university graduates from cohort 1984/85. Such comparisons may answer the question whether the group of doctoral degree holders is more male dominated than the group of university graduates in the same discipline. The frequency distributions in Table 7 show university graduates’ gender by discipline and cohort.3
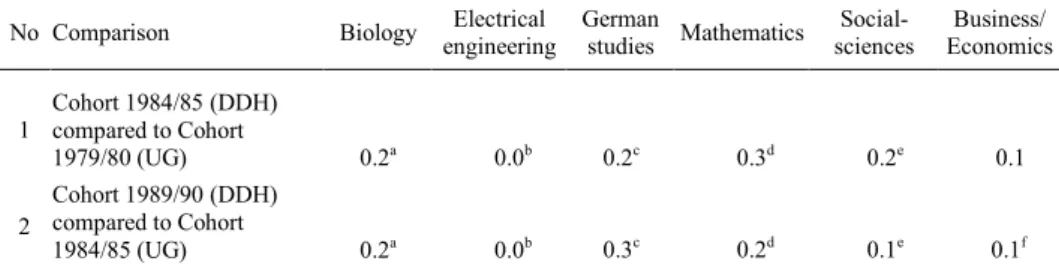
The results of the chi-squared tests of goodness of fit and the Gini indices for comparisons between different cohorts of doctoral (see Table 5) and non-doctoral (see Table 7) degree holders are displayed in Table 8. The table points out that in the majority of disciplines doctoral degree holders are selected groups compared to university graduates. Doctoral degree holders in biology (GI = 0.2), German studies (GI = 0.2 and GI = 0.3, respectively), mathematics (GI = 0.3 and GI = 0.2, respectively) and social sciences (GI = 0.2; comparison 1) are more frequently males than university graduates in the same discipline. In these disciplines the Gini indices show meaningful unequal distributions between doctoral degree holders and university graduates and the results of the chi-squared tests are statistically significant.
In electrical engineering, in business studies/ economics and in social sciences (comparison 2) meaningful inequalities are not detected in distribution comparisons: the Gini indices are 0.1 or below. Though in two of these cases (social sciences, comparison 2, and business/ economics, comparison 2) the results are statistically significant, the effects are very weak.
3 The findings in Table 7 are taken from German official statistics for the German higher education sector
(Statistisches Bundesamt Wiesbaden, since 1975). The frequency distributions in Table 7 show gender of university graduates, broken down by discipline and cohort for semester 1979/80 and academic years 1984/85. In the early 1980s the computation’s basis in the official statistics changed from semester to academic year.
Table 7. Gender of university graduates (non-doctoral) 1 by discipline and cohort (in percent)
Gender Biology engineeringElectrical Germanstudies Mathematics sciencesSocial- EconomicsBusiness/ Cohort 1979/80 (semester 1979/80) Female 57 1 64 43 40 20 Male 43 99 36 57 60 80 Total 100 100 100 100 100 100 n 1 576 3 317 3 819 2 772 2 450 5 175 Cohort 1984/85 (academic years 1984 and 1985) Female 57 2 71 48 42 30 Male 43 98 29 52 58 70 Total 100 100 100 100 100 100 n 7 556 13 325 14 747 7 309 6 676 29 939 Notes:
Source: Statistisches Bundesamt Wiesbaden (since 1975).
1 Annual examinations in German academies.
Table 8. Comparisons of gender distributions between different cohorts of doctoral degree holders (DDH) and university graduates (UG) by discipline (Gini index and chi-squared test of goodness of fit) No Comparison Biology engineeringElectrical Germanstudies Mathematics sciencesSocial- EconomicsBusiness/
1 Cohort 1984/85 (DDH) compared to Cohort 1979/80 (UG) 0.2a 0.0b 0.2c 0.3d 0.2e 0.1 2 Cohort 1989/90 (DDH) compared to Cohort 1984/85 (UG) 0.2a 0.0b 0.3c 0.2d 0.1e 0.1f Notes:
b More than 20% of cells in the table have expected frequences less than 5. The chi-squared test of goodness
of fit was not computed.
Row 1: a 2 (df = 1) = 28.0, p < 0.001; c 2 (df = 1) = 15.9, p < 0.001; d 2 (df = 1) = 43.0, p < 0.001; e 2 (df = 1) = 9.4, p < 0.01
Row 2: a 2 (df = 1) = 26.9, p < 0.001; c 2 (df = 1) = 41.0, p < 0.001; d 2 (df = 1) = 31.2, p < 0.001; e 2 (df = 1) = 4.8, p < 0.05; f 2 (df = 1) = 7.0, p < 0.01
Social origin, gender, and career attainment of doctoral degree holders
In this section we take a further look at relations between social origin resp. gender and career attainments of doctoral degree holders at the time the survey was arranged (ten, 15 resp. 20 years after achieving the doctoral degree). We look at two frequently discussed dimensions of professional success:
– the horizontal dimension of the current job: the extent to which doctoral degree holders’ may have made their career and found further employment inside or outside the higher education and research sector (see in the subsection Career inside or outside higher education and science), and
– the vertical dimension of the current job: the extent to which doctoral degree holders may have reached high-level career positions in academe and science as well as in other employment sectors, e. g. public administration, private industry and non-profit organisations outside the higher education and research sector (see in the subsection Career position). Besides the career position we examined as well income as a second vertical dimension of professional success (see in the subsection Income).
The next sections will focus on two general topics:
(1) The long arm of social origin: this topic concerns one of the classical questions of research on the relationship between education and work: the impact of social origin on professional success. Previous studies have frequently shown that in Germany social origin still plays a considerable role for success in school and entry to higher education. Our study has shown for the first time that doctoral degree holders in four out of the six disciplines are, in fact, more frequently from an academic upper level parental social class, compared to university graduates. It remains to be seen, however, if the long arm of social origin has an impact as well on later career attainment after the doctoral degree.
(2) The gendered nature of further careers: here we address the question whether further professional careers are open to talented groups, irrespective of gender. For doctoral degree holders achieving the doctoral degree at German universities our empirical results suggested gender as a potential source of bias in the majority of disciplines (see previous section). But how is the impact of gender on career attainment comparing men and women, who both hold a doctoral degree?4
4 We did not include electrical engineering technicians into these analyses of career success. In this group of
Career inside or outside higher education and science
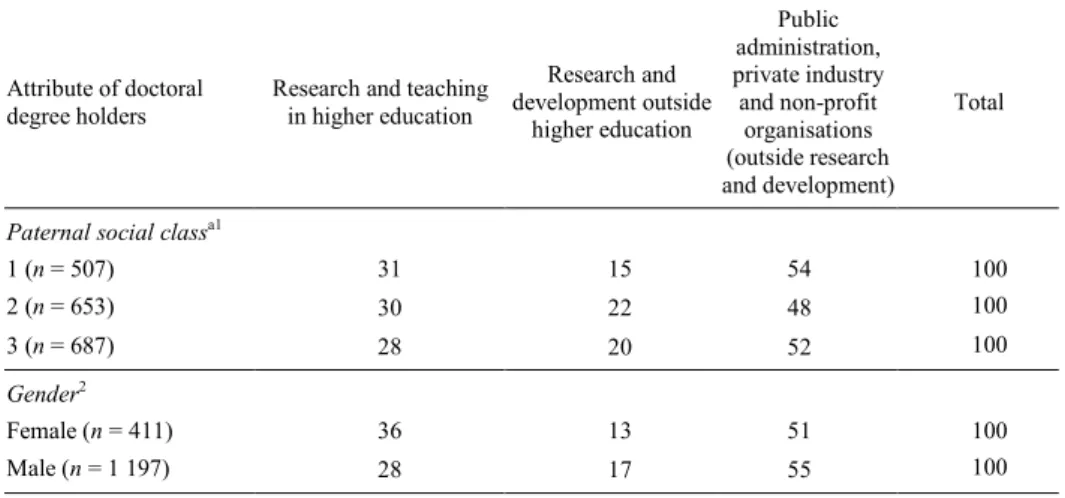
We first look at the impact of social origin and gender on doctoral degree holders’ employment inside or outside the higher education and research sector. In order to measure this, a three-class categorization was applied: (1) research and teaching in higher education, (2) research and development outside higher education and (3) public administration, private industry and non-profit organisations (outside research and development). Table 9 shows the frequency distributions for these three groups 10, 15 and 20 years, respectively, after achieving the doctoral degree, broken down by social origin and gender.
Table 9. Social origin and gender of doctoral degree holders by sector of current employment (in percent)
Attribute of doctoral
degree holders Research and teachingin higher education
Research and development outside higher education Public administration, private industry and non-profit organisations (outside research and development) Total
Paternal social classa1
1 (n = 507) 31 15 54 100 2 (n = 653) 30 22 48 100 3 (n = 687) 28 20 52 100 Gender2 Female (n = 411) 36 13 51 100 Male (n = 1 197) 28 17 55 100 Notes:
a Categories are explained in the note of Table 1. 1 2 (4, n = 1 847) = 10.7, p < 0.05, = 0.00 2 2 (2, n = 1 608) = 8.9, p < 0.01, = 0.00
In terms of social origin Pearson’s chi-squared test statistic reveals for doctoral degree holders a statistically significant influence on occupational scientific nearness:
2 (4, n = 1 847) = 10.7, p < 0.05. But, the value of Goodman and Kruskal’s tau
( = 0.00) does not point out any relation between both variables. Thus, the frequency distributions in Table 9 show that about 50% of doctoral degree holders are employed in research, teaching and development inside or outside higher education, independent of social origin. Occupations of the remaining 50% are related to public administration, private industry and non-profit organisations (outside research and development).
In our statistical evaluation of social origin’s impact, we undertook further differentiated analyses and included the disciplines of doctoral degree holders as well.
We computed sub-tables with (a) Pearson’s chi-squared test statistic and (b) Goodman and Kruskal’s tau for every discipline. (a) Within every discipline, the relationship between social origin and employment inside or outside academe and science was found to be statistically non-significant. Obviously, the overall chi-squared value in Note 1 of Table 9 was solely significant because of the very high sample size (n = 1 847). (b) REYNOLDS (1977) recommends for the multivariate nominal analyses (with more than
two variables) to measure partial associations with weighted Goodman and Kruskal’s tau coefficients: “a simple approach to measuring partial association is (1) to stratify the sample by the control variable to create a series of contingency tables; (2) to compute an index of association for each contingent relationship, and (3) to average the contingent relationships, the average being interpreted as a measure of partial association. Either a simple or weighted average can be used. (A weighted average is computed by multiplying each coefficient by the number of cases used in its calculations, adding these multiplications, and dividing the sum by the total number of cases)” (p. 55 and p. 56). As we controlled doctoral degree holders’ discipline the estimated partial association value was 0.01 (weighted average). This value does not differ much from the corresponding uncontrolled measure. Within each sub-table for the disciplines, there remain very weak associations between social origin and occupational scientific nearness.
Table 9 also presents frequency distributions broken down by gender. Pearson’s chi-squared test statistic points to a statistically significant relationship between gender and occupational scientific nearness: 2 (2, n = 1 608) = 8.9, p < 0.01; but Goodman and Kruskal’s tau indicates complete independence, = 0.00. In more differentiated analyses we controlled doctoral degree holders’ discipline. Pearson’s chi-squared test statistic revealed only one statistically significant relationship between gender and employment inside or outside academe and science: in mathematics. But the estimated partial association value ( = 0.00) – computed by Goodman and Kruskal’s tau-coefficients and sample sizes per discipline – do not differ much from the corresponding uncontrolled measure. Within each sub-table no association was found between gender and employment inside or outside academe and science. This does not mean, however, that gender may not play a role in terms of career success in the positional hierarchy of different employment sectors.
Career position
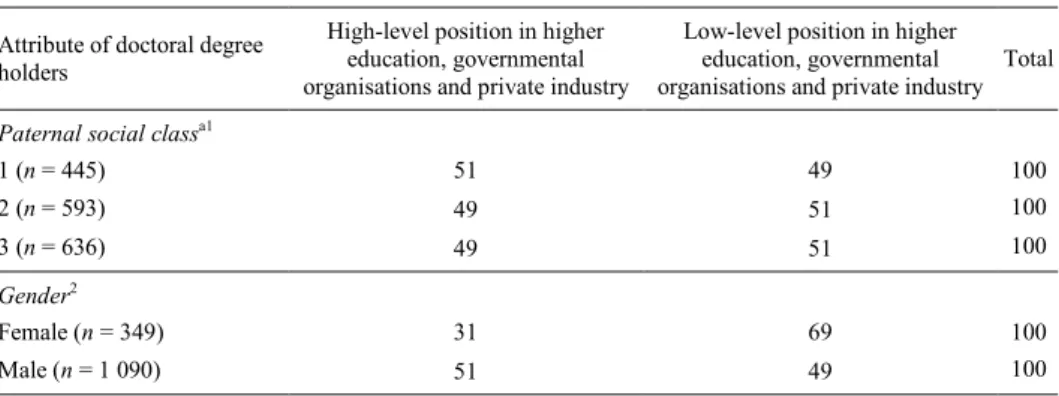
According to career success, we examined in the next statistical analyses the impact of social origin and gender on career positions in higher education and research organizations as well as in public administration, private industry and non-profit organisations outside the higher education and research sector. Based on doctoral degree holders’ statements about their job situation at the time the survey was
conducted, we developed a two-class categorization of career positions: (1) high-level position in higher education, governmental organisations and private industry, and (2) low-level position in higher education, governmental organisations and private industry.5
If we look at the first section in Table 10, approximately 50% of doctoral degree holders are in high-level occupations and about 50% in low-level positions, independent from social origin. The result of Pearson’s chi-squared test is not statistically significant. According to Goodman and Kruskal’s tau, knowing social origin of doctoral degree holders reduces errors in predicting career positions by about 0% ( = 0.00). Thus, from a statistical view, both variables are completely unrelated. Differentiated analyses controlling for doctoral degree holders’ discipline show the same results. Pearson’s chi-squared test statistics are not statistically significant and the estimated partial association value of Goodman and Kruskal’s tau is 0.00.
Table 10. Social origin and gender of doctoral degree holders by career position of current employment (in percent)
Attribute of doctoral degree holders
High-level position in higher education, governmental organisations and private industry
Low-level position in higher education, governmental organisations and private industry
Total
Paternal social classa1
1 (n = 445) 51 49 100 2 (n = 593) 49 51 100 3 (n = 636) 49 51 100 Gender2 Female (n = 349) 31 69 100 Male (n = 1 090) 51 49 100 Notes:
a Categories are explained in the note of Table 1. 1 2 (4, n = 1 674) = 0.7, p = 0.7, = 0.00 2 2 (2, n = 1 439) = 39.7, p < 0.001, = 0.03
Section 2 in Table 10 shows the relationship between doctoral degree holders’ gender and occupational position. In contrast to social origin, Pearson’s chi-squared test statistics is statistically significant. According to Goodman and Kruskal’s tau, using gender as predictor leads to a 3% reduction in error in predicting categories of career positions. The distributions in Table 10 show that female doctoral degree holders (69%) are more frequently in low-level positions than male doctoral degree holders (49%).
5 Self-employees are excluded from these analyses. They can’t definitely allocate to high- or low-level
Conversely, males (51%) are more frequently than females (31%) in high-level positions. This holds for careers inside as well as outside academe and science but is somewhat more strongly pronounced outside academe and science (ENDERS &
BORNMANN, 2001, p. 126). If we look at the results of Pearson’s chi-squared test statistic in consideration of doctoral degree holders’ discipline, we find meaningful relationships only in biology and business studies/ economics. The chi-squared values are statistically significant: biology: 2 (2, n = 294) = 17.3, p < 0.001; business studies/
economics: 2 (2, n = 282) = 8.1, p < 0.01; and the coefficients of Goodman and Kruskal’s tau are 0.06 and 0.03. Thus, from a statistical standpoint, only two out of six disciplines are substantially affected by gender inequalities in terms of career positions in higher education, governmental organisations and private industry.
Income
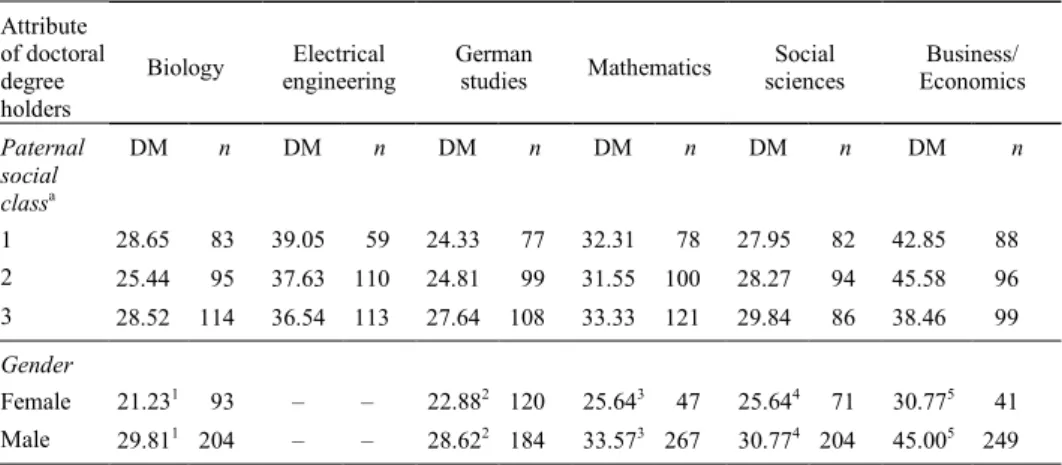
In the following, we explore the influence of social origin and gender on doctoral degree holders’ income. We looked on the income at the time the survey was undertaken, which is in most cases the highest income in job history. In our questionnaire we asked for net income per month both for the main job as well as for additional jobs. In the statistical analyses of income we considered the working time of doctoral degree holders in order to control the impact of full- versus part-time employment on income.
Table 11 shows doctoral degree holders’ medium hourly earnings broken down by discipline, social origin and gender. We calculated medians instead of arithmetical averages because the income distributions are highly skewed (tested through
Kolmogorov-Smirnov test; see CONOVER, 1999, “Statistics of the Kolmogorov-Smirnov
type”, p. 428 to p. 465). According to the hourly earnings shown in Table 11 the highest earnings are achieved by doctoral degree holders in business studies/economics and the lowest in German studies. For the statistical assessment of meaningful income differences between doctoral degree holders with different paternal social classes we computed Kruskal Wallis tests (CONOVER, 1999, p. 288 to p. 297; HAMILTON, 2002, p. 117 and p. 118; KRUSKAL & WALLIS, 1952). According to VORBERG &
BLANKENBERG (1999) Kruskal Wallis tests are appropriated by more than two independent samples and an equal-distribution of values in those populations the samples were drawn. For each discipline the result of the Kruskal Wallis test does not indicate statistically significant differences in hourly earnings.
Table 11. Hourly earnings in German Marks (DM) by social origin, gender and discipline of doctoral degree holders (median)
Attribute of doctoral degree holders
Biology engineeringElectrical Germanstudies Mathematics sciencesSocial EconomicsBusiness/
Paternal social classa DM n DM n DM n DM n DM n DM n 1 28.65 83 39.05 59 24.33 77 32.31 78 27.95 82 42.85 88 2 25.44 95 37.63 110 24.81 99 31.55 100 28.27 94 45.58 96 3 28.52 114 36.54 113 27.64 108 33.33 121 29.84 86 38.46 99 Gender Female 21.231 93 – – 22.882 120 25.643 47 25.644 71 30.775 41 Male 29.811 204 – – 28.622 184 33.573 267 30.774 204 45.005 249 Notes:
a Categories are explained in the note of Table 1.
1 2 (1, n = 297) = 45.8, p < 0.001; 2 2 (1, n = 304) = 17.1, p < 0.001; 3 2 (1, n = 314) = 14.5, p < 0.001 4 2 (1, n = 275) = 8.2, p < 0.01; 5 2 (1, n = 290) = 19.9, p < 0.001
The remaining comparisons are statistically non-significant.
According to doctoral degree holders’ gender, we found opposite results. In every discipline males earn considerably more than females. The differences in hourly earnings range from DM 5.13 (social sciences) to DM 14.23 (business studies/ economics). Male doctoral degree holders earn between 20% (social sciences) and 46% (business studies/ economics) more than female doctoral degree holders. For the statistical examination of income differences between males and females we computed mediantests (STATA CORPORATION, 2003b, p. 67). The mediantest is appropriated by two independent samples and different distributions of values in those populations the samples were drawn (VORBERG & BLANKENBERG, 1999). According to expectations the findings of the mediantests show statistically significant differences in hourly earnings for all disciplines.
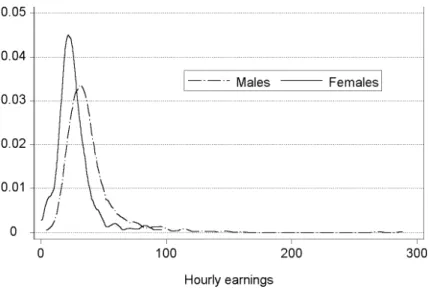
In the interpretation of gender differences we should note that the hourly earnings of male and female doctoral degree holders strongly overlap (see Figure 2). The differences within each gender group exceed those between the groups, although their medians clearly differ. Even among the male doctoral degree holders the range between the lowest and highest hourly earning is very wide. It may be the case that hourly earnings are more likely determinated by individual than group specific variability. The empirical research on gender differences in cognitive abilities reports on similar results (HALPERN, 2000).
Figure 2. Density curves for hourly earnings of male and female doctoral degree holders
Discussion
Within the scope of this article we went further into the question to what extent particularistic attributes – social origin and gender – affect selection processes in access to and in later career attainment after achieving the doctoral degree. Our questionnaire survey among a target group of doctoral degree holders in six disciplines (biology, electrical engineering, German studies, mathematics, social sciences and business studies/ economics) was used as a database. In the study we examined training, professional life course, and career success of doctoral degree holders. In certain statistical analyses we used university graduates (without doctoral degree) in the same discipline as a control group. Most of our findings about the impact of social origin and gender on educational and occupational career success are not statistically significant and many relationships are very weak. But in the context of gender and social inequality issues these are very important insights.
As regards our first object of investigation – the impact of particularistic attributes on access to the doctoral degree – the results do not reflect exclusive academic self-production. The majority of doctoral degree holders come from a non-academic parental background. The analyses show, however, that in four out of six disciplines doctoral degree holders are a selected group compared to university graduates with regard to (1) social origin as well as to (2) gender. (1) Doctoral degree holders in electrical engineering, German studies, mathematics and business studies/ economics come more
frequently from high- and medium level parental background than university graduates in the same discipline – that are already a selected group in terms of social origin. (2) Doctoral degree holders in biology, German studies, mathematics and social sciences are more frequently males than university graduates in the same discipline. Perhaps these results reflect gender-related differences in the attribution of chances of scientific success and in the handling of educational failures: Studies by ALLMENDINGER et al.
(1999) and BOCHOW & JOAS (1987) demonstrate difficulties of females to be recruited
as young scientists in the male-dominated scientific system. According to KRÜGER
(1999) in many cases females do not attribute educational success on their own abilities, but on favourable circumstances. The study of SPIES & SCHUTE (1999) points out that females assess own potentialities and chances of success more pessimistic than males. For BISCHOF-KÖHLER (2002, p. 124 and p. 125) in the empirical research on gender
differences is widely underestimated that the lower failure-resistance of females contributes to their lower success in educational and occupational situations.
With regard to our second object of investigation – the impact of particularistic attributes on several indicators of further career attainment after achieving the doctoral degree – the results point to a stronger impact of gender compared to social origin. Ten, 15 resp. 20 years after achieving the doctoral degree, we note only a slight impact of social origin on subsequent careers. Thus, our analysis of determinants of professional success of doctoral degree holders does not support the assumption of later career attainment bias concerning social origin. It seems that the “need of inequality” is mainly satisfied by respective selection processes within the educational system.
As regards doctoral degree holders’ gender, our analyses show a noticeable impact on two out of three criterions of career success that we used. We observed slight differences between male and female doctoral degree holders’ further employment inside academe and science. As regards status attainment in high-level career positions inside or outside the higher education and research sector, the statistical analyses suggest gender as a potential source of bias in biology and business studies/ economics. The results are statistically significant and the measures of association indicate substantial relationships: knowing doctoral degree holders’ gender reduces errors in predicting career positions by about 5%. But, this finding also shows for both disciplines that gender is one of many potential factors influencing career positions. With regard to income – the third criterion – the analyses show that in all disciplines male doctoral degree holders earn more per hour than females (median). The greatest differences are observed among doctoral degree holders from business studies/ economics. We should keep in mind, however, that income differences within each gender group exceed those between the groups, although their medians clearly differ.
Combined, these differences show, to some extent, a lack of impartiality. But we still know too little about the underlying mechanisms of producing inequalities to interpret them directly as violations of equality. Most probably we need to investigate
further on into a mixed picture of feedback loops between social selection and self-selection in producing inequality. Furthermore, we should take into account a problem that affects research on gender and social equality in general: a lack of experimentally derived findings makes it impossible to establish unambiguously, whether the achievement from a particular group is the recipient of preferential treatments due to biases affecting decision-making processes in the educational and occupational career, or if greater success in these processes is a simple consequence of the merit of the corresponding group. Only experimentally derived findings could finally answer questions about violations of equality and their causes (see DANIEL, 1993, p. 73).
References
ALLMENDINGER, J., FUCHS, S., VON STEBUT, J. (1999), Drehtür oder Pater Noster? Zur Frage der Verzinsung der Integration in wissenschaftliche Organisationen im Verlauf beruflicher Werdegänge von Wissenschaftlerinnen und Wissenschaftlern. In: C. HONEGGER, S. HRADIL, F. TRAXLER (Eds), Grenzenlose Gesellschaft? (Verhandlungen des 29. Kongresses der Deutschen Gesellschaft für Soziologie, des 16. Kongresses der Österreichischen Gesellschaft für Soziologie, des 11. Kongresses der Schweizerischen Gesellschaft für Soziologie in Freiburg im Breisgau, Teil 2), Opladen: Leske und Budrich, pp. 96–107.
ANDERSEN, H. (2001), The norm of universalism in sciences. Social origin and gender of researchers in Denmark. Scientometrics, 50 : 255–272.
BISCHOF-KÖHLER, D. (2002), Von Natur aus anders. Die Psychologie der Geschlechtsunterschiede. Stuttgart: Kohlhammer.
BLACK, H. (2002), Toward an equitable Europe. European women take a scientific approach to equality in science careers. The Scientist, 16 : 59.
BLOSSFELD, H.-P. (1993), Changes in educational opportunities in the Federal Republic of Germany. A longitudinal study of cohorts born between 1916 and 1965. In: SHAVIT, Y., BLOSSFELD, H.-P. (Eds), Persistent Inequality. Changing Educational Stratification in Thirteen Countries. Boulder: Westview Press, pp. 51–74.
BOCHOW, M., JOAS, H. (1987), Wissenschaft und Karriere – zum beruflichen Verbleib des akademischen Mittelbaus. Frankfurt am Main: Campus.
BORNMANN, L. (2004), Stiftungspropheten in der Wissenschaft. Zuverlässigkeit, Fairness und Erfolg des Peer-Review. Münster: Waxmann.
BORNMANN, L., ENDERS, J. (2002), Was lange währt, wird endlich gut: Promotionsdauer an bundesdeutschen Universitäten. Beiträge zur Hochschulforschung, 24 : 52–73.
BORTZ, J., LIENERT, G. A., BOEHNKE, K. (2000), Verteilungsfreie Methoden in der Biostatistik (2. edition). Berlin: Springer.
BOWDEN, V. (2000), Managing to Make a Difference. Making an Impact on the Careers of Men and Women Scientists. Aldershot: Ashgate.
BREDENKAMP, J. (1970), Über Maße der praktischen Signifikanz. Zeitschrift für Psychologie, 177 : 310–318. CONOVER, W. J. (1999), Practical Nonparametric Statistics (3. edition). New York: John Wiley & Sons. CONROY, R. M. (2002), Choosing an appropriate real-life measure of effect size: The case of a continuous
predictor and a binary outcome. The Stata Journal, 2 : 290–295. COWELL, F. A. (1977), Measuring Inequality. Oxford: Philip Allan.
DANIEL, H.-D. (1993), Guardians of Science. Fairness and Reliability of Peer Review. Weinheim: VCH. DEWANDRE, N. (2002), Women in science – European strategies for promoting women in science. Science,
ENDERS, J., BORNMANN, L. (2001), Karriere mit Doktortitel? Ausbildung, Berufsverlauf und Berufserfolg von Promovierten. Frankfurt am Main: Campus.
ENDERS, J., BORNMANN, L. (2002a), Übergangsverläufe und Statuspassagen nach der Promotion. In: WINGENS, M., SACKMANN, R. (Eds), Bildung und Beruf. Ausbildung und berufsstruktureller Wandel in der Wissensgesellschaft. Weinheim: Juventa, pp. 159–176.
ENDERS, J., BORNMANN, L. (2002b), Internationale Mobilität von bundesdeutschen Promovierten. Beiträge zur Arbeitsmarkt- und Berufsforschung, 256 : 357–374.
ENDERS, J., BORNMANN, L. (2002c), Internationale Mobilität bundesdeutscher Promovierter – Eine Sekundäranalyse der Kasseler Promoviertenstudie. Mitteilungen aus der Arbeitsmarkt- und Berufsforschung, 35 : 60–73.
FOX, M. F. (1994), Women and science careers. In: JASANOFF, S., MARKLE, G., PETERSON, J., PINCH, T. (Eds), Handbook of Science and Technology. Beverly Hills: Sage, pp. 205–223.
GOODMAN, L. A., KRUSKAL, W. H. (1954), Measures of association for cross classifications. Journal of the American Statistical Association, 49 : 732–764.
GOODMAN, L. A., KRUSKAL, W. H. (1959), Measures of association for cross classifications II. Further discussion and references. Journal of the American Statistical Association, 54 : 123–163.
GOODMAN, L. A., KRUSKAL, W. H. (1963), Measures of association for cross classifications III. Approximate sampling theory. Journal of the American Statistical Association, 58 : 310–364.
GOODMAN, L. A., KRUSKAL, W. H. (1972), Measures of association for cross classifications IV. Simplification of asymptotic variances. Journal of the American Statistical Association, 67 : 415–421. HALPERN, D. F. (2000), Sex Differences in Cognitive Abilities. Mahwah: Lawrence Erlbaum.
HAMILTON, L. C. (2002), Statistics with Stata (Updated for Version 7). Belmont: Duxbury Press. HESS, D. J. (1997), Science Studies – an Advanced Introduction. New York: New York University Press. KRÜGER, H. (1999), Geschlecht – eine schwierige Kategorie. Methodisch-methodologische Fragen der
“Gender“-Sensibilität in der Forschung. In: NEUSEL, A., WETTERER, A. (Eds), Vielfältige Verschiedenheiten. Geschlechterverhältnisse in Studium, Hochschule und Beruf. Frankfurt am Main: Campus, pp. 35–60.
KRUSKAL, W. H., WALLIS, W. A. (1952), Use of ranks in one-criterion variance analysis. Journal of the American Statistical Association, 47 : 50–60.
LETA, J., LEWISON, G. (2003), The contribution of women in Brazilian science: A case study in astronomy, immunology and oceanographie. Scientometrics, 57 : 339–353.
LEE, W. C. (1999), Probabilistic analysis of global performances of diagnostic test: Interpreting the Lorenz Curve-based summary measures. Statistics in Medicine, 18 : 455–471.
LEWIN, K., HEUBLEIN, U., OSTERTAG, M., SOMMER, D. (1998), HIS Ergebnisspiegel. Hannover: Hochschul-Informations-System GmbH and Bundesministerium für Bildung, Wissenschaft, Forschung und Technologie.
LONG, J. S., FOX, M. F. (1995), Scientific careers: Universalism and particularism. Annual Review of Sociology, 21 : 45–71.
MEULEMANN, H. (1995), Die Geschichte einer Jugend. Lebenserfolg und Erfolgsdeutung ehemaliger Gymnasiasten zwischen dem 15. und 30. Lebensjahr. Opladen: Westdeutscher Verlag.
NEUBAUER, U. (2001), Women and science in Europe: An academic pipeline in need of repair. Nachrichten aus der Chemie, 49 : 161–163.
OSBORN, M., REES, T., BOSCH, M., EBELING, H., HERMANN, C., HILDEN, J., MCLAREN, A., PALOMBA, R., PELTONEN, L., VELA, C., WEIS, D., WOLD, A., MASON, J., WENNERÅS, C. (2001), Wissenschaftspolitik in der Europäischen Union. Förderung herausragender wissenschaftlicher Leistungen durch Gender Mainstreaming. Bericht der ETAN-Expertinnenarbeitsgruppe “Frauen in der Wissenschaft”. Brüssel: Europäische Kommission.
PRPIC, K. (2003), Professional position, performance and perspectives of (young) women scientists. Drustvena Istrazivanja, 12 : 613–634.
PRUTHI, S., JAIN, A., WAHID, A., MEHRA, K., NABI, S. (1997), Scientific community and peer review system – A case study of a central government funding scheme in India. Journal of Scientific and Industrial Research, 56 : 398–407.
REYNOLDS, H. T. (1977), Analysis of Nominal Data (Series: Quantitative Applications in the Social Sciences). London: Sage Publications.
SACHS, L. (2004), Angewandte Statistik. Anwendung statistischer Methoden (11. edition). Berlin: Springer. SEDLMEIER, P. (1996), Jenseits des Signifikanztest-Rituals: Ergänzungen und Alternativen. Methods of
Psychological Research Online, 4 : 41–63.
SONNERT, G. (1996), Gender equity in science: Still an elusive goal. Issues in Science and Technology, 12 : 53–58.
SONNERT, G., HOLTON, G. (1996), Career patterns of women and men in the science. American Scientist, 84 : 63–71.
SONNERT, G., HOLTON, G., WILSON, G. S. (1995), Who Succeeds in Science? The Gender Dimension. New Brunswick, NJ: Rutgers University Press.
SPIES, K., SCHUTE, M. (1999), Warum promovieren Frauen seltener als Männer? Psychologische Prädiktoren der Promotionsabsicht bei Männern und Frauen. Zeitschrift für Sozialpsychologie, 30 : 229–245. STATA CORPORATION (2003a), Stata Reference Manual: Release 8.0, Volume 3 N – R. College Station,
Texas: Stata Press.
STATA CORPORATION (2003b), Stata Reference Manual: Release 8.0, Volume 3 S – Z. College Station, Texas: Stata Press.
STATISTISCHES BUNDESAMT WIESBADEN (since 1975), Prüfungen an Hochschulen. Wiesbaden: Statistisches Bundsamt.
VORBERG, D., BLANKENBERG, S. (1999), Die Auswahl statistischer Tests und Maße. Psychologische Rundschau, 50 : 157–164.