DOI 10.1007/s10237-011-0347-6 O R I G I NA L PA P E R
Use of micro-CT-based finite element analysis to accurately
quantify peri-implant bone strains: a validation in rat tibiae
Antonia Torcasio · Xiaolei Zhang ·Hans Van Oosterwyck · Joke Duyck · G. Harry van Lenthe
Received: 24 February 2011 / Accepted: 22 August 2011 / Published online: 6 September 2011 © Springer-Verlag 2011
Abstract Although research has been addressed at
investigating the effect of specific loading regimes on bone response around the implant, a precise quantitative under-standing of the local mechanical response close to the implant site is still lacking. This study was aimed at validating micro-CT-based finite element(µFE) models to assess tissue strains after implant placement in a rat tibia. Small implants were inserted at the medio-proximal site of 8 rat tibiae. The limbs were subjected to axial compression loading; strain close to the implant was measured by means of strain gauges. Specimen-specificµFE models were created and analyzed. For each specimen, 4 different models were created corre-sponding to different representations of the bone–implant interface: bone and implant were assumed fully osseoin-tegrated (A); a low stiffness interface zone was assumed with thickness of 40µm (B), 80 µm (C), and 160 µm (D). In all cases, measured and computational strains correlated highly (R2 = 0.95, 0.92, 0.93, and 0.95 in A, B, C, and D, respectively). The averaged calculated strains were 1.69, 1.34, and 1.15 times higher than the measured strains for A, B, and C, respectively, and lower than the experimental strains for D (factor = 0.91). In conclusion, we demonstrated that specimen-specific FE analyses provide accurate estimates of peri-implant bone strains in the rat tibia loading model.
Fur-A. Torcasio· H. Van Oosterwyck · G. H. van Lenthe (
B
) Biomechanics Section, Department of Mechanical Engineering, K.U.Leuven, Celestijnenlaan 300C, 3001 Leuven, Belgium e-mail: [email protected]G. H. van Lenthe
Institute for Biomechanics, ETH Zurich,
Wolfgang-Pauli-Strasse 10, 8093 Zurich, Switzerland X. Zhang· J. Duyck
BIOMAT, Department of Prosthetic Dentistry, K.U.Leuven, Kapucijnenvoer 7, 3000 Leuven, Belgium
ther investigations of the bone-implant interface are needed to quantify implant osseointegration.
Keywords Bone strains· µCT based finite element models· Rat tibia compression · Strain gauge measurements · Bone-implant interface
1 Introduction
Osseointegration, which is the direct biological fixation of load-bearing implants without the formation of fibrous tissue at the interface, represents the key prerequisite for implant success (Branemark et al. 1977). Implant osseointegration is a complex and dynamic cell-driven process. Osteoblasts and osteocytes adjacent to the implant produce signaling mole-cules starting from the onset of tissue damage due to implant insertion. These molecules act locally to recruit and induce skeletogenetic cells to proliferate and differentiate (Davies 2003). Whereas the nature of the initiating signals for the skeletogenetic cells in the repair tissue is not completely determined, a multitude of these signals has been identified (Mavrogenis et al. 2009). Specifically, the local mechanical environment in peri-implant bone tissue is perhaps the most important regulating factor (Carter and Giori 1991). The cells within the peri-implant bone tissue that experience a load-ing history of physiological strains are likely to form bone, assuming adequate blood supply. However, if the healing tis-sue is exposed to excessive strains, fibrous tistis-sue formation will result (Brunski 1999).
Research has been addressed at investigating the effect of specific loading regimes on bone response around the implant (for a recent review seeTorcasio et al. 2008). However, exper-imental data are still limited (De Smet et al. 2006, 2007,
1994). In addition, a precise quantitative understanding of the mechanical response close to the implant site is lack-ing; nevertheless, it would represent a crucial step for defin-ing the relationship between local bone response and local mechanical stimuli, and for optimizing the in vivo loading protocols that would enhance the process of osseointegra-tion.
Micro-computed tomography(µCT)-based finite element (µFE) analysis is a widely used tool to quantify stresses and strains in bone. Specifically, the use of voxel-based FE models allows for a highly accurate representation of bone external geometry as well as its internal microarchitec-ture. Furthermore, with the increasing availability of parallel computers and dedicated large-scale solvers (Adams 2002;
Arbenz et al. 2008;Boyd et al. 2002;van Rietbergen et al. 1995),µCT-based finite element analyses can be performed routinely on whole bones or large portions theoreof (van Lenthe and Müller 2008). However, whetherµFE models would provide accurate estimates of strains in whole bones after implant insertion is not known since this would further require an accurate representation of implant geometry, its relative position to the bone and of the bone-implant interface characteristics. Specifically, the accurate representation of the bone-implant interface represents the greatest challenge in finite element modeling of dental implant behavior. Due to the multitude of mechanical and biological factors involved, the mechanisms occurring at this interface during healing are not yet known. Furthermore, also the precise assessment of the bone-implant interface characteristics immediately after implant insertion is still lacking.
Therefore, the aim of this study was to investigate the use ofµFE models as a potential tool for the assessment of tis-sue strains after implant insertion in small animals (De Smet et al. 2007, 2006; Ogawa et al. 2011b,a). Specifically, the investigations were performed in the rat tibia compression loading model.
2 Materials and methods
Experiments were performed using 8 male Wistar rats (Janvier, France). All rats were 12 weeks old and weighted 257.1±9.7 g. Animals were killed at day 2 after purchase by cervical displacement under isoflurane-induced anesthesia. The hind limbs of the rats were excised from the middle of the femur to the toes and kept frozen at a temperature of−21◦C until experimental testing. All procedures were approved by the ethical committee of K.U.Leuven (P029/2008).
2.1 Strain gauge measurements
The limbs were thawed 12 h prior to the experiments. Incisions were made through the skin, and muscles were
Strain gauge Bondable terminals Lead wires Loading cups
Fig. 1 Rat limbs with the implant inserted were placed between the loading cups connected to test bench
retracted to expose the medio-proximal surface of the tibiae. One single element strain gauge (type FLG-02-11, TML, Tokyo Sokki Kenkyujo Co., Ltd.) with an active gauge length of 0.2 mm and width of 1.4 mm was glued onto the tibia using a cyanoacrylate adhesive (type CN, Feteris Components BV). It was placed at the medial surface of the tibia at 25% of the tibia length, after lightly polishing the bone surface with an abrasive paper and wiping it with acetone. A titanium screw-shaped implant of 2 mm diameter was inserted in the proxi-mal metaphysis of each tibia (Ogawa et al. 2011b,a) 1.5 mm distal to the strain gauge site. Before placement, a receiving channel of 1.53 mm diameter was drilled orthogonally to the medial surface of the tibia. Lead wires (type 3WP008, Feteris Components BV) were connected on one end to the delicate jumper wires of the strain gauge through bondable terminals (TF-2SS, Feteris Components BV). On the other end, the lead wires were connected to the acquisition system. The limbs were placed between two dedicated loading cups of a testing system (BOSE TestBench LM1, Bose Corp., Minnetonka, MN, USA) and kept in place by means of an 0.5 N preload (Fig.1), after which the strain reading was zeroed. After 4 conditioning cycles (0.05 Hz, 2.5 N), the bones were quasi-statically loaded at a rate of 0.5 mm/s and strain was measured at compressive forces of 2.5, 5.0, 7.5, and 10.0 N, respec-tively. The strain reading system included the acquisition of the signal after quarter bridge (SCXI 1314, NI, National Instruments, Austin, TX), amplification and conditioning (SCXI 1520, NI) and the transmission to the PC (SCXI 1600 USB DAQ module, NI). Labview software (Labview 8.6, NI) provided the necessary interface and readout. To quantify the potential strain variations due to leg orientation, the measure-ments were repeated five times after complete removal of the specimen from the device and repositioning it.
2.2µCT imaging
Before experimental testing, each limb had been imaged by µCT (Skyscan 1172, Skyscan, Kontich, Belgium) from the knee to the ankle joint while being constrained by two plastic
cups as in the experimental configuration. Because of the large size of the specimens, we adopted the “oversize scan” modality that can image sequentially and connect together multiple views along the height of the specimens. Each of the 6 subscans was taken with 20µm resolution, 70kV source voltage, 141µA source current, 2-fold oversampling and a rotation step of 0.350◦. The global field of view had a width of 15.2 mm, a height of 46 mm, and a depth of 13.4 mm (760× 2300× 670 pixels). After the experiments, all samples, with the strain gauges still bonded to the bone surface and the implant inserted, were imaged again byµCT.
2.3 Micro-CT segmentation
TheµCT images were reconstructed using NRecon software (version 1.6.1.5; Skyscan, Kontich, Belgium) that performed automatic matching and stitching of the parts belonging to each oversize scan. The quality of the post-experimentµCT scans was limited by artifacts due to the presence of the jumper wires of the strain gauges. Even larger metal arti-facts were found in proximity of the implant. These artiarti-facts prevented proper image segmentation. In order to overcome this problem, we used the pre-experimentµCT scans of the limbs as a reference for building up the model of the tibia. Both pre- and post-experimentµCT scans of each specimen were processed (IPL, Scanco Medical, Brüttisellen, Switzer-land). To reduce computational costs, the voxel size was set to 40µm. The µCT images of each tibia were filtered using a constrained three-dimensional Gaussian filter to partially suppress the noise in the volumes (σ = 1.2, support =2). The data were binarized using a global threshold of 14% of maximum possible gray value to separate voxels represent-ing bone tissue from surroundrepresent-ing voxels representrepresent-ing soft tissue. The implant material was extracted from the post-experiment images by using a threshold value of 49% of maximum possible gray value. For each specimen, the posi-tion and orientaposi-tion of the implant with respect to the bone were assessed by means of fully automated alignment rou-tines of the pre-experimental artifact-free tibia model onto the post-experimental tibia model (Gerhard et al. 2008) after which the isolated implant was artificially inserted into the intact bone model. The joint spaces between the articulating bones of the system (tibia–femur, femur–patella, tibia–talus, talus–calcaneus) were modeled by bony elements. Although this is a simplification, it has been demonstrated to be ade-quate for accurately quantifying the strain values in the rat tibia loading model (Torcasio et al. 2011). Finally, a compo-nent labeling algorithm was applied in order to delete all the unconnected elements in the models.
2.4 Micro-CT-based finite element analyses
Micro-finite element (µFE) models were generated by a direct conversion of bone voxels to linear 8-noded hexahedral
elements (voxel size of 40µm). Mesh convergence tests were performed on one intact tibia by calculating the overall sam-ple stiffness when using voxel sizes of 20, 40, and 80µm, respectively, from which it was concluded that the 40µm voxel mesh was sufficiently converged (Torcasio et al. 2011). Linear and isotropic material behavior were assigned to all materials in the µFE models. All interfaces in the model were modeled as fully bonded contacts, resulting in a model consisting of only one body with different material proper-ties that represented the different components. We assumed a firm connection between implant and bone to occur directly after implantation. Although this is a simplification, it is reasonable to assume that the use of the “undersized surgi-cal technique” limited the potential relative motion between implant and bone (Tabassum et al. 2009). Furthermore, as recently demonstrated experimentally, interlocking between thread and trabeculae likely dominates frictional and detach-ing phenomena (Wirth et al. 2010).
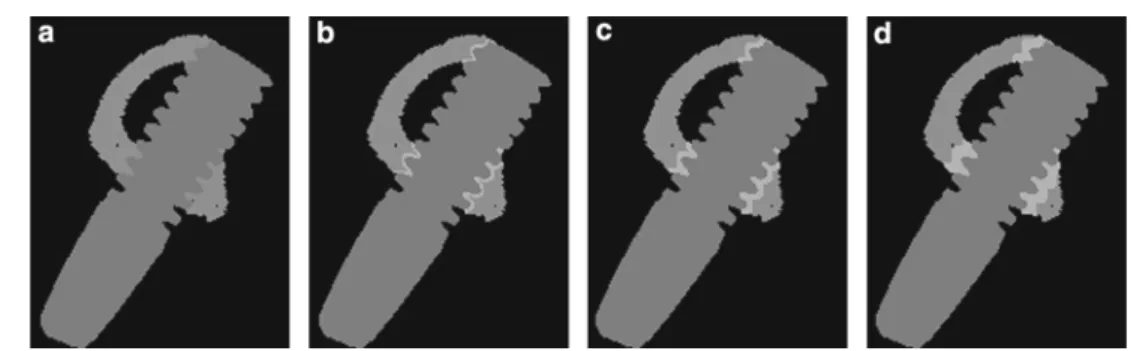
For each specimen, four different models were cre-ated corresponding to different representations of the bone-implant interface (Fig. 2). The first model (Model A) consisted of 2 entities, bone and implant, to which were given Young’s moduli of 18.3 and 100 GPa, respectively; Poisson ratio was equal to 0.30 for both materials (Fig.2a). Bone tis-sue modulus had been determined in a previous study using 8 intact tibiae without implant insertion (Torcasio et al. 2011). In this model, it is assumed that the procedure of implant insertion did not alter the quality of the peri-implant bone tissue; it refers to a rather idealized state of perfect osseo-integration. In models B, C, and D (Fig.2b–d), a reduced quality of the interface was modeled by assigning a Young modulus of 0.1 GPa to a peri-implant bony region with thick-ness of 40, 80, and 160µm, respectively.
Boundary conditions that simulated the experimental con-figuration were defined. Hence, the models were fixed at the distal end; a 9.5 N load magnitude (=10.0 N−0.5N preload) was applied to the proximal end, while any displacement in the other two directions was constrained. The models were solved using the dedicated large-scale finite element itera-tive solver ParFE (Arbenz et al. 2008) on a Cray XT5 system (CSCS, Manno, Switzerland).
2.5 Calculation of the strains at the strain gauge site The alignment routines of the pre-experimental artifact-free tibia model onto the post-experimental tibia model allowed for incorporating the precise implant position relative to each bone; furthermore, the alignment routines allowed for iden-tifying the location and orientation of the strain gauge with respect to each tibia model; hence a volume of interest VOI identifying the strain gauge location was selected. In order to prevent artificial surface strain values from affecting the results, the surface layer of the VOI was excluded from the
Fig. 2 Four models corresponding to four representations of the bone-implant interface were created. The first model consisted of 2 enti-ties, bone and implant, to which were given Young’s moduli of 18.3 and 100 GPa, respectively (a). In the second, third, and fourth model
a reduced quality of the interface was modeled by assigning a Young modulus of 0.1 GPa to a peri-implant bony region with thickness of 40µm (b), 80µm (c) and 160µm (d), respectively
analysis. For each element, the strain tensor was calculated and averaged over the VOI. Three-dimensional strain trans-formations were applied to obtain the strain in the working direction of the experimental strain gauge. Visualizations of the bone strains were created using the open source program ParaView (http://www.paraview.org/), running on an HP-XC cluster (CSCS, Manno, Switzerland).
2.6 Statistical analyses
For each load magnitude, mean strains and standard devi-ations over 5 repeated measurements were calculated. The intra-individual variability was assessed in terms of the coef-ficient of variation (COV). The experimental inter-individual variability was calculated based on bone stiffness, defined as the slope of the relationship between strain and load magni-tude. The mean experimental strains were correlated to the computational strains by means of the Pearson’s squared cor-relation coefficient(R2). All statistical analyses were
per-formed with Excel 2003 (Microsoft, Redmond, USA).
3 Results
3.1 Strain gauge measurements
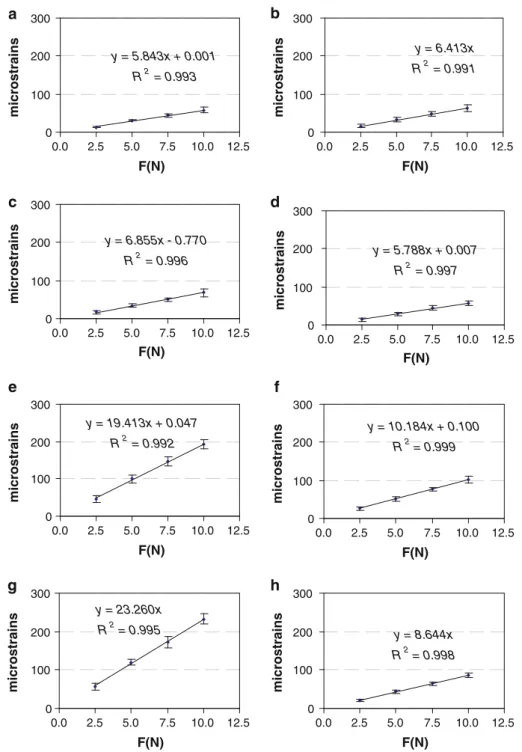
Compressive loading of the rat limbs resulted in tensile strains on the medio-proximal surface of the tibia. The mea-sured strains differed by 62.5% between individuals. How-ever, intra-individual variability was only 9.22 ± 2.67%. Over the range of load magnitudes applied, we found for each limb that the mean strains exhibited a linear relation to the applied loads(R2> 0.99) (Fig.3).
3.2µFE analyses
AllµFE models were successfully created and analyzed. The number of elements in the models ranged from 7.1 to 8.1 mil-lion, the number of nodes from 8.4 to 10 million.
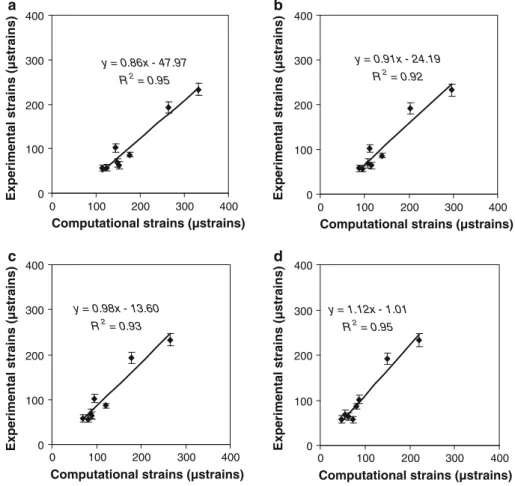
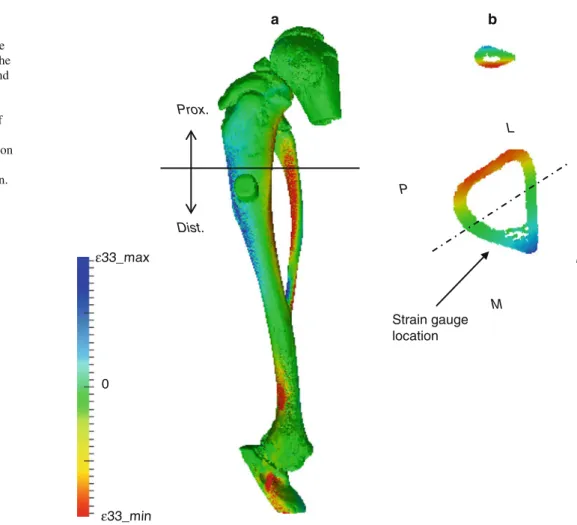
The calculated strains, averaged over all individuals, were 1.69, 1.34, and 1.15 times higher than the averaged measured strains for model A, B, and C, respectively. The computa-tional strains were lower than the experimental strains for model D (factor=0.91). The local strain values 1.5mm away from the implant on the tibia surface served for validating the computational strains as calculated byµFE analysis. In all 4 cases (Fig.4), measured andµFE-derived strains correlated highly (R2 = 0.95, 0.92, 0.93, and 0.95 for models A, B, C, and D, respectively). In addition, the strains calculated for model A correlated highly with the strains calculated for model B, C, and D (R2= 0.98, 0.97, and 0.92, respectively). The visualization of the strain distribution throughout the whole tibia demonstrated that axial loading produced a mix-ture of compression and bending, which resulted in tensile and compressive strains on the medial and lateral surface of the proximal tibia, respectively (Fig.5a). The strain distri-bution at the level of the strain gauge site indicated that the strain gauge was placed in a region of high strain gradients along the anterior–posterior direction (Fig.5b).
4 Discussion
The objective of this study was to develop and validate µFE models for the assessment of tissue strain in a rat tibia compression loading model after implant insertion. Ex vivo experiments were performed that reproduced the in vivo situation. By using dedicated loading cups, we suc-ceeded in minimizing the effect of leg orientation on the measured strains. In fact, the measurements on each speci-men were highly reproducible (COV= 9.22 ± 2.67% over 5 repetitions). We found relatively large COV for the exper-imentally measured inter-individual strains (62.5%). These findings match results from a previous study conducted on the same rat tibiae before implant insertion (Torcasio et al. 2011), in which strong differences in the measured strains between individuals (54.2%) had been found as well. Finite
Fig. 3 Experimentally measured strain–force relationship for the 8 limbs tested (a–h). Each value represents the mean strain and standard deviation over 5 repeated measurements on the same limb y = 5.843x + 0.001 R2 = 0.993 0 100 200 300 0.0 2.5 5.0 7.5 10.0 12.5 F(N) microstrains y = 6.413x R2 = 0.991 0 100 200 300 0.0 2.5 5.0 7.5 10.0 12.5 F(N) microstrains y = 6.855x - 0.770 R2 = 0.996 0 100 200 300 0.0 2.5 5.0 7.5 10.0 12.5 F(N) microstrains y = 5.788x + 0.007 R2 = 0.997 0 100 200 300 0.0 2.5 5.0 7.5 10.0 12.5 F(N) microstrains y = 19.413x + 0.047 R2 = 0.992 0 100 200 300 0.0 2.5 5.0 7.5 10.0 12.5 F(N) microstrains y = 10.184x + 0.100 R2 = 0.999 0 100 200 300 0.0 2.5 5.0 7.5 10.0 12.5 F(N) microstrains y = 23.260x R2 = 0.995 0 100 200 300 0.0 2.5 5.0 7.5 10.0 12.5 F(N) microstrains y = 8.644x R2 = 0.998 0 100 200 300 0.0 2.5 5.0 7.5 10.0 12.5 F(N) microstrains a b c d e f g h
element analyses revealed that such differences were mainly due to small variations in the strain gauge location.
The use of voxel-based FE models allowed for a highly accurate representation of bone geometry and accurate inter-nal trabecular architecture. Accurate loading conditions were achieved byµCT imaging of each limb positioned between two cups just as in the experimental configuration. This assured that the correct alignment of the FE model with respect to the loading direction as well as the correct loca-tion of the point of load applicaloca-tion was automatically
incorporated in the specimen-specificµFE models. Finally, accurate bone material properties were used. Specifically, this value (18.3 GPa) was obtained as best match between experimental and µFE-derived strains in a separate study conducted on the intact rat tibiae without the presence of an implant (Torcasio et al. 2011).
The micro-CT-based finite element method appeared to be very effective for accurately representing the implant geometry and its location in the tibia while less suitable for representing the peri-implant bone tissues. TheµCT images
Fig. 4 Experimentally measured strains versus computational strains calculated at 9.5 N load amplitude in each individual for model a, b, c, and d y = 0.86x - 47.97 R2 = 0.95 0 100 200 300 400 0 100 200 300 400
Computational strains (µstrains)
Experimental strains (µstrains)
y = 0.91x - 24.19 R2 = 0.92 0 100 200 300 400 0 100 200 300 400
Computational strains (µstrains)
Experimental strains (µstrains)
y = 0.98x - 13.60 R2 = 0.93 0 100 200 300 400 0 100 200 300 400
Computational strains (µstrains)
Experimental strains (µstrains)
y = 1.12x - 1.01 R2 = 0.95 0 100 200 300 400 0 100 200 300 400
Computational strains (µstrains)
Experimental strains (µstrains)
a b
c d
were influenced by large metal artifacts due to the pres-ence of the implant. This issue was solved for each spec-imen by rigid registration of the pre-experspec-imental model onto the post-experimental model. Hence, the specimen-specific implant location and orientation with respect to the artifact-free bone could be represented well. The most evi-dent limitation of this approach, however, was that a real-istic representation of bone-implant interface could not be achieved.
In this study, implants were inserted using “undersized surgical technique” in which the final drill diameter is consid-erably smaller than the implant diameter (Friberg et al. 1999). Although this procedure is considered favorable for primary implant stability (Tabassum et al. 2009;Shalabi et al. 2007) and implant osseointegration (Lioubavina-Hack et al. 2006), its effects on peri-implant bone quality are not fully known. Histological analyses have shown that after implant inser-tion through the undersized technique, bone is not entirely in contact with the implant surface (Tabassum et al. 2010). Fur-thermore, bone particles are formed and translocated during implant placement (Tabassum et al. 2010). Other authors have evidenced how the undersized technique determines a preload condition, which depend on the difference between the drill diameter and the implant diameter as well as on
the mechanical properties of bone and implant materials. Because the time of implant insertion is too short for bone to relax, the bone tissue might experience inelastic phenom-ena with the possibility of permanent elastic strains in peri-implant bone (Duyck et al. 2010;Natali et al. 2009). Research has also supported the hypothesis that implant insertion may cause initiation of microcracks in peri-implant bone (Huja et al. 1999;Warreth et al. 2009).
Because of the lack of specific data on bone-implant inter-face characteristics, we modeled four distinct cases. Not sur-prisingly, we found that the calculated strains varied with the bone-implant interface characteristics. When modeling bone in full contact with the implant surface (model A), we found that the computational strains largely overesti-mated (by a factor of 1.69) the experimentally measured strain values. In model B and C, in which a peri-implant interface region of 40 and 80µm thickness was included, we found that the calculated strains were 1.34 and 1.15 times higher than the experimental strains, respectively. In model D, in which a peri-implant interface region of 160µm thickness was included, the calculated strains were lower than the experimental strains (factor of 0.91). Nevertheless, we found that irrespective of the specific interface proper-ties that were assigned to models, the computational strains
Fig. 5 Strain distribution throughout the entire rat tibia. Tensile (blue) and compressive (red) strains are occurring in the proximal tibia at the medial and lateral side, respectively (a). Strain distribution in the cross-section at the location of the strain gauge site (b): the strain gauge is placed in a region of high strain gradients along the anterior–posterior direction.
Prox. proximal, Dist. distal, A anterior, P posterior, M medial, L lateral Strain gauge location a b ε33_max 0 ε33_min M L A P Prox. Dist.
correlated highly to the experimental strains(R2 > 0.92). These findings show that a thin peri-implant bone region with reduced Young’s modulus effectively represents the mechan-ical behavior of the bone-implant interface immediately after implant insertion.
A normal healing process is likely to be characterized by a progressive increase in peri-implant bone stiffness (Chang et al. 2003); it might end with a situation similar to model A, representing an idealized state of implant osseoin-tegration, for which the highest strains were calculated. Fur-ther research could be addressed at the precise quantification of the mechanical properties of peri-implant bone immedi-ately after implant insertion as well as at different time steps of the healing process. By incorporating such information intoµFE models, it would be possible to precisely quan-tify the change in the local mechanical stimuli occurring in peri-implant bone.
Alternatively, local bone strains might be directly assessed by using optical methods or ultrasonic echo tracking (Matsuyama et al. 2006). Nevertheless, all these methods may provide measurements of bone surface strains only that are not suitable for 3D measurements of strains throughout the whole bone.
In conclusion, we have demonstrated that highly detailed specimen-specific finite element analyses can provide accu-rate estimates of tissue-level strains in the rat tibia after implant insertion. We also showed that the peri-implant bone characteristics strongly affect the mechanical strain levels occurring in bone. Further investigations are needed in order to identify and quantify the effects of drilling and implant insertion on bone tissue properties in close vicinity to the implant such that these can be incorporated into the µFE models.
Acknowledgments The authors acknowledge the Laboratory for Experimental Medicine and Endocrinology (LEGENDO) of Leuven for allowing the use of theµCT scanner and the Swiss National Super-computing Centre (CSCS) that granted the computational time. This study was supported by grant OT/04/26 from the Katholieke Universi-teit Leuven.
References
Adams M (2002) Evaluation of three unstructured multigrid methods on 3D finite element problems in solid mechanics. Int J Numer Methods Eng 55:519–534
Arbenz P, van Lenthe GH, Mennel U, Müller R, Sala M (2008) A scal-able multi-level preconditioner for matrix-freeµ-finite element
analysis of human bone structures. Int J Numer Methods Eng 73:927–947
Boyd SK, Muller R, Zernicke RF (2002) Mechanical and architectural bone adaptation in early stage experimental osteoarthritis. J Bone Miner Res 17(4):687–694
Branemark PI, Hansson BO, Adell R, Breine U, Lindstrom J, Hallen O, Ohman A (1977) Osseointegrated implants in the treatment of the edentulous jaw. Experience from a 10-year period. Scand J Plast Reconstr Surg Suppl 16:1–132
Brunski JB (1999) In vivo bone response to biomechanical loading at the bone/dental-implant interface. Adv Dent Res 13:99–119 Carter DR, Giori NJ (1991) Effect of mechanical stress on tissue
differentiation in the bony implant bed. In: Davies JE (ed) The bone-biomaterial interface. University of Toronto Press, Toronto, pp 367–376
Chang MC, Ko CC, Liu CC, Douglas WH, DeLong R, Seong WJ, Hodges J, An KN (2003) Elasticity of alveolar bone near den-tal implant-bone interfaces after one month’s healing. J Biomech 36(8):1209–1214
Davies JE (2003) Understanding peri-implant endosseous healing. J Dent Educ 67(8):932–949
De Smet E, Jaecques SV, Jansen JJ, Walboomers F, Vander SJ, Naert IE (2007) Effect of constant strain rate, composed of vary-ing amplitude and frequency, of early loadvary-ing on peri-implant bone (re)modelling. J Clin Periodontol 34(7):618–624
De Smet E, Jaecques SV, Jansen JJ, Walboomers F, Vander SJ, Naert IE (2008) Effect of strain at low-frequency loading on peri-implant bone (re)modelling: a guinea-pig experimental study. Clin Oral Implants Res 19(8):733–739
De Smet E, Jaecques SVN, Wevers M, Jansen JA, Jacobs R, Sloten JV, Naert IE (2006) Effect of controlled early implant loading on bone healing and bone mass in guinea pigs, as assessed by micro-CT and histology. Eur J Oral Sci 114:232–242
Duyck J, Corpas L, Vermeiren S, Ogawa T, Quirynen M, Vandamme K, Jacobs R, Naert I (2010) Histological, histomorphometrical, and radiological evaluation of an experimental implant design with a high insertion torque. Clin Oral Implants Res 21(8):877–884 Friberg B, Sennerby L, Grondahl K, Bergstrom C, Back T, Lekholm U
(1999) On cutting torque measurements during implant placement: a 3-year clinical prospective study. Clin Implant Dent Relat Res 1(2):75–83
Gerhard FA, Lambers FM, Kuhn G, Müller R (2008) Rigid registration allows quantification of bone formation and resorption in a longi-tudinal in vivo mouse study of bone adaptation. In: Annual meeting Swiss society for biomedical engineering Muttenz (Switzerland) 4–5 September, p 14
Huja SS, Katona TR, Burr DB, Garetto LP, Roberts WE (1999) Micro-damage adjacent to endosseous implants. Bone 25(2):217–222 Ko CC, Douglas WH, DeLong R, Rohrer MD, Swift JQ, Hodges JS,
An KN, Ritman EL (2003) Effects of implant healing time on crestal bone loss of a controlled-load dental implant. J Dent Res 82(8):585–591
Leucht P, Kim JB, Wazen R, Currey JA, Nanci A, Brunski JB, Helms JA (2007) Effect of mechanical stimuli on skeletal regeneration around implants. Bone 40(4):919–930
Lioubavina-Hack N, Lang NP, Karring T (2006) Significance of pri-mary stability for osseointegration of dental implants. Clin Oral Implants Res 17(3):244–250
Matsuyama J, Ohnishi I, Sakai R, Suzuki H, Harada A, Bessho M, Mat-sumoto T, Nakamura K (2006) A new method for measurement of bone deformation by echo tracking. Med Eng Phys 28(6):588–595 Mavrogenis AF, Dimitriou R, Parvizi J, Babis GC (2009) Biology of implant osseointegration. J Musculoskelet Neuronal Interact 9(2):61–71
Natali AN, Carniel EL, Pavan PG (2009) Dental implants press fit phenomena: biomechanical analysis considering bone inelastic response. Dent Mater 25(5):573–581
Ogawa T, Possemiers T, Zhang X, Naert I, Chaudhari A, Sasaki K, Duyck J (2011) Influence of whole-body vibration time on peri-implant bone healing: a histomorphometrical animal study. J Clin Periodontol 38(2):180–185
Ogawa T, Zhang X, Naert I, Vermaelen P, Deroose CM, Sasaki K, Duyck J (2011) The effect of whole-body vibration on peri-implant bone healing in rats. Clin Oral Implants Res 22(3):302– 307
Rubin CT, McLeod KJ (1994) Promotion of bony ingrowth by fre-quency-specific, low-amplitude mechanical strain. Clin Orthop Relat Res (298):165–174
Shalabi MM, Wolke JG, de Ruijter AJ, Jansen JA (2007) Histological evaluation of oral implants inserted with different surgical tech-niques into the trabecular bone of goats. Clin Oral Implants Res 18(4):489–495
Tabassum A, Meijer GJ, Wolke JG, Jansen JA (2009) Influence of the surgical technique and surface roughness on the primary stability of an implant in artificial bone with a density equivalent to maxil-lary bone: a laboratory study. Clin Oral Implants Res 20(4):327– 332
Tabassum A, Walboomers XF, Wolke JG, Meijer GJ, Jansen JA (2010) Bone particles and the undersized surgical technique. J Dent Res 89(6):581–586
Torcasio A, van Lenthe GH, Van OH (2008) The importance of loading frequency, rate and vibration for enhancing bone adaptation and implant osseointegration. Eur Cell Mater 16:56–68
Torcasio A, Zhang X, Duyck J, van Lenthe GH (2011) 3D characteriza-tion of bone strains in the rat tibia loading model. Biomech Model Mechanobiol. doi:10.1007/s10237-011-0320-4
van Lenthe GH, Müller R (2008) CT-based visualization and quantifica-tion of boe microstructure in vivo. IBMS BoneKEy 5(11):410–425 van Lenthe GH, Voide R, Boyd SK, Muller R (2008) Tissue modulus calculated from beam theory is biased by bone size and geometry: implications for the use of three-point bending tests to determine bone tissue modulus. Bone 43(4):717–723
van Rietbergen B, Weinans H, Huiskes R, Odgaard A (1995) A new method to determine trabecular bone elastic properties and load-ing usload-ing micromechanical finite-element models. J Biomech 28(1):69–81
Warreth A, Polyzois I, Lee CT, Claffey N (2009) Generation of microdamage around endosseous implants. Clin Oral Implants Res 20(12):1300–1306
Wirth AJ, Mueller TL, Vereecken W, Flaig C, Arbenz P, Müller R, Lenthe GH (2010) Mechanical competence of bone-implant sys-tems can accurately be determined by image-based micro-finite element analyses. Arch Appl Mech 80:513–525