HAL Id: hal-01358404
https://hal.archives-ouvertes.fr/hal-01358404 Submitted on 31 Aug 2016
HAL is a multi-disciplinary open access
archive for the deposit and dissemination of sci-entific research documents, whether they are pub-lished or not. The documents may come from teaching and research institutions in France or abroad, or from public or private research centers.
L’archive ouverte pluridisciplinaire HAL, est destinée au dépôt et à la diffusion de documents scientifiques de niveau recherche, publiés ou non, émanant des établissements d’enseignement et de recherche français ou étrangers, des laboratoires publics ou privés.
Sylvain Jacques, Alain Guette, Xavier Bourrat, Francis Langlais, Claude Guimon, Christine Labrugère
To cite this version:
Sylvain Jacques, Alain Guette, Xavier Bourrat, Francis Langlais, Claude Guimon, et al.. LPCVD and characterization of boron-containing pyrocarbon materials. Carbon, Elsevier, 1996, �10.1016/0008-6223(96)00075-9�. �hal-01358404�
LPCVD AND CHARACTERIZATION OF
BORON-CONTAINING PYROCARBON MATERIALS
S. JACQUES, A. GUETTE, X. BOURRAT and F. LANGLAIS
Laboratoire des Composites Thermostructuraux
UMR 47 CNRS–SEP–UB1, Université de Bordeaux-I 3, allée de la Boëtie, 33600 Pessac, France
C. GUIMON AND C. LABRUGERE
Laboratoire de Physico-Chimie Moléculaire URA 474 CNRS, Université de Pau
2, av. du Président Angot, 64000 Pau, France
ABSTRACT
Pyrocarbon materials containing various amounts of boron have been prepared by LPCVD from BCl3–C3H8–H2 precursor mixtures. The growth rate is increased with respect to pure pyrocarbon deposition. By increasing BCl3 / (C3H8 + BCl3) ratio up to 85%, the incorporation of boron can reach 33 at.%. A small amount of boron (e.g. 8 at.%) highly enhances the anisotropy of pyrocarbon, as evidenced by optical microscopy, X-ray diffraction and transmission electron microscopy (selected area diffraction and lattice fringes techniques). X-ray photoelectron spectroscopy has shown that a large fraction of the boron atoms are included by substitution in the carbon layers, the remaining boron atoms belongs to a boron-rich amorphous part of the material. As boron content increases beyond 8 at.%, the anisotropy of the boron-rich pyrocarbon decreases, due to the limited growth and stacking of the carbon layers. Also, amorphous boron-rich regions are more and more abundant as the total amount of boron increases. The oxidation resistance of the C(B) materials is better than that of pure pyrocarbon. It is mainly due to the improvement of the structural organization for the low boron content materials and to the coating of the whole material with a stable boron oxide for materials with a higher boron content.
KEY WORDS
1. INTRODUCTION
Carbon-based materials exhibit outstanding mechanical properties, particularly at high temperatures. Nevertheless, their use in oxidizing environments is limited to temperatures lower than 500°C because of gasification of carbon as carbon oxides [1].
Phosphorus and boron based inhibitors or protective coatings have been proposed to overcome this drawback [2–6]. Several authors have studied the effect of impregnating carbon with boron oxide or organo-borates and reported a marked reduction of the oxidation rate of carbon in dry or moist air between 600 and 1000°C. McKee et al. have shown that boron oxide forms a glassy residue which blocks the active sites of the carbon surface [4]. This mechanism was also mentioned by Ehrburger et al., but only for small inhibitor contents (with segregation of B2O3 in clusters on the active sites), while they assumed an effective diffusion barrier for oxygen when the amount of boron oxide is high enough to form a continuous protective layer [5]. According to Rodriguez and Baker, such an oxide uniform film is impervious to oxygen attack only below 815°C, while beyond this temperature boron carbide is formed which acts as an active catalyst of the carbon–oxygen reaction [7].
Another way to protect carbon against oxidation is to insert boron within the carbon crystal structure. Ion implantation can dope the surface region with up to 12 at.% boron, as interstitial and substitutional atoms, metastable phases and vacancies [8]. Chemical vapour deposition (CVD) is a more suitable technique to prepare carbon materials with a high content of homogeneously distributed boron, as reported by Way et al. [9] and Cermignani et al. [8]. These authors have prepared BxC1–x materials from BCl3–C6H6 gaseous mixtures and obtained maximum boron contents of 15–17 at.%. Derré et al. [6] have reached a boron content in carbon of 22 at.% from BCl3–C2H2, gaseous mixture and Kouvetakis et al. [10] have reported the CVD preparation of a BC3with a “graphite-like” structure.
In spite of these relatively high boron contents, the solubility of boron in graphite lattice is limited to 0.4 at.% under ambient conditions and can reach 1 at.% at 1850°C and 2 to 3 at.% for temperatures in the range 2000–2500°C [11,12]. On the basis of radiocrystallographic studies, it has been shown that the boron atoms are located in the graphite layers rather than between them and density measurements have permitted the assumption a substitutional solution rather than an intersticial one [12]. Beyond the limit of solubility, the appearance of boron carbide has been related to important changes in structural and mechanical properties of such BxC1–x materials [10].
In order to understand the behaviour of these boron-containing pyrocarbon materials, e.g. towards oxidation and mechanical loading, within a large range of boron content, CVD technique is chosen in the present study to prepare such
materials, with BCl3–C3H8–H2 as precursor gaseous mixture. Then, a study of the chemical and microstructural arrangement is presented, on the basis of a variety of characterization techniques.
2. EXPERIMENTAL 2.1. Pyrocarbon CVD
The CVD apparatus is schematically represented in figure 1. The hot-wall reactor is a horizontal silica glass tube (50 mm in inner diameter) heated by a resistive electrical furnace. The parameters of the process are automatically controlled by specific devices. The total pressure P is maintained in the reactor at a constant value of 1.0 kPa by a vacuum pump through a mechanical regulating system and a pressure gauge. Liquid nitrogen traps permit the condensation of corrosive by-products such as HCl. Mass flowmeters are used to control the partial gas flow rates of the components of the precursor mixture. H2 is used as both a carrier gas and a reducing agent to promote boron content. Its flow rate Q(H2) is adjusted at 200 sccm (standard cm3min–1, i.e. at P = 101 kPa and T = 293 K) and the total flow rate of the source gases Q(C3H8) + Q(BCl3) is fixed at 80 sccm. The initial composition is defined by
the following ratio
α
= 100 x Q(C Q(BCl3)3H8) + Q(BCl3) . The temperature T is controlled with a Pt/PtRh thermocouple. Recording of thermal profiles inside the tube has evidenced a quasi-isothermal zone (T ± 3°C) over about 80 mm, for the presently used temperature range, i.e. 850–1050°C. The deposits were prepared on Nicalon(1) SiC-based fibers and on flat SiC substrates.
2.2. Characterization
The deposit thickness was evaluated by measuring diameters of Nicalon fibers before and after deposition according to a laser diffraction technique [13].
The composition of BxC1–x materials deposited on flat substrates was determined by an electron probe micro-analysis (EPMA)(2) in which the concentrations were derived from X-ray line intensities by using the wavelength dispersive (WDS) X-ray spectroscopy mode. Diamond and pure boron were used as standards. The chemical homogeneity of the deposits was characterized by Auger electron spectroscopy (AES)(3) with simultaneous Ar+ etching of thin films (about 500 nm in thickness) deposited on the fibres, the
(1) a Si-C-O fiber (ceramic grade NL 200) from Nippon Carbon, Japan.
(2) CAMEBAX from CAMECA, Courbevoie, France.
atomic concentrations of carbon, boron, oxygen and silicon being estimated from the intensities of the signals (derivative mode) corresponding to the C-KLL, B-C-KLL, O-KLL and Si-LVV transitions.
To analyse the various bonds in which boron is involved, X-ray photoelectron spectroscopy (XPS)(4) was used on flat substrates without performing any etching of the surface to prevent the chemical bonds from being modified. XPS analyses were performed using a focused (diameter of irradiated area, 300 µm) monochromatic AlKa radiation (10 kV; 7 mA). The residual pressure inside the analysis chamber was about 5 x 10⁻⁸ Pa. The spectrometer was calibrated by using the photoemission lines of Au (Au 4f7/2, 83.9 eV with reference to the Fermi level) and Cu (Cu 2p3/2, 932.5 eV). For the Au 4f7/2 line, the full width at half-maximum (FWHM) was 0.8 eV in the recording conditions. Experimental peaks (recorded with a constant pass energy of 50 eV) were decomposed into theoretical bands (80% gaussian and 20% lorentzian) with a non-linear baseline [14]. Quantitative analyses (carried out with a pass energy of 150 eV) were performed using Scofield [15] factors. The transmission T of the spectrometer and the electron mean free path λ are given by the following equation: λT = Ek0.7 where Ek is the kinetic energy of the photoelectron.
The morphology of the fracture surface and the external surface of the deposits was observed with a Scanning Electron Microscope (SEM)(5).
The long range structural anisotropy of the different C(B) materials was investigated by means of optical microscopy(6). Measurements were performed on polished cross-sections under polarized light as described by Diefendorf and Tokarsky [16]. The extinction angle, Ae, is indirectly a measurement of the reflecting power of the carbon. In the case of graphite, a maximum of 22° is found (isotropic carbon gives 0°): in-between, the higher the angle, the higher the structural anisotropy. In this study it was assumed that the presence of boron does not disturb the measurement. Especially it was verified that the phase difference due to the birefringence is still negligible in order to distinguish accurately the extinction.
Structural measurements were performed by X-ray diffraction(7). The distance between the carbon planes, d002 spacing was measured. An in situ calibration of the peak positions was obtained by adding crystallized silicon powder to the coating. An apparent coherent length, Lc, was also deduced from the FWHM of the 002 diffraction band by Scherrer equation, in order to compare the different materials.
(4) SSI model 301 spectrometer.
(5) 840A from JEOL.
(6) MeF3 from REICHERT-JUNG.
Transmission electron microscopy was also used (TEM)(8). Cross sections for TEM were obtained as deposits on single fibers. The coated fibers were then embedded in ceramic cement and mechanically thinned. The thin sheets were then ion-milled(9) untill the electron transparency. For symmetrical 002 lattice imaging, a 11.5 nm-1 objective aperture was used.
Diffraction patterns were recorded by using a 0.8 µm-large aperture (SAD). The volume is large enough to quantify accurately the Orientation Angle (OA) of the pyrocarbons as recently described [17]. OA is the FWHM of the opening of the 002 arcs (in azimuth). It quantifies the local structural anisotropy, measuring the layer’s disorientation above the medium plane. The scale of OA angle is not linear. It extents from less than one degree for a single graphite crystal to tend asymptotically to 180° for the isotropic pyrocarbon.
The oxidation tests were performed on C(B) materials deposited on flat SiC substrates (1.5 x 1.0 x 0.2 cm3 in size) by using thermogravimetric analysis (TGA) in dry air flowing at 500 sccm under atmospheric pressure. The study was carried out in a vertical hot-wall alumina furnace (20 mm in diameter) at both temperatures of 700 and 800°C controlled by a chromel-alumel thermocouple. The samples were hung up through a SiC fiber (100 µm in diameter) to a microbalance(10 )with a sensitivity of 10 µg.
3. RESULTS AND DISCUSSION 3.1. Growth rate
The growth temperature was chosen at 950°C, i.e. high enough to promote structural anisotropy and low enough to favour the homogeneity of the C(B) coatings in thickness and composition. The growth rate was measured on Nicalon fibers for various initial compositions of the precursor gas mixture,
α
ratio being within the range 0 to 85%, as reported in Table 1 for the five samples referred to as samples I to V. A rapid increase of the growth rate with BCl3 content is observed, except above 70% where a slight decrease occurs. This activation could be attributed to the local depletion of H2 due to its reaction with BCl3 to form boron and HCl, which favours the decomposition of C3H8. This decomposition is probably almost total forα
= 70% and the decrease of the C3H8 initial content for higherα
values can explain the decrease of the growth rate.
(8) CM 30 ST from PHILIPS, The Netherlands.
(9) 600 Duo Mill from GATAN, USA.
3.2. Chemical analysis
The boron content of the various C(B) materials, determined by EPMA, increases from 0 to 33 at.% when
α
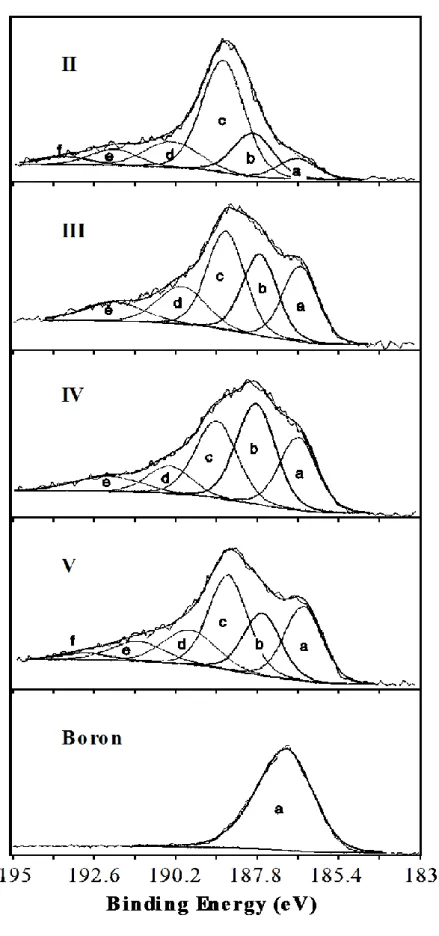
increases from 0 to 85%, as shown in Table 1. Oxygen is not detected in any deposit. The maximum of boron incorporation is not limited to 15–17 at.% as reported in previous works [8,9]. On the other hand, the composition is found to be rather homogeneous through the thickness obtained with 70% of BCl3 (Fig. 2).XPS spectra of boron (B1s) are reported in figure 3 for the four compositions of samples II to V and for the elemental boron standard (binding energy: 187.0 eV). The four spectra show identical components with various intensities. The low energy component (a) at (186.5 ± 0.1) eV can be assigned to boron atom clusters. The slight difference (of about 0.5 eV) with respect to the boron standard may originate in the dispersion of boron as small clusters in the material which affects the position of the Fermi level. The components (b) and (c) at (187.8 ± 0.1) eV and (188.8 ± 0.1) eV can be associated to a boron carbide such as B4C and a boron atom included by substitution in the graphitic structure, as proposed by Cermignani et al. [7]. The high energy components (d), (e) and (f) correspond to boron atoms more and more oxidized, i.e. BC2O at (190.0 ± 0.1) eV, BCO2 at (192.0 ± 0.1) eV and B2O3 at (193.2 ± 0.1) eV. These partially oxidized boron atoms occur only at the extreme surface of the samples which are not etched for XPS analyses as already mentioned: within the bulk, EPMA and AES have not detected oxygen atoms. It is worth noting that the (b) and (c) components of boron can be associated to two components found in the peak of carbon (C1s): (282.6 ± 0.1) eV for carbon in B4C and (284.0 ± 0.1) eV for graphitic carbon. Table 2 gives the proportions of the various types of boron atoms for four different materials. The boron of deposit II is mainly substituted in the graphitic layer structure. Deposits III and IV contain increasing amounts of elemental boron and B4C-type boron. The last deposit (V), with a high boron content, exhibits a relatively intense component (c) (Fig. 3).
3.3. Microstructural analysis
The morphology of the various C(B) coatings is shown on SEM micrographs of figure 4. Even if the external surface seems to be rather smooth and homogeneous in all cases, fracture surface points out qualitative difference among these materials. Materials I and III exhibit a laminated fracture surface. This is even more pronounced in material II which is very thinly laminated. On the contrary, materials IV and V exhibit a brittle fracture as asserted by the flat conchoidal aspect of the fracture surface, similar to that of the fiber.
This anisotropic character of coating II is confirmed by the values of the extinction angle Ae and the orientation angle, OA, at a different scale (Table 3). For a higher boron content (about 15 at.% for material III), the structural anisotropy becomes much lower and close to that of material I (pure pyrocarbon). Materials IV and V can be considered isotropic since the Maltese cross does not occur.
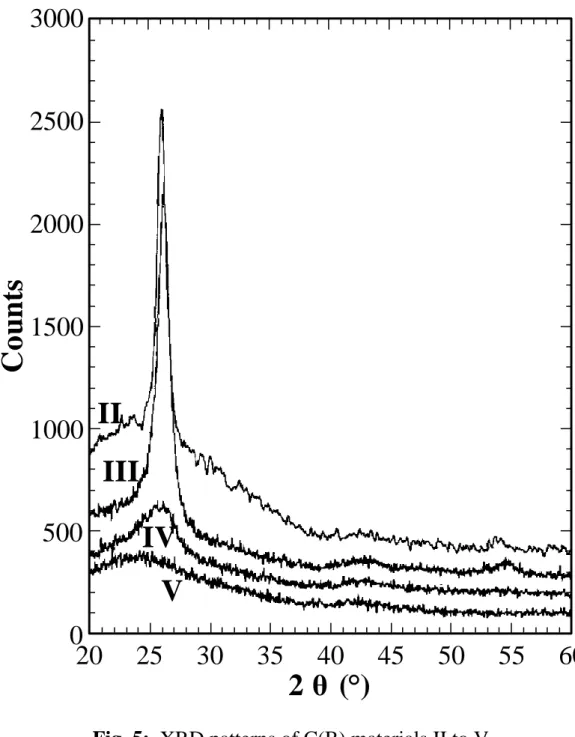
XRD patterns are typically those of turbostratic carbons (Fig. 5), except for deposit V where only a broad feature is observed instead of 002 peak, evidence for the very weak organization of the carbon. Data derived from these patterns, i.e. d002 spacing and Lc crystallite height are given in Table 4. Lc exhibits a maximum for sample II which confirms its high ordering in accordance with its high structural anisotropy. Conversely, the d002 values reach a minimum of 337-339 pm for samples II and III. This value is very close to that of graphite (335.4 pm) with regards to the very low growth temperature (950°C). When the boron content increases from 8 to 15 at.% (II to III), the anisotropy and turbostratic ordering decrease, while the interlayer spacing keeps rather constant. This is consistent with the results obtained by Way et al. [9] which show a decrease of the d002 spacing in boron-rich pyrocarbon. The increase of boron content seems to result in a competition between (i) the improvement of the local order of the carbon layer stacks (d002 decrease) and (ii) the damaging of the organization extent at the long distance scale (Lc decrease). The material IV is much less organized: higher d002 spacing and much lower Lc. This amorphization is enhanced (d002 ≈ 367 pm) when the boron content is increased from 20 to 33 at.% (IV to V). This could be associated to the increase of component (c) observed for material V in XPS B1s photoelectron peak (Table 2): a greater amount of boron being incorporated in poorly organized carbon, may be by substitution and intercalation. Furthermore, the small crystallite size enlarges the amount of boron present at the crystallite periphery, which also increases component (c).
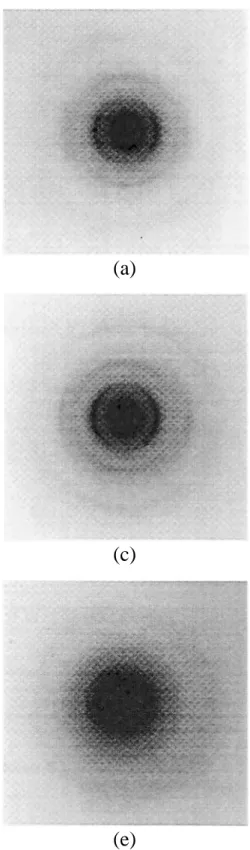
In order to confirm these overall results and to give a more explicit description of the microstructure of the studied materials, a local characterization by TEM was carried out. Electron diffraction confirms the previous results obtained at higher scale by XRD. Figure 6 gives the pattern obtained from each of the five materials with an increasing boron content. First, the turbostratic ordering increases by comparing I, II and III. For example 002 arcs are thinner and thinner whereas 004 are clearly appearing. OA, that characterizes the structural anisotropy, is optimal in the case of material II then degrades afterwards. Then the structure appears more and more amorphous: pattern IV exhibits three Debye-Scherrer rings whereas pattern V is characterized by a high central scattering and the same three rings but broader. In these two last cases, carbon layers are oriented at random (isotropy) and the broadening of the bands points to a dispersion of the C-C lengths. Finally, note
that electron diffraction does not evidence any other crystallized lattice as boron content increases. On the contrary, the pattern exhibits the occurrence of an amorphous phase, marked by an increasing intensity at small angle.
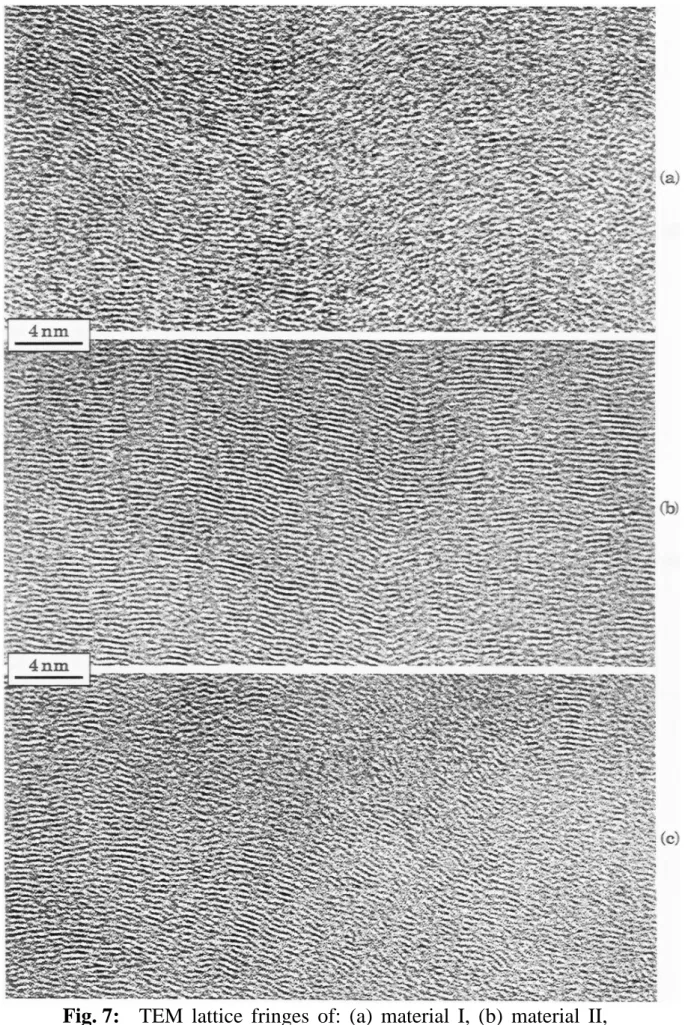
Lattice fringes technique was then performed on the different materials. A set of representative micrographs is given in figure 7. To make out quantitative data Oberlin's nomenclature [18] was followed: N is the number of fringes involved in a turbostratic stack, L1 is the mean length of the straight part of fringes whereas L2 is the mean value of the total length of the (distorted) fringes. The structural data are reported in Table 5 for the different materials.
In order to thoroughly interpret the phase contrast, it must be considered that small coherent domains still diffract even if the Bragg conditions are very much relaxed. The maximum angle can be calculated with the series of rocking curves as given in figure 8 [19]. The intensity was plotted versus the deviation angle (from the ideal Bragg conditions) in three different cases (Lc = 0.5 nm, 1 nm and 2 nm). If it is considered that the coherent domain (in azimuth) is still significantly scattering when more than 60% of the intensity is involved, then a pyrocarbon stack tilted with more than ± 4° from the Bragg angle will appear "amorphous". In the same way, it can be found: ± 2° and ± 3° in the case of material II and III, and ± 8° for material V.
For deposit I (pure pyrocarbon), the lattice fringes exhibit a weak contrast, which results from domains highly tilted with respect to the Bragg conditions. The number of layers involved in a stack is relatively small (N ≈ 6 and
L2 ≈ 2.8 nm). This is typical of dark laminar pyrocarbon that can be obtained at relatively low temperature (950°C).
The high resolution image of deposit II (8 at.% of boron) shows a high contrast and large stacks (N ≈ 11 and L2 ≈ 5.0 nm) on the whole observed zone. This result confirms the high structural anisotropy of this material, already reported by optical microscopy, SAD and XRD. This very small disorientation is high enough to interpret the "amorphous" areas as tilted stacks (here ± 2° are enough to lose the Bragg conditions). This is consistent with the largely predominant component (c) in XPS B1s photoelectron peak, i.e. boron atoms included in the graphitic layers of carbon (Fig. 3 and Table 2).
The three other deposits III, IV and V seem to be a mixture with variable amounts of pyrocarbon and amorphous material.
For deposit III (15% of boron), fringes contrast is higher than that of deposit I in spite of a similar rather low structural anisotropy. The mean number of stacked layers is high (N ≈ 9) and similar to that of deposit II. The mean diameter of the layers (L2 ≈ 2.3 nm) is lower than that of deposit II. The regions without fringe are not extended, but they characterize the occurrence of amorphous material rather than a tilt with respect to the 002 Bragg conditions. This amorphous part of material III, which can be associated to components (a)
(elemental boron) and (b) (B4C-type boron) of the XPS B1s photoelectron peak, could limit the lateral growth of graphitic carbon layers.
The deposit IV (20 at.% of boron) seems to be poorly organized with larger amorphous zones and small layer stacks disoriented from each other.
For deposit V (33 at.% of boron), a quasi-amorphous aspect is observed. Nevertheless, a large amount of very small layer stacks can explain the incorporation of a fair amount of boron atoms in sp2-type carbon, as observed by XPS (Fig. 3).
A schematic representation which summarizes the nanostructures of the five studied materials, is given in figure 9.
3.4. Oxidation resistance
It is worth noting that a direct comparison of raw mass variations is possible since each sample presents the same exposed surface. Figure 10 gives the mass loss versus time for the various C(B) materials in dry air at 700 and 800°C. As boron content increases, the mass loss is less and less important, which mainly results from the increasing amount of boron oxide. This behaviour is in good accord with the oxidation tests performed by Derré et al. [6] on C0.78B0.22 material.
However, the TGA curves measure the overall mass variations of the samples, including both the gasification of carbon and boron oxide formation. In order to evaluate the protecting effect of boron towards carbon, the mass variations due to only the carbon gasification has been derived from the overall experimental mass loss through the following hypotheses: (1) the studied material contains only carbon and boron according to the analyses previously reported (Table 1); (2) their composition is homogeneous on the whole surface; (3) the consumption of each element is proportional to its atomic percentage; (4) boron is oxidized into B2O3 which is not gasified under the conditions of this study. The details of the calculations are given in the appendix and the results reported in figure 11. A marked protecting role of boron towards carbon is evidenced even for low boron contents. This effect is more important at 800°C than at 700°C, but it seems to be very similar for all the tested C(B) materials. For deposit II, the better oxidation resistance with respect to pure pyrocarbon could be attributed to (i) a decrease of the number of active sites by improving the crystallization state (larger crystallites and only low distortions between them) and (ii) an inhibition of these sites by boron atoms which give rise to stable coating of boron oxide. As the boron content increases (from material II to material V), the number of active sites (or potential oxidation sites) increases, due to damaging of the organization extent (increase of the crystallite’s number and decrease of their size), but their inhibition is possible by incorporation of a higher amount of boron and a thicker and thicker uniform coating of boron oxide after oxidation.
4. CONCLUSION
The association of different characterization techniques (EPMA, XRD, optical microscopy, XPS and TEM) had allowed us to determine the influence of boron concentration (up to 33 at.%) on LPCVD boron-containing pyrocarbon nanostructures. For a small boron content (8 at.%), a large fraction of boron atoms are included by substitution in the pyrocarbon network enhancing its graphitization extent, the remaining boron atoms belonging to a boron-rich amorphous part of the material. As boron content increases, this amorphous part becomes more extended which decreases the structural anisotropy of the material. The oxidation resistance of these materials is improved compared to pure pyrocarbon. These different results allow us to consider the use of these C(B) materials as components of ceramic matrix composites.
ACKNOWLEDGEMENTS
This work has been supported by CNRS and SEP through a grant to S. JACQUES. The authors are grateful to F. Doux and S. Goujard from SEP and R. Naslain from LCTS for fruitful discussions.
REFERENCES
[1] J.E. Sheehan, "Oxidation protection for carbon fiber composites", Carbon, 27 [N° 5], pp 709-715, (1989).
[2] P. Magne, H. Amariglio and X. Duval, "Etude cinétique de l'oxydation du graphite inhibée par les phosphates", Bull. Soc. Chim. France, 6, pp 2005-2010, (1971).
[3] D.W. McKee, "Borate treatment of carbon fibers and carbon/carbon composites for improved oxidation resistance", Carbon, 24 [N° 6], pp 737– 741, (1986).
[4] D.W. McKee, C.L. Spiro and E.J. Lamby,"The effects of boron additives on the oxidation behavior of carbons", Carbon, 24 [N° 6], pp 507-511, (1984).
[5] P. Ehrburger, P. Baranne and J. Lahaye, "Inhibition of the oxidation of carbon–carbon composite by boron oxide", Carbon, 24 [N° 4], pp 495–499, (1986).
[6] A. Derré, L. Filipozzi and F. Peron, J. de Physique IV, C3 3, 195 (1993).
[7] N.M. Rodriguez and R.T.K. Baker, "Fundamental studies of the influence of boron on the graphite–oxygen reaction using in situ electron microscopy techniques", J. Mater. Res., 8 [N° 8], pp 1886–1894, (1993).
[8] W. Cermignani, T.E. Paulson, C. Onneby and C.G. Pantano, "Synthesis and characterization of boron-doped carbons", Carbon, 33 [N° 4], pp 367– 374, (1995).
[9] B.M. Way, J.R. Dahn, T. Tiedje, K. Myrtle and M. Kasrai, "Preparation and characterization of BxC1–x thin films with the graphite structure", Phys. Rev. B : Condens. Mater., 46 [N° 3], pp 1697–1702, (1992).
[10] J. Kouvetakis, R. B. Kaner, M. L. Sattler and N. Bartlett, J. Chem. Soc. Chem. Commun. 1758 (1986)
[11] R.N. Katz and C.P. Gazzara, "The influence of boron on the fine microstructure of pyrolytic graphite", J. Matter. Sci., 3, pp 61–69, (1968). [12] C.E. Lowell, "Solid solution of boron in graphite", J. Amer. Ceram. Soc.,
50 [N° 3], pp 142–144, (1967).
[13] G. Simon and A.R. Bunsell, "Mechanical and structural characterization of the Nicalon Silicon carbide fibre", J. Mater. Sci., 19, pp 3649–3657, (1984).
[14] D.A. Shirley, Phys. Rev. B, 5, 4709, (1972).
[15] J.H. Scofield, J. El. Spect. Relat. Phen., 8, 129, (1976).
[16] R.J. Diefendorf and E.W. Tokarsky, "The relationships of structure to properties in graphite fibers", Air Force Report AF 33(615)–70–C–1530 (1971).
[17] X. Bourrat, R. Pailler and P. Hanusse, "Quantitative analysis of carbon coating anisotropy for CMC interfaces", 21st Biennial Conference on Carbon, June 13–18, 1993, American Carbon Society, (1993).
[18] A. Oberlin, "High-Resolution TEM studies of carbonization and graphitization", in Chemistry and Physics of Carbon, a series of advances, P.A. Thrower ed., MARCEL DEKKER, INC. New York and Basel, vol. 22, pp 1–143, (1989).
[19] X. Bourrat, E.J. Roche and J.G. Lavin, "Mesophase-Pitch Fiber Structure", Carbon, 28 [N° 2], pp 435–446, (1990).
APPENDIX
The compositions of the studied C(B) materials are C1–xBx with x = 0 for
material I, x = 0.08 for material II, x = 0.15 for material III, x = 0.20 for material IV and x = 0.30 for material V.
∆mexp is the global experimental mass variation (shown in Fig. 9), ∆mc is due to only the carbon gasification (< 0) and ∆mo is related to oxygen gain due to boron oxidation (> 0). nc and no are the numbers of moles of carbon and oxygen. Mc and Mo are the atomic weights of carbon and oxygen.
∆mexp = ∆mc + ∆mo or ∆mexp = –ncMc + noMo (1)
According to the hypotheses of the present paper, when one mole of carbon is being gasified, 1–xx moles of boron is forming B2O3 by oxidation, so the
oxygen mole gain is: 32 . 1–xx moles. Thus:
no = 2(1–x)3x nc (2) Substitution of Equation (2) into (1) yields:
∆mexp = nc
(
3x2(1–x) Mo – Mc
)
(3)The product of carbon atomic weight Mc by nc calculated from Equation (3) yields to the expression of the carbon mass variation as a function of the global mass variation (with ∆mc = – ncMc) :
∆mc = 2(1–x)Mc – 3xMo2(1–x)Mc ∆mexp (4)
The calculated curves by using Equation (4) are reported in figure 11 for each studied C(B) material composition.
TABLES
Table 1: Growth rates and compositions of the C(B) coatings.
C(B) material
II
III
IV
V
(a) boron (%)
8
20
23
23
(b) B
4C (%)
18
24
32
19
(c) B-C in graphitic
structure (%)
48
32
27
31
(d) (%) B O C C 14 15 10 15 (e) (%) B C O O 8 9 8 9 (f) B2O3 (%) 4 0 0 3Table 2: Proportions of B1s components (XPS) for C(B) materials
II to V.
C(B) materials
I
II
III
IV
V
Ae (°)
10
19
11
/
/
OA (°)
94
72
107
/
/
Table 3: Optical extinction angle (Ae) measured in polarized light
and orientation angle (OA) measured on 002 arc (TEM-SAD patterns) for C(B) materials.
α (%)
0
30
50
70
85
C(B) material
I
II
III
IV
V
growth rate
(µm/h)
0.1
1.2
6.0
10.5
6.6
Boron content
(at. %)
0
8.3
(±0.5)15.1
(±0.7)20.0
(±0.8)33
(±1.5)C(B) materials
I
II
III
IV
V
FWHM (002) (°)
1.6
0.8
1.0
~ 5
~ 10
L
c(nm)
5.3
10.7
8.5
~ 1.7
~ 1
d
002(pm)
346
339
337
341
~ 367
Table 4: Full width at half maximum (FWHM), Lc, and d002 obtained from the X-ray diffraction carbon (002) Bragg peak for the studied C(B) materials.
C(B) materials
I
II
III
IV
V
N
6
11
9
4
3
L
1(nm)
0.4
1.0
0.6
0.3
0.2
L
2(nm)
2.8
5.0
2.3
1.5
0.9
FIGURES
electr ical resistor furnace silica tube ø : 5 cm vacuum pump thermocouple mass f low controller or Ar H2 C H3 8 BCl3
liquid nitr ogen tr ap pressur e sensor
diaphr agm pressur e controller
substr at e
0 20 40 60 80 100 0 A p p ar e n t at om ic p e r ce n tage 0.2 0.4 0.6 0.8 C Thi ck ne s s ( µm ) C C B B B Si Si Si O O O
Fig. 2: AES atomic concentration profiles for a 0.5 µm thick C(B)
Fig. 3: The deconvoluted B1s XPS peak for C(B) coatings II to
(a) (b)
(c) (d)
(e)
Fig. 4: SEM micrographs of fracture surfaces of C(B) coatings deposited on
Nicalon fibers. (a): material I (2.6 µm thick); (b) material II (11.5 µm thick); (c) material III (15.0 µm thick); (d) material IV and (e) material V (11.6 µm thick).
Fig. 5: XRD patterns of C(B) materials II to V.
II
III
IV
V
20
25
30
35
40
45
50
55
60
0
500
1000
1500
2000
2500
3000
2 θ ( )
C
o
unts
(a) (b)
(c) (d)
(e)
Fig. 6: Electron SAD patterns of: (a) material I, (b) material II, (c)
Fig. 7: TEM lattice fringes of: (a) material I, (b) material II,
0 0.2 0.4 0.6 0.8 1 0 4 D if fr ac te d I n te n si ty 8 12 16 20
De vi ation An gle (de gre e s )
2.0 nm
1.0 nm
0.5 nm
(a)
(b)
Fig. 10: Overall mass variations versus time for the various C(B) materials at
700°C (a) and 800°C (b). -3.5 -3 -2.5 -2 -1.5 -1 -0.5 ²m ( m g) 0 0 2 4 6 8 10 I Tim e (h) II III IV V Δ -7 -6 -5 -4 -3 -2 -1 ²m ( m g) 0 0 2 4 6 8 10 I Tim e (h) II III IV V Δ
(a)
(b)
Fig. 11 : Calculated mass variations due to only the carbon gasification versus
time for the various C(B) materials at 700°C (a) and 800°C (b). -3.5 -3 -2.5 -2 -1.5 -1 -0.5 0 0 ²m C ( m g) 2 4 6 8 10 I II III Tim e (h) IV V Δ -7 -6 -5 -4 -3 -2 -1 0 0 ²m C ( m g) 2 4 6 8 10 I II III Tim e (h) IV V Δ


![Fig. 8: Rocking curves for various sizes of the coherent (002) domains [19].](https://thumb-eu.123doks.com/thumbv2/123doknet/13111068.386738/24.892.188.694.112.529/fig-rocking-curves-various-sizes-coherent-domains.webp)
