HAL Id: hal-02088272
https://hal.archives-ouvertes.fr/hal-02088272
Submitted on 16 Oct 2020HAL is a multi-disciplinary open access archive for the deposit and dissemination of sci-entific research documents, whether they are pub-lished or not. The documents may come from teaching and research institutions in France or abroad, or from public or private research centers.
L’archive ouverte pluridisciplinaire HAL, est destinée au dépôt et à la diffusion de documents scientifiques de niveau recherche, publiés ou non, émanant des établissements d’enseignement et de recherche français ou étrangers, des laboratoires publics ou privés.
Capturing Auxin Response Factors Syntax Using DNA
Binding Models
Arnaud Stigliani, Raquel Martin-Arevalillo, Jérémy Lucas, Adrien Bessy,
Thomas Vinos-Poyo, Victoria Mironova, Teva Vernoux, Renaud Dumas,
François Parcy
To cite this version:
Arnaud Stigliani, Raquel Martin-Arevalillo, Jérémy Lucas, Adrien Bessy, Thomas Vinos-Poyo, et al.. Capturing Auxin Response Factors Syntax Using DNA Binding Models. Molecular Plant, Cell Press/Oxford UP, 2019, 12 (6), pp.822-832. �10.1016/j.molp.2018.09.010�. �hal-02088272�
Capturing auxin response factors syntax using DNA binding models
1 2
Arnaud Stigliani1, Raquel Martin-Arevalillo1,2, Jérémy Lucas1, Adrien Bessy1, Thomas
3
Vinos-Poyo1, Victoria Mironova3,4, Teva Vernoux2, Renaud Dumas1 and François Parcy1,*
4 5
1: Univ. Grenoble Alpes, CNRS, CEA, INRA, BIG-LPCV, 38000 Grenoble, France 6
2: Laboratoire de Reproduction et Développement des Plantes, Univ Lyon, ENS de 7
Lyon, UCB Lyon1, CNRS, INRA, 46 allée d’Italie, F-69364, Lyon, France 8
3: Novosibirsk State University, Pirogova street 2, Novosibirsk, Russia 9
4: Institute of Cytology and Genetics SB RAS, Lavrentyeva avenue 10, Novosibirsk, 10
Russia 11
12
*Contact: François Parcy Tel: +33 0438784978 Fax: +33 0438784091; Email: 13
ABSTRACT
15
Auxin is a key hormone performing a wealth of functions throughout the plant life 16
cycle. It acts largely by regulating genes at the transcriptional level through a family of 17
transcription factors (TF) called auxin response factors (ARF). Even if all ARF 18
monomers analysed so far bind a similar DNA sequence, there is evidence that ARFs 19
differ in their target genomic regions and regulated genes. Here we use position weight 20
matrices (PWM) to model ARF DNA binding specificity based on published DNA 21
affinity purification sequencing (DAP-seq) data. We find that the genome binding of 22
two ARFs (ARF2 and ARF5/Monopteros/MP) differ largely because these two factors 23
have different preferred ARF binding site (ARFbs) arrangements (orientation and 24
spacing). We illustrate why PWMs are more versatile to reliably identify ARFbs than 25
the widely used consensus sequences and demonstrate their power with biochemical 26
experiments on the regulatory regions of the IAA19 model gene. Finally, we combined 27
gene regulation by auxin with ARF-bound regions and identified specific ARFbs 28
configurations that are over-represented in auxin up-regulated genes, thus deciphering 29
the ARFbs syntax functional for regulation. This provides a general method to exploit 30
the potential of genome-wide DNA binding assays and decode gene regulation. 31
Running title: Deciphering ARF DNA binding syntax
32 33
INTRODUCTION
34
Auxin is a key hormone in plants affecting multiple developmental processes 35
throughout the lifecycle of the plant. Most long-term developmental auxin responses 36
(such as embryo polarity establishment, tropisms, phyllotaxis or secondary root 37
emergence) involve modifications of gene expression by the nuclear auxin pathway 38
(Lavy and Estelle, 2016; Weijers and Wagner, 2016). This pathway includes a family 39
of transcription factors (TFs) called Auxin Response Factors (ARF) (Weijers and 40
Wagner, 2016; Leyser, 2018). In the absence of auxin, the Aux/IAA repressors bind 41
ARF TFs and form inactive multimers thereby preventing their activity (Han et al., 42
2014; Korasick et al., 2015). The presence of auxin leads to the degradation of Aux/IAA 43
proteins and therefore allows ARFs to activate transcription. 44
ARF proteins exist in 3 classes (A, B and C) with class A corresponding to ARF 45
activators and B and C to ARF repressors (Finet et al., 2013). Understanding ARF 46
biochemical properties (DNA binding specificity, capacity to activate or repress 47
transcription, capacity to interact with partners) is important to decipher how different 48
tissues could respond differently to the same auxin signal (Leyser, 2018). ARFs are 49
modular proteins with several functional domains: most ARFs (except ARF3/ETTIN, 50
ARF17 and ARF23) have a PB1 domain (previously called domain III/IV) responsible 51
for interaction with the Aux/IAA repressors, TFs from other families and possible 52
homo-oligomerization through electrostatic head-to-tail assembly (Nanao et al., 2014; 53
Korasick et al., 2014; Parcy et al., 2016; Weijers and Wagner, 2016; Mironova et al., 54
2017). ARFs also possess a DNA binding domain (DBD) from the plant specific B3 55
family. The structure of this DBD has been solved for ARF5 (also called 56
Monopteros/MP) and ARF1 revealing a B3 domain embedded within a flanking 57
domain (FD) and a dimerization domain (DD) (Boer et al., 2014). The DD allows ARF 58
proteins to interact as a face-to-face dimer with a DNA element called an everted repeat 59
(ER) made of two ARF binding sites (ARFbs). ARFbs have been originally defined as 60
TGTCTC (Ulmasov et al., 1995; Guilfoyle et al., 1998) and this knowledge was used 61
to construct a widely used auxin transcriptional reporter, DR5 (Ulmasov et al., 1997). 62
More recently, Protein Binding Microarray (PBM) experiments suggested that 63
TGTCGG are preferred ARFbs and a new version of DR5, DR5v2, was built based on 64
this cis-element (Boer et al., 2014; Franco-Zorrilla et al., 2014; Liao et al., 2015). ARFs 65
are able to bind different ARFbs configurations in addition to ER such as direct repeats 66
(DR) or, as recently suggested, inverted repeats (IR) (O’Malley et al., 2016). Whether 67
ARF oligomerization through the PB1 domain contributes to binding of some ARFbs 68
configurations such as IR or DR that are not compatible with DD dimerization has been 69
proposed but not yet demonstrated (O’Malley et al., 2016; Parcy et al., 2016). Based on 70
affinity measurements of interaction between ARF DBD (for ARF1 and MP) and a few 71
ER cis-elements, it was proposed that ARFs differ by the type of ER configuration they 72
prefer: the ARF1 repressor has a much narrower range of preferences than the MP 73
activator (this was called the molecular caliper model) (Boer et al., 2014). However, 74
this model was established using isolated ARF DBD lacking the PB1 domain and did 75
not include interaction with DR and IR ARFbs configurations. 76
Despite the central importance of ARF TFs, models reliably predicting their DNA 77
binding specificity are still scarce (Keilwagen et al., 2011; Mironova et al., 2014) and 78
simple consensus sequences are often used (Berendzen et al., 2012; O’Malley et al., 79
2016; Zemlyanskaya et al., 2016) that hardly capture possible sequence variation within 80
the cis-element. Recently, DNA affinity purification sequencing (DAP-seq) data have 81
offered a genome-wide view for two full-length ARF proteins of Arabidopsis (the 82
repressor ARF2 and the activator MP) (O’Malley et al., 2016). The DAP-seq assay is 83
technically similar to ChIP-seq but with chromatin-free isolated genomic DNA and 84
with a single recombinant protein added. Based on TGTC consensus sequence as 85
ARFbs definition, the MP activator and the ARF2 repressor appear to have different 86
preferred DNA binding sites. They share a novel inverted repeat (IR7-8) element but 87
also have specific binding sites with different spacing and orientation of ARFbs 88
(O’Malley et al., 2016). Here we undertook an extensive reanalysis of DAP-seq data 89
using position weight matrix (PWM) as the DNA binding specificity model 90
(Wasserman and Sandelin, 2004). PWMs represent a simple but efficient tool that 91
captures the base preference at each position of the motif. PWMs give a score to any 92
DNA sequence with zero for the optimal sequence and more negative scores as the 93
sequence diverges from the optimum. The PWM score is then a quantitative value 94
directly related to the affinity of the DNA molecule for the protein (Berg and von 95
Hippel, 1987). Using PWMs, we establish differences between ARF2 and MP and show 96
that they reliably identify a binding site syntax explaining their specificity. We further 97
illustrate the predictivity of PWM as compared to consensus using binding assays and 98
identify ARFbs configurations enriched in promoters of genes regulated by auxin. 99
RESULTS
100
ARF2 and MP have similar DNA binding sites but bind different genome regions
101
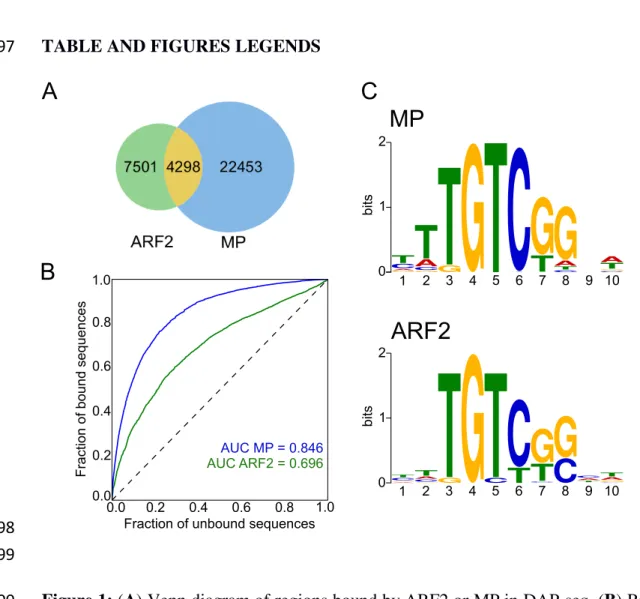
Using the published DAP-seq data (O’Malley et al., 2016), we first compared the sets 102
of genomic regions bound by ARF2 and MP. Two regions were considered bound by 103
both factors when they overlapped by at least 50% (see Methods). As expected for two 104
TFs from the same family, there is a significant overlap and many regions are bound 105
by both factors (Figure 1A). However, the large number of regions specifically bound 106
by only one of them indicates a clear difference between ARF2 and MP DNA binding 107
preferences (Figure 1A). This remains true even when focusing on regions bound with 108
the highest confidence (top 10%, see Methods) by each of the factors (Supplemental 109
Figure 1). We intended to explain these differences by characterizing ARF2 and MP 110
DNA binding specificity. The examination of the DNA motif logo derived from regions 111
recognized by ARF2 or MP monomers revealed only minor differences (Figure 1C). 112
For both logos, the G[4] position corresponding to a direct protein-base contact in the 113
ARF1 structure (Boer et al., 2014) is highly invariant. At positions [7,8] where the 114
original ARFbs harboured TC (Guilfoyle et al., 1998), the preferred sequence is GG as 115
recently proposed from PBM experiments (Boer et al., 2014; Franco-Zorrilla et al., 116
2014) but this preference is not as pronounced as in PBM-derived logos and sequence 117
variations at these positions is tolerated. 118
We built ARF2 and MP PWMs to model their DNA binding. We evaluated the 119
prediction power of each PWMs using Receiver Operating Characteristics Area Under 120
the Curve analysis (ROC-AUC or AUROC) (Hanley and McNeil, 1982) based on the 121
ARFbs of best score present in each bound region (Figure 1B). Such analysis yields an 122
AUROC value of 1 for a perfect model and 0.5 for a model with no predictive value. 123
This analysis requires the generation of a negative set of regions for comparison. For 124
this, we improved a previously designed tool, a negative set builder (Sayou et al., 2016), 125
to extract from the Arabidopsis genome a set of non-bound regions with similar features 126
as bound ones (size, GC content, genomic origin – see Methods). Based either on the 127
full set of bound regions (Figure 1B) or only the 10% top ranked regions (Supplemental 128
Figure 1), we found that MP model is highly predictive (AUROC= 0.84) while ARF2’s 129
has a lower performance (AUROC= 0.69). 130
PWM models assume an additive contribution of each nucleotide position, a hypothesis 131
that is not always true (Bulyk, 2002; Moyroud et al., 2011; Zhao et al., 2012; Mathelier 132
and Wasserman, 2013). We used Enologos (Workman et al., 2005) to test for the 133
presence of dependencies between some of the positions, particularly for positions [7,8] 134
(Figure 1C) where mostly GG and TC doublets have been proposed so far. Enologos 135
did not detect any dependency (Supplemental Figure 1) indicating that standard PWM 136
can be adequately used. We also wondered whether the small differences between 137
ARF2 and MP PWMs (as visible on their logos from Figure 1C) could contribute to 138
their binding specificity. We thus tested the MP PWM on ARF2 regions and, 139
conversely, ARF2 PWM on MP regions. The performance is indeed slightly weaker 140
showing there is some specificity in the monomer PWM (Supplemental Figure 1). 141
However, the very small difference suggests there must be other parameters explaining 142
ARF2 and MP different specificities. 143
ARF2 and MP prefer different binding site configurations
144
Published analyses (O’Malley et al., 2016) suggested that MP and ARF2 might differ 145
in their preferred ARFbs dimeric configurations (ER, DR or IR, Figure 2A). We thus 146
analysed the distribution of spacings between ARFbs using PWM models. To do this, 147
a score threshold needs to be chosen above which transcription factor binding site 148
(TFBS) are considered. As this threshold cannot be experimentally determined, we 149
performed the analysis within a range of scores (from -8 to -13, -8 being of better 150
affinity than -13). We studied the overrepresentations of all dimer configurations (DR, 151
ER and IR) as compared to a negative set of regions. Overall, DR, ER and IR are more 152
frequent in the ARF bound regions than in the negative set (Figure 2B, left panel), 153
consistent with the higher density of ARFbs in these regions. We next estimated the 154
overrepresentation of each particular configuration (ERn, DRn or IRn with the spacing 155
n varying between 0 and 30 bp) within the whole population of configurations and 156
normalized it to the equivalent parameter in the negative set of regions (Figure 2). For 157
example, if, for a given value of n, DRn represents 10% of all configurations 158
(ER/DR/IR with 0≤n≤30) in the positive set and only 2% in the negative one, DRn 159
enrichment will be 5-fold. 160
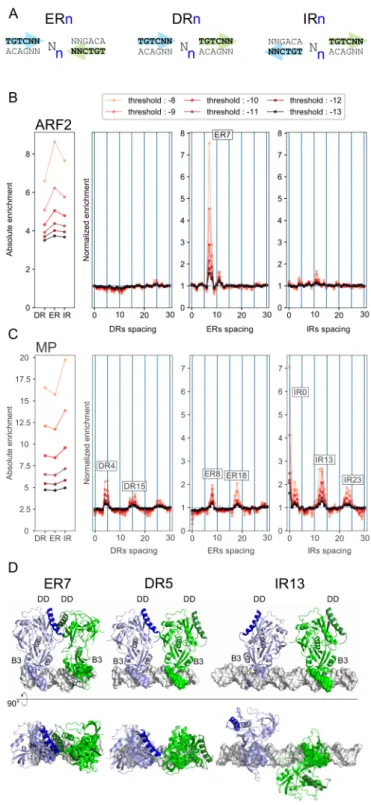
This analysis revealed a striking difference between ARF2 and MP. For ARF2, ER7-8 161
are the only overrepresented configurations whereas MP showed a wider range of 162
preferred distances and configurations including DR4-5, DR14-15-16, DR25-26, ER7-163
8, ER17-18, IR0, IR3, IR12-13, IR23-24 (Figure 2B). Our results contrast with 164
O’Malley’s where IR8 was the most overrepresented configuration for both factors 165
(O’Malley et al., 2016). Since their result was obtained using a TGTC consensus as 166
ARFbs definition, we repeated our analysis with TGTC (Supplemental Figure 2A). We 167
still validated our result suggesting O’Malley et al. likely confused ER and IR. The MP 168
graph (Figure 2B) suggests a periodicity of overrepresented distances every 10 bp, a 169
hypothesis we confirmed by extending the distance window, revealing this trend for 170
MP but not for ARF2 (Supplemental Figure 2B). Modelling of DR5 and IR13 171
protein/DNA complexes structures based on ARF1 crystallographic data (PDB entry 172
4LDX) clearly illustrates that these configurations are incompatible with the 173
dimerization mode described for ER7 and could involve a different dimerization 174
interface (Figure 2D). 175
ARF2 and MP have different DNA binding syntax
176
We re-examined the Venn diagram from Figure 1A in the light of the identified 177
preferred configurations. We separated ARF2 and MP bound regions in three sets: 178
ARF2 specific, MP specific, ARF2/MP common regions. Because the two PWMs are 179
very similar, we used the ARF2 matrix and performed the same analysis as in Figure 2 180
but on the three sets of regions (Supplemental Figure 3). DR4/5/15 and IR0/13 are 181
overrepresented only in MP specific regions, ER7 in ARF2 specific regions and ER7/8 182
mostly in the MP/ARF2 common regions. Remarkably, MP-specific regions are even 183
depleted in ER7/8 compared to the negative set of sequences because these elements 184
are bound by both ARF2 and MP (Supplemental Figure 3). Plotting the frequency of a 185
few selected configurations illustrates the group specific characteristics (Figure 3). We 186
also used RSAT (Medina-Rivera et al., 2015) to search for other sequence features that 187
could distinguish the three groups of regions. For ARF2-bound regions only, we found 188
an enrichment for nine long AT-rich motifs similar to the one shown in Figure 3B. 189
These motifs are found all along the bound regions (not shown). One example of 190
enrichment of such a motif is illustrated in Figure 3B. 191
Comparison between improved PWM models and consensus
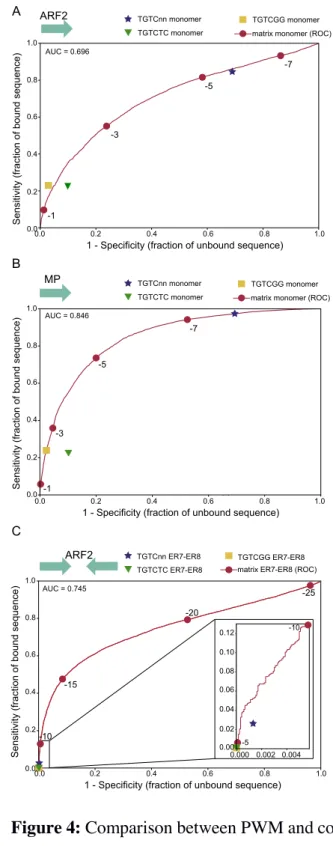
We incorporated the ARF2 and MP specific features in new PWM-based models and 193
tested their prediction power using AUROC. The improvement is marginal for MP but 194
better for ARF2 (Figure 4C, AUROC for monomeric ARF2bs = 0.69, for ER7/ER8 195
model = 0.74). To illustrate the fundamental differences between PWM and consensus, 196
we plotted the specificity (false positive rate) and sensitivity (true positive rate) 197
parameters on the PWM ROC curve (Figure 4). For the monomeric ARFbs models, the 198
TGTC consensus is poorly specific with almost 70% false positive rate. Conversely, 199
TGTCGG or TGTCTC perform correctly but leave no freedom in terms of sensitivity 200
and specificity: only the quantitative model allows to choose these parameters by 201
adjusting the score threshold. For ARF2 ER7/8 dimeric models, using any of the three 202
consensus is extremely stringent and detects very few sites in the positive set (at best 203
2.5% for TGTC) whereas the PWM model is again more versatile as it allows reaching 204
the desired specificity/sensitivity combination by adjusting the score threshold. 205
DNA binding models are extremely useful to detect transcription factor binding 206
site and challenge their role in vitro or in vivo. To scan individual sequences, PWMs 207
are superior as they provide a quantitative information linked to TFBS affinity (Berg 208
and von Hippel, 1987) and allow the detection of possible non-consensus sites of high 209
affinity. We used our models to identify binding sites on the well-studied promoter of 210
the IAA19 gene ((Pierre-Jerome et al., 2016) and references therein). Scanning the 211
IAA19 promoter sequence with ARF2 and MP PWMs identified several ARFbs (Figure
212
5) including a high-scoring ER8 site bearing one non-canonical gGTCGG that lacks the 213
TGTC consensus (Figure 5A). This site is located at the centre of a DAP-seq peak for 214
MP and ARF2. We tested ARF binding to this particular ER8 element and tested the 215
impact of the consensus presence on binding to ARF. For this, we restored the TGTC 216
consensus for this non-canonical ER8 element and also created an artificial ER8 that 217
has both TGTC consensus but suboptimal bases in other positions according to the 218
PWM (Figure 5B). Strikingly, the optimised PWM score better predicts the binding 219
than the presence of the consensus sequence: we observed intense binding on the non-220
canonical ER8, only a slight improvement when the consensus is restored and no 221
binding on a consensus-bearing ER8 of low score (Figure 5C). 222
PWM models reveal preferred ARFbs configurations in auxin regulated genes
We next tested the PWM models on in vivo data. ChIP-seq data are available for ARF6 224
and ARF3 (Oh et al., 2014; Simonini et al., 2017). However, no obvious ARFbs could 225
be identified in any of these datasets. Testing ARFbs monomeric or dimeric models 226
yielded a very poor AUROC value (0.61 for ARF6 and 0.58 for ARF3) suggesting that 227
these data might not be adequate to evaluate our model. We also used the auxin 228
responsive genes datasets derived from a meta-analysis of 22 microarray data (see 229
Methods). We defined 4 groups of regions of either auxin induced or repressed genes 230
with high or very high confidence (very-high confidence: 153 up regulated genes, 36 231
down regulated; high confidence: 741 up regulated, 515 down regulated, Supplemental 232
File). We first analysed the 1500 bp promoters of the regulated genes compared to 233
unregulated ones. This analysis revealed a mild but detectable over-representation of 234
ER8 in up-regulated promoters (Supplemental Figure 4) as compared to unregulated 235
ones and nothing in down-regulated genes. 236
Next, we tested whether more information could be extracted from these promoters if 237
only the DNA segments bound by ARF in DAP-seq were analysed. We focused on 238
auxin-induced genes and regions bound by the MP activator ARF because the 239
mechanism of gene induction by auxin is well understood, while repression by auxin 240
and the role of repressor ARFs such as ARF2 is less clear. We therefore compared MP-241
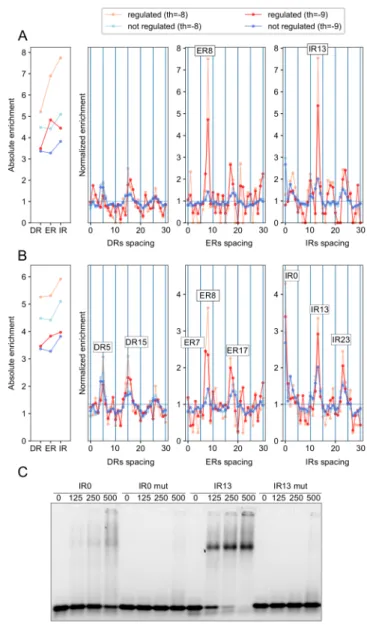
bound regions present in regulated versus non-regulated promoters. We observed that 242
the over-representation of ER8 and IR13 is higher in auxin upregulated genes than in 243
non-regulated ones (Figure 6A-B). This is particularly striking for the high-confidence 244
auxin induced genes even if this list likely also contains indirect ARF targets (Figure 245
6A). We tested MP binding to the IR13 probe and observed a strong and well-defined 246
MP/IR13 complex (Figure 6C), similar to those obtained with ER7/8 probes. The IR0 247
element, also enriched in MP-bound DAP-seq regions but not in auxin-regulated 248
promoters, gives a weaker smeary band. For auxin repressed genes, two configurations 249
(ER18 and IR3) are more overrepresented in the MP-bound regions from promoters of 250
downregulated genes than for non-regulated genes (Supplemental Figure 5). This might 251
indicate that some ARFbs configurations could be involved in repression by auxin but 252
this attractive hypothesis clearly requires to be tested with additional experiments. 253
DISCUSSION
254
PWM versus consensus for auxin responsive elements
A key question in auxin biology is how the structurally simple molecule evokes such 256
diverse responses. Transcription Factors of the ARF family are the main contributors 257
that diverge auxin response. Predictive tools to infer the presence of ARF binding sites 258
in regulatory regions are essential both for functional and evolutionary analyses. Most 259
studies so far have used TGTC-containing consensus sequences as a tool to detect 260
ARFbs (Berendzen et al., 2012; O’Malley et al., 2016; Zemlyanskaya et al., 2016). Here 261
we built PWM-based models and showed that they provide a greater versatility than 262
consensus sequences as they allow adjusting sensitivity and specificity. Even if a TGTC 263
consensus is perfectly suitable to detect the over-representation of some configurations 264
(such as ER7-8 for ARF2 and MP)(O’Malley et al., 2016) (Supplemental Figure 2), it 265
cannot be used to search regulatory regions because of its lack of specificity when used 266
as monomer and its extremely low sensitivity when used as ER7/8 dimer (Figure 4). 267
We illustrated on a chosen example (the IAA19 promoter) that a site can be bound 268
without a TGTC consensus and not necessarily bound even when the consensus is 269
present (Figure 5). The non-canonical ER8 site we detected was challenged and 270
functionally validated by studies in yeast (Pierre-Jerome et al., 2016). 271
Even if more elaborate models exist (Mathelier and Wasserman, 2013), PWM have 272
emerged as the simplest and most performant models. Still, we were surprised that, in 273
a DAP-seq context where no other parameters (such as cofactors, histones or chromatin 274
accessibility) should influence TF/DNA binding, the PWM models could not reach 275
better AUROC values especially for ARF2. We have tried models that integrate the 276
DNA shape feature (Mathelier and Wasserman, 2013) but they did not significantly 277
improve the prediction power (data not shown). The newly identified sequences with 278
stretches of As and Ts (Figure 3B) were not easy to integrate in improved models but 279
might affect the overall context of ARF2 binding sites and contribute to ARF2 specific 280
regions. This finding is reminiscent of the family of AT-rich motifs found as 281
overrepresented in promoters of auxin responsive genes (Cherenkov et al., 2018). These 282
elements were mostly found in ARF2-binding regions and they were more associated 283
with down-regulation than with up-regulation. More studies are needed to elucidate 284
their role. 285
ARF2 versus MP
ARFs exist as activators and repressors (Dinesh et al., 2016). Affinity measurements 287
on a few DNA sequences in vitro (the molecular caliper model) and consensus-based 288
search in genome-wide binding data both indicate that activator ARF MP and repressor 289
ARF (ARF1 and ARF2) might have different preferences for ARFbs configurations 290
(Boer et al., 2014; O’Malley et al., 2016). But one study examined only a few ER 291
elements (Boer et al., 2014) whereas the other did not recover the long known ER7/8 292
elements and instead proposed IR7/8 (O’Malley et al., 2016). Using PWM-based 293
models and re-analysing DAP-seq data, we confirmed that MP and ARF2 have a similar 294
monomeric binding site but differ in the syntax of binding sites (combinations of 295
binding sites of ARF monomers) they recognize: ARF2 prefers ER7/8 while MP has a 296
much wider range of preferences. For ER motifs (face to face DBDs), our results extend 297
the molecular caliper model (Boer et al., 2014) at the genome-wide level with some 298
larger spacings. Moreover, MP has wider syntax than ARF2 as it also includes enriched 299
DR and IR motifs. Such findings cannot be accommodated with the molecular caliper 300
model as they involve different orientations of the two DBDs than in ER (head to tail 301
for DR and tail to tail for IR). As previously reported (O’Malley et al., 2016), MP shows 302
an increased binding frequency every 10 bp for all DR, ER and IR enriched 303
configurations. Because this spacing corresponds to a DNA helix turn, we can imagine 304
that this configuration allows interaction between ARF proteins on the same side of the 305
DNA. 3D modelling using the published ARF1 structure indicates that these 306
interactions are unlikely to involve the same dimerization surface as for ARF1 (Figure 307
2D). The proximity of some ARF DD domains in 3D, combined with possible 308
flexibility of ARF DBD suggest that these proteins might have evolved different 309
dimerization modes with the same protein domain. Confirming this hypothesis will 310
await their structural characterisation. An alternative hypothesis is that the PB1 311
oligomerization domain contributes to stabilize the MP binding to preferred motifs but 312
this also remains to be tested. However, it should be also noted that a preference for 10-313
bp spaced binding sites does not necessarily implies the presence of protein-protein 314
contacts. Indeed, it has been shown that the binding of a first protein in the DNA major 315
groove favours the binding of a second one at a 10 bp distance through allosteric 316
changes in DNA conformation (Kim et al., 2013). This mechanism could also be at 317
work for ARF DNA binding. 318
It is interesting to note that ER7-8 is bound by both ARF2 and MP whereas some 319
configurations such as DR5 or IR13 are more specific to MP. If repressor ARFs act by 320
competing with activator ARFs for ARFbs (as proposed in Vernoux et al., 2011), this 321
competition will therefore depend on the nature of ARFbs (shared between activators 322
and repressors or specific to only one class of ARFs) . Some sites such as DR5 might 323
be less subjected to competition therefore influencing their activity as reporter for 324
auxin-dependent transcriptional activity (Ulmasov et al., 1997; Liao et al., 2015). 325
Extending this type of analysis to all members of the ARF family should indicate 326
whether ARF from a given class (A, B or C) (Finet et al., 2013) have a stereotypic 327
behaviour or whether there is also a diversity of properties within the class A ARF, for 328
example. Such differences would help explaining how a single auxin signal can trigger 329
different responses depending on the cell type where it is perceived (provided different 330
cell types express different sets of ARF proteins). In vivo, other parameters will also 331
play an important role for the response to auxin such as the ARF interaction partners 332
(Mironova et al., 2017) and chromatin accessibility. 333
ARF binding versus auxin regulation
334
The analysis of auxin-induced genes using PWM models identified only a small over-335
representation of ER8 (Supplemental Figure 4), a motif shared by ARF2 and MP. As 336
we anticipated that ARFbs might be diluted in whole promoter sequences, we collected 337
the set of DNA regions present in promoters from auxin-induced genes that are also 338
bound by MP in DAP-seq and compared it to MP-bound promoter regions from non-339
regulated genes. This analysis confirmed the overrepresentation of ER8 in auxin-340
induced genes but also identified IR13 as enriched motifs (Figure 6). IR13 is a novel 341
element, well bound by MP in vitro that now requires in planta characterization. It is 342
not enriched in ARF2-bound regions suggesting it will likely be insensitive to 343
competition by repressor ARF2. We also characterized auxin repressed gene. Whether 344
repression directly involves ARFs is not known. Promoter analysis did not reveal any 345
motif enrichment but the intersection with MP-bound regions showed ER18 and IR3 346
over-representation (Supplemental Figure 5). Again, functional analysis of such motifs 347
in planta will be important in the future. We anticipate that the strategy we designed
348
here (combining DAP-seq data with expression studies) is a very general method to 349
increase the signal/noise ratio in regulatory regions and better detect binding sites 350
involved in regulation. DAP-seq is a powerful technique but it suffers from giving 351
access to DNA that might never be accessible in the cell. The combination with 352
differential expression studies (+/- a stimulation or +/- a TF activity) will be a powerful 353
way to narrow down the number of regions examined and extract functional regulatory 354 information. 355 METHODS 356 Bio-informatic analyses 357
The TAIR10 version of Arabidopsis genome was used throughout the analyses. The 358
DAP-seq peaks were downloaded from http://neomorph.salk.edu/PlantCistromeDB. 359
We sorted the peaks (200 bp) extracted from narrowPeaks file accordingly to their Q-360
value. An ARF2-bound region was considered to overlap with an MP-bound region if 361
the overlap exceeded 100 bp. We used the Bedtools suite to assess the overlaps and 362
retrieve genome sequences. The PWM were generated using MEME Suite 4.12.0 363
(Bailey et al., 2009) on the 600 top peaks of ARF2 and MP according to the Q-value. 364
ROC-AUC analysis: performing a ROC analysis requires a background set of unbound 365
genomic regions. This set was built with a Python script that takes a bed file of bound 366
genomic regions as input and randomly selects in the Arabidopsis genome regions of 367
same size, similar GC content and with similar origin (intron, exon or intergenic). 368
To search for dependencies between positions of the ARF PWM, we used the sequence 369
alignment inferred by MEME Suite (Bailey et al., 2009) to build a PWM and used it as 370
input for Enologos selecting the option “mutual info” (Workman et al., 2005). 371
Analysis of ARFbs configurations 372
The absolute enrichment (A) for each type of configuration (DR, ER, IR) was calculated 373
as the ratio between the total number of sites in each configuration C in the bound set 374
of regions divided by the same number in the background set. Such calculations were 375
done for different score thresholds and normalized by the ratio between the total number 376
of monomeric sites (BS, with no threshold applied) in the foreground and in the 377
background to account for the different sequence sizes of the two sets. Smax stands for the
378
maximum spacing. 379
𝐴"#$%,'%,(% = ∑ 𝐶-./0 1234 -#5 ∑1234𝐶-678 -#5 ∙ ∑ 𝐵𝑆<=> ∑ 𝐵𝑆?@A 380
For the normalized enrichment, we inventoried all the dimer configurations made of 381
two monomeric ARFbs with scores above the chosen threshold. We then calculated the 382
frequency (f) of each particular conformation (DRn, ERn or IRn with 0≤n≤Smax) among
383
all dimeric sites in the positive set of bound regions and in the background set. 384 𝑓-,"#$%,'%,(% = 𝐶 -∑1234C#5 𝐶C "#$%,'%,(% 385
The normalized enrichment (N) shown in figure 2 corresponds to the ratio between 386
frequencies in the positive set and in the negative set for a given spacing. 387 𝑁-,"#$%,'%,(% = 𝑓-,E./0 𝑓-,E678 388
To illustrate the enrichment of a few chosen motifs (DR4-15, ER7-8, IR0-13), we 389
identified all sequences displaying a potential binding site with a score higher than a -390
8 threshold. Next, we plotted the % of regions displaying a given motif in the Venn 391
diagram regions. The same was done for AT-rich motifs with a score threshold for each 392
AT-rich PWM of a score -10. 393
The ER7/ER8 PWM for ARF2 was built from the ARF2 monomer PWM. Both ARF2 394
bound and unbound sets of regions were scanned with these two PWM and the best 395
score given to each region by either ER7 or ER8 was used to plot the ROC curve. For 396
the analysis of specificity and sensitivity of TGTC-containing consensus sequences, we 397
analysed each region for the presence or absence of ER7 or ER8 consensus (TGTCNN-398
7/8N-NNGACA, TGTCGG-7/8N-CCGACA, TGTCTC-7/8N-GAGACA). A region 399
was scored positive when containing at least one site. 400
For the analysis of auxin regulated promoters, we used 1500 bp upstream of the first 401
exon of each gene. All DAP-seq regions overlapping with the promoters were then 402
selected for analyses. 403
The major scripts used are available on github: https://github.com/Bioinfo-LPCV-RDF. 404
The frequency matrices used to infer PWM can be downloaded on 405
https://github.com/Bioinfo-LPCV-RDF/Scores. 406
407
Selection of auxin regulated genes 408
We selected auxin regulated genes over twenty-two publicly available gene expression 409
profiling datasets from the GEO database (Supplemental File 1). The datasets were 410
generated on seedlings or roots of A. thaliana with different auxin concentrations and 411
times of exposure to auxin (explored in Zemlyanskaya et al., 2016). Differentially 412
expressed genes were defined as those expressed at least 1.5 times higher (lower) after 413
auxin treatment comparing to control, with FDR adjusted p-value < 0.05 (Welch t-test 414
with Benjamini-Hochberg correction). We compiled four groups of auxin-regulated 415
genes: induced or repressed genes with high or very high confidence (Supplemental 416
File 1). High confidence genes: 741 auxin up-regulated and 515 down-regulated genes 417
significantly (more than 1.5-fold, FDR adjusted p < 0.05) changed their expression after 418
auxin treatment in two or more datasets. Very high confidence genes: 153 auxin up-419
regulated and 36 down-regulated genes significantly changed their expression in four 420
or more datasets. 421
422
Expression and purification of recombinant proteins 423
ARF2 and ARF5 coding sequences were cloned into pHMGWA vectors (Addgene) 424
containing N-terminal His-MBP-His tags. His-MBP-His-tagged ARF proteins were 425
expressed in E. coli Rosetta2 strain. Bacteria cultures were grown in liquid LB medium 426
to an O.D600 nm of 0.6-0.9. Protein expression was induced with isopropyl-β-D-1-427
thyogalactopiranoside (IPTG) at a final concentration of 400 µM. Protein production 428
was done overnight at 18 ºC. Bacteria cultures were centrifuged and the resulting pellets 429
were resuspended in Lysis buffer (Tris-HCl 20 mM pH 8; NaCl 500 mM; Tris(2-430
carboxyethyl) phosphine (TCEP) 1 mM for ARF2 and Tris-HCl 20 mM pH 8; NaCl 431
500 mM; EDTA 0.5 mM; PMSF 0.5 mM; TCEP 1 mM; Triton 0.2 % (w/v) for ARF5) 432
with EDTA-free antiprotease (Roche) for sonication. Proteins were separated from the 433
soluble fraction on Ni-sepharose columns (GE Healthcare) previously equilibrated with 434
the corresponding Lysis buffer. Elutions were done with Imidazole 300 mM diluted in 435
the corresponding Lysis buffer. 436
437
Electrophoretic Mobility Shift Assays (EMSAs) 438
DNA-protein interactions were characterized by EMSAs. ER8 binding site was isolated 439
from Arabidopsis IAA19 promoter and ER8 variant sequences are given in 440
Supplemental Table 1. IR0 and IR13 sequences were artificially designed with 441
TGTCGG consensus sites (Supplemental Table 1). EMSA DNA probes were prepared 442
from lyophilized oligonucleotides corresponding to the sense and antisense strands 443
(Eurofins). Oligonucleotides for the sense strand presented an overhanging G in 5’ for 444
DNA labelling. Sense and antisense oligonucleotides were annealed in Tris-HCl 50 445
mM; NaCl 150 mM. The annealing step was performed at 98 °C for 5 minutes, followed 446
by progressive cooling overnight. Annealed oligonucleotides, at a final concentration 447
of 200 nM, were incubated at 37 °C for 1 hour with Cy5-dCTP (0.4 μM) and Klenow 448
enzyme in NEB2 buffer (New England Biolabs). The enzyme was inactivated by a 10-449
minutes incubation at 65 °C. Oligonucleotides were conserved at 4 °C in darkness. 450
EMSAs were performed on agarose 2 % (w/v) native gels prepared with Tris-Borate, 451
EDTA (TBE) buffer 0.5 X. Gels were pre-run in TBE buffer 0.5 X at 90 V for 90 452
minutes at 4 °C. Protein-DNA mixes nonspecific unlabelled DNA competitor (salmon 453
and herring genomic DNA, Roche Applied Science; final concentration 0.045 mg/ml) 454
and labelled DNA (final concentration 20 nM) in the interaction buffer 25 mM HEPES 455
pH 7.4; 1 mM EDTA; 2 mM MgCl2; 100 mM KCl; 10% glycerol (v/v); 1 mM DTT; 456
0.5 mM PMSF; 0.1% (w/v) Triton. Mixes were incubated in darkness for 1 hour at 4°C 457
and next loaded in the gels. Gels were run for 1 hour at 90 V at 4 °C in TBE 0.5 X 458
DNA-protein and bindings were visualized on the gels with Cy5-exposition filter 459
(Biorad ChemiDoc MP Imaging System). 460
AUTHOR CONTRIBUTION
461
FP and RD designed and supervised the project, AS, JL, AB and VM performed the 462
bioinformatic analyses, RMA and TVP performed the biochemical experiments, all 463
authors discussed the results, FP wrote the manuscript with the help of AS, RD, TV, 464
RMA and VM. 465
ACKNOWLEDGEMENTS
We thank Anthony Mathelier for discussions, Line Andresen and Chloe Zubieta for 467
critical reading of the manuscript and David Mast and Laura Grégoire for implication 468
in early stage of this work. 469
FUNDING
470
This work was supported by the Agence Nationale de la Recherche [ANR-12-BSV6- 471
0005 Auxiflo to RD, TV, FP], a PhD fellowships from the University Grenoble Alpes 472
[RAM], the Grenoble Alliance for Cell and Structural Biology [ANR-10-LABX-49-01 473
to FP, RD, AS], Russian State Budget [0324-2018-0019 to VM] and Russian 474
Foundation for Basic Research [18-04-01130 to VM] 475
CONFLICT OF INTEREST
476
We declare no conflict of interest 477
478
REFERENCES
479
Bailey, T. L., Boden, M., Buske, F. A., Frith, M., Grant, C. E., Clementi, L., Ren, 480
J., Li, W. W., and Noble, W. S. (2009). MEME SUITE: tools for motif 481
discovery and searching. Nucleic Acids Res. 37:W202-8. 482
Berendzen, K. W., Weiste, C., Wanke, D., Kilian, J., Harter, K., and Dröge-483
Laser, W. (2012). Bioinformatic cis-element analyses performed in Arabidopsis 484
and rice disclose bZIP- and MYB-related binding sites as potential AuxRE-485
coupling elements in auxin-mediated transcription. BMC Plant Biol. 12:125. 486
Berg, O. G., and von Hippel, P. H. (1987). Selection of DNA binding sites by 487
regulatory proteins. Statistical-mechanical theory and application to operators 488
and promoters. J. Mol. Biol. 193:723–50. 489
Boer, D. R., Freire-Rios, A., van den Berg, W. a M., Saaki, T., Manfield, I. W., 490
Kepinski, S., López-Vidrieo, I., Franco-Zorrilla, J. M., de Vries, S. C., 491
Solano, R., et al. (2014). Structural basis for DNA binding specificity by the 492
auxin-dependent ARF transcription factors. Cell 156:577–589. 493
Bulyk, M. L. (2002). Nucleotides of transcription factor binding sites exert 494
interdependent effects on the binding affinities of transcription factors. Nucleic 495
Acids Res. 30:1255–1261.
496
Cherenkov, P., Novikova, D., Omelyanchuk, N., Levitsky, V., Grosse, I., Weijers, 497
D., and Mironova, V. (2018). Diversity of cis-regulatory elements associated 498
with auxin response in Arabidopsis thaliana. J. Exp. Bot. 69:329–339. 499
Dinesh, D. C., Villalobos, L. I. A. C., and Abel, S. (2016). Structural Biology of 500
Nuclear Auxin Action. Trends Plant Sci. 21:302–316. 501
Finet, C., Berne-Dedieu, A., Scutt, C. P., and Marlétaz, F. (2013). Evolution of the 502
ARF Gene Family in Land Plants: Old Domains, New Tricks. Mol. Biol. Evol. 503
30:45–56. 504
Franco-Zorrilla, J. M., López-Vidriero, I., Carrasco, J. L., Godoy, M., Vera, P., 505
and Solano, R. (2014). DNA-binding specificities of plant transcription factors 506
and their potential to define target genes. Proc. Natl. Acad. Sci. U. S. A. 507
111:2367–2372. 508
Guilfoyle, T., Hagen, G., Ulmasov, T., and Murfett, J. (1998). How does auxin turn 509
on genes? Plant Physiol. 118:341–347. 510
Han, M., Park, Y., Kim, I., Kim, E. H., Yu, T. K., Rhee, S., and Suh, J. Y. (2014). 511
Structural basis for the auxin-induced transcriptional regulation by Aux/IAA17. 512
Proc. Natl. Acad. Sci. U. S. A. 111:18613–18618.
513
Hanley, J. A., and McNeil, B. J. (1982). Maximum attainable discrimination and the 514
utilization of radiologic examinations. J. Chronic Dis. 35:601–611. 515
Keilwagen, J., Grau, J., Paponov, I. A., Posch, S., Strickert, M., and Grosse, I. 516
(2011). De-novo discovery of differentially abundant transcription factor binding 517
sites including their positional preference. PLoS Comput. Biol. 7. 518
Kim, S., Brostromer, E., Xing, D., Jin, J., Chong, S., Ge, H., Wang, S., Gu, C., 519
Yang, L., Gao, Y. Q., et al. (2013). Probing Allostery Through DNA. Science 520
(80-. ). 339:816–819.
521
Korasick, D. A., Westfall, C. S., Lee, S. G., Nanao, M. H., Dumas, R., Hagen, G., 522
Guilfoyle, T. J., Jez, J. M., and Strader, L. C. (2014). Molecular basis for 523
AUXIN RESPONSE FACTOR protein interaction and the control of auxin 524
response repression. Proc. Natl. Acad. Sci. U. S. A. 111:5427–5432. 525
Korasick, D. A., Chatterjee, S., Tonelli, M., Dashti, H., Lee, S. G., Westfall, C. S., 526
Fulton, D. B., Andreotti, A. H., Amarasinghe, G. K., Strader, L. C., et al. 527
(2015). Defining a two-pronged structural model for PB1 domain interaction in 528
plant auxin responses. J. Biol. Chem. 290:12868–12878. 529
Lavy, M., and Estelle, M. (2016). Mechanisms of auxin signaling. Development 530
143:3226–3229. 531
Leyser, O. (2018). Auxin Signaling. Plant Physiol. 176:465–479. 532
Liao, C.-Y., Smet, W., Brunoud, G., Yoshida, S., Vernoux, T., and Weijers, D. 533
(2015). Reporters for sensitive and quantitative measurement of auxin response. 534
Nat. Methods 12:207–210.
535
Mathelier, A., and Wasserman, W. W. (2013). The next generation of transcription 536
factor binding site prediction. PLoS Comput Biol 9:e1003214. 537
Medina-Rivera, A., Defrance, M., Sand, O., Herrmann, C., Castro-Mondragon, 538
J. A., Delerce, J., Jaeger, S., Blanchet, C., Vincens, P., Caron, C., et al. 539
(2015). RSAT 2015: Regulatory Sequence Analysis Tools. Nucleic Acids Res. 540
43:W50–W56. 541
Mironova, V. V., Omelyanchuk, N. A., Wiebe, D. S., and Levitsky, V. G. (2014). 542
Computational analysis of auxin responsive elements in the Arabidopsis thaliana 543
L. genome. BMC Genomics 15:S4. 544
Mironova, V., Teale, W., Shahriari, M., Dawson, J., and Palme, K. (2017). The 545
Systems Biology of Auxin in Developing Embryos. Trends Plant Sci. 22:225– 546
235. 547
Moyroud, E., Minguet, E. G., Ott, F., Yant, L., Posé, D., Monniaux, M., Blanchet, 548
S., Bastien, O., Thévenon, E., Weigel, D., et al. (2011). Prediction of regulatory 549
interactions from genome sequences using a biophysical model for the 550
Arabidopsis LEAFY transcription factor. Plant Cell 23:1293–306. 551
Nanao, M. H., Vinos-Poyo, T., Brunoud, G., Thévenon, E., Mazzoleni, M., Mast, 552
D., Lainé, S., Wang, S., Hagen, G., Li, H., et al. (2014). Structural basis for 553
oligomerization of auxin transcriptional regulators. Nat. Commun. 5:3617. 554
O’Malley, R., Huang, S., Song, L., and Lewsey, M. (2016). Cistrome and 555
epicistrome features shape the regulatory DNA landscape. Cell 165. 556
Oh, E., Zhu, J. Y., Bai, M. Y., Arenhart, R. A., Sun, Y., and Wang, Z. Y. (2014). 557
Cell elongation is regulated through a central circuit of interacting transcription 558
factors in the Arabidopsis hypocotyl. Elife Advance Access published 2014, 559
doi:10.7554/eLife.03031. 560
Parcy, F., Vernoux, T., and Dumas, R. (2016). A Glimpse beyond Structures in 561
Auxin-Dependent Transcription. Trends Plant Sci. 21:574–583. 562
Pierre-Jerome, E., Moss, B. L., Lanctot, A., Hageman, A., and Nemhauser, J. L. 563
(2016). Functional analysis of molecular interactions in synthetic auxin response 564
circuits. Proc. Natl. Acad. Sci. U. S. A. 113:11354–11359. 565
Sayou, C., Nanao, M. H., Jamin, M., Posé, D., Thévenon, E., Grégoire, L., 566
Tichtinsky, G., Denay, G., Ott, F., Peirats Llobet, M., et al. (2016). A SAM 567
oligomerization domain shapes the genomic binding landscape of the LEAFY 568
transcription factor. Nat. Commun. 7:11222. 569
Simonini, S., Bencivenga, S., Trick, M., and Østergaard, L. (2017). Auxin-Induced 570
Modulation of ETTIN Activity Orchestrates Gene Expression in Arabidopsis. 571
Plant Cell 29:1864–1882.
572
Ulmasov, T., Liu, Z. B., Hagen, G., and Guilfoyle, T. J. (1995). Composite 573
structure of auxin response elements. Plant Cell 7:1611–1623. 574
Ulmasov, T., Murfett, J., Hagen, G., and Guilfoyle, T. J. (1997). Aux/IAA proteins 575
repress expression of reporter genes containing natural and highly active 576
synthetic auxin response elements. Plant Cell 9:1963–71. 577
Vernoux, T., Brunoud, G., Farcot, E., Morin, V., Van den Daele, H., Legrand, J., 578
Oliva, M., Das, P., Larrieu, A., Wells, D., et al. (2014). The auxin signalling 579
network translates dynamic input into robust patterning at the shoot apex. Mol. 580
Syst. Biol. 7:508.
581
Wasserman, W. W., and Sandelin, A. (2004). Applied bioinformatics for the 582
identification of regulatory elements. Nat. Rev. Genet. 5:276–287. 583
Weijers, D., and Wagner, D. (2016). Transcriptional Responses to the Auxin 584
Hormone. Annu. Rev. Plant Biol. 67:539–574. 585
Workman, C. T., Yin, Y., Corcoran, D. L., Ideker, T., Stormo, G. D., and Benos, 586
P. V (2005). enoLOGOS: a versatile web tool for energy normalized sequence 587
logos. Nucleic Acids Res. 33:W389-92. 588
Zemlyanskaya, E. V., Wiebe, D. S., Omelyanchuk, N. A., Levitsky, V. G., and 589
Mironova, V. V. (2016). Meta-analysis of transcriptome data identified 590
TGTCNN motif variants associated with the response to plant hormone auxin in 591
Arabidopsis thaliana L. J. Bioinform. Comput. Biol. 14:1641009. 592
Zhao, Y., Ruan, S., Pandey, M., and Stormo, G. D. (2012). Improved Models for 593
Transcription Factor Binding Site Identification Using Nonindependent 594
Interactions. Genetics 191:781–790. 595
596
TABLE AND FIGURES LEGENDS
597
598 599
Figure 1: (A) Venn diagram of regions bound by ARF2 or MP in DAP-seq. (B) ROC
600
curves and AUC values for MP and ARF2 PWM models. (C) Logo for MP and ARF2 601 PWM. 602 603 ARF2 MP
MP
ARF2
A
B
C
Fraction of unbound sequences
F ra ct io n o f b ou nd s eq ue nc es AUC ARF2 = 0.696 AUC MP = 0.846 0.0 0.2 0.4 0.6 0.8 1.0 0.0 0.2 0.4 0.6 0.8 1.0 0 1 2 GA CT G C A
T
GT
G
T
TC
G
T
CT AG
CGT A bits 1 2 3 4 5 6 7 8 9 10 A G CT G C ATGT
G
CT
C
T
CT
G
C
G
T A C C GA T 0 1 2 bits 1 2 3 4 5 6 7 8 9 10604
Figure 2: ARFbs configurations enrichment. (A) Definition of ERn, DRn and IRn.
605
(B-C) Over-representation of dimeric ARFbs configurations in DAP-seq regions 606
compared to an unbound set of sequences generated for ARF2 (B) and MP (C). The left 607
panels quantify the absolute enrichment for all ERn, DRn and IRn (0≤n≤30) as 608
compared to the background set. Right panels present the normalized enrichment for 609
each ERn, DRn and IRn (see Methods). (D) Structural modelling of DR5 and IR13 610
ARF complexes based on ER7 ARF1 structure (PDB entry 4LDX) (Boer et al., 2014). 611
Note the dimerization interface present on ER7 is absent in the two other 612
configurations. 613
615
616
Figure 3: (A) Venn diagrams coloured according to the frequency (in %) of a few
617
ARFbs conformations in MP-specific, ARF2-specific and MP/ARF2 common regions. 618
(B) Fraction of regions containing at least one AT rich motif in MP-specific, ARF2-619
specific and MP/ARF2 common regions. 620 621 4 6 8 10 12 14 16 IR0 IR13 ARF2 MP ARF2 MP ER8 ER7 ARF2 MP ARF2 MP DR5 DR15 A B ARF2 MP 0.8 1.2 1.6 2.0 2.4 2.8 3.2 CGA T 2 C GT A 3 C G A
T
4 C GAT
5 G C AT
6 G C AT
GCTA
7 8 G C TA
9 C G TA
10 G CTA
11 G C AT
12CGTA
13 C GAT
14 C G AT
15 C G AT
CGAT
CGTA
CGAT
C GAT
GCAT
T
AGCCGAT
CGA T G C A T 1 16 1718192021222324 2 1 0 bits 2622
Figure 4: Comparison between PWM and consensus sensitivity and specificity. For all
623
graphs, red dots correspond to score thresholds used to plot the PWM ROC curves. For 624
consensus search, a sequence is considered positive for TGTC, TGTCGG or TGTCTC 625
if this sequence is present at least once in the DNA region. The ER7-8 models were 626
built as described in methods (A) ARF2 PWM and consensus on ARF2 bound regions. 627
(B) MP PWM and consensus on MP bound regions. (C) ER7-8 PWM and consensus 628
models on ARF2 bound regions. 629 -7 -5 -3 -1 S en si tiv ity ( fr ac tio n o f b ou nd s eq ue nc e) 0.0 0.2 0.4 0.6 0.8 1.0
1 - Specificity (fraction of unbound sequence)
0.0 0.2 0.4 0.6 0.8 1.0 B MP AUC = 0.846 TGTCTC monomer TGTCnn monomer
matrix monomer (ROC) TGTCGG monomer
1 - Specificity (fraction of unbound sequence)
S en si tiv ity ( fr ac tio n o f b ou nd s eq ue nc e) 0.0 0.2 0.4 0.6 0.8 1.0 0.2 0.4 0.6 0.8 1.0 0.000 0.002 0.004 0.00 0.02 0.04 0.06 0.08 0.10 0.12 -5 -10 C ARF2 AUC = 0.745 -15 -20 -25 0.0 -10 TGTCTC ER7-ER8 TGTCnn ER7-ER8
matrix ER7-ER8 (ROC) TGTCGG ER7-ER8 S en si tiv ity ( fr ac tio n o f b ou nd s eq ue nc e) 0.0 0.2 0.4 0.6 0.8 1.0
1 - Specificity (fraction of unbound sequence)
0.0 0.2 0.4 0.6 0.8 1.0 -7 -5 -3 -1 A ARF2 AUC = 0.696 TGTCTC monomer TGTCnn monomer
matrix monomer (ROC) TGTCGG monomer
630
Figure 5: (A) Arabidopsis IAA19 promoter with position, sequence and scores of
631
ARFbs. (B) ER8 and its variants used in EMSA. (C) EMSA using ARF2 and MP 632
proteins on probes described in B and two mutant probe controls with one (mC) or two 633
mC/mNC sides of the ER8 mutated. ARF2 and MP are used at increasing 634
concentrations: 0, 125, 250 and 500 nM. Colour shading indicates difference from 635
consensus. 636
637
Figure 6: Spacing enrichment in promoter regions bound by MP were analysed in auxin
638
up-regulated very high-confidence (A) or high-confidence genes (B) (red colours) and 639
non-auxin-regulated genes (B) (blue colours) at two different score thresholds. The 640
enrichment of ER7/8 and IR13 is increased for genes of the very high confidence auxin 641
upregulated gene list. (C) EMSA showing the binding of MP to IR0 and IR13 motifs 642
and the corresponding control mutant probes. MP is used at increasing concentrations: 643
0, 125, 250 and 500 nM. 644
646 647
SUPPLEMENTAL INFORMATION
648
Supplemental Information is available at Molecular Plant Online. 649
Supplemental data
651 652
This file contains
653 654 5 Supplemental figures 655 1 Supplemental table 656 657 658
659
Supplemental Figure 1: (A) 2 Venn diagrams with the 10% top bound regions for
660
ARF2 against all MP regions and the 10% top bound regions for MP against all ARF2 661
regions. This shows that there are regions specifically bound by a single factor even in 662
the highest confidence regions (B-C) ROC curves with ARF2 PWM on MP bound 663
regions and MP PWM on ARF2 regions. AUROC value decrease slightly as compared 664
to Figure 1 (D) Enologos analysis of MP and ARF2 motifs (1). No dependency between 665
nucleotide position is detected. 666
Supplemental Figure 2: (A) Enrichment of spacings between TGTC (B) Spacing
668
enrichment for DRn, ERn and IRn for 0≤n≤50. Threshold indicates the PWM score 669
threshold value used for ARFbs detection 670
671 672
673 674
Supplemental Figure 3: Spacing enrichment in MP-specific, ARF2-specific and
675
MP/ARF2 common regions, compared to unbound sets of sequences. Threshold 676
indicates the PWM score threshold value used for ARFbs detection. Note ER7 is 677
depleted in MP-specific bound regions. 678
679 680
681
682
Supplemental Figure 4: ARFbs over-represented conformations in the promoters of 683
the auxin up-regulated genes (upper panel) or the down-regulated genes (lower panel) 684
We used very high and high confidence genes and compared to auxin insensitive gene 685
promoters. Threshold indicates the PWM score threshold value used for ARFbs 686
detection 687
688
Supplemental Figure 5: Promoter regions bound by MP were analysed in down-689
regulated (red colours) and non-regulated genes (blue colours) in high confidence gene 690
lists (Supplemental file 1). The regions not bound by MP from auxin insensitive 691
promoters were used as background. Threshold indicates the PWM score threshold 692
value used for ARFbs detection 693
694 695 696
697
Supplemental Table 1. Sequences of DNA probes for EMSAs. Bold letters show ARF 698
binding sequence. Lower case letters indicate the nucleotides variation introduced. 699
700
Oligonucleotide DNA sequence (5’->3’)
ER8 C/NC GCAAACTTATGTCTCTCATGTGACCGACCACCGCATC ER8 C/C GCAAACTTATGTCTCTCATGTGACCGACaACCGCATC ER8 WC/WC GCAAACgggTGTCatTCATGTGAatGACaACCGCATC ER8 mC/NC GCAAACTTATGTCTCTCATGTGACCGttCACCGCATC ER8 mC/mNC GCAAACTTATaaCTCTCATGTGACCGttCACCGCATC IR0 GATGCAGTCATGTGCCGACATGTCGGCATGTGCTCACAT
IR0 mut GATGCAGTCATGTGCCGttATaaCGGCATGTGCTCACAT IR13 GATGCAGCCGACAAAACACATGATTTTGTCGGCTCACAT IR13 mut GATGCAGCCGttAAAACACATGATTTTaaCGGCTCACAT 701