HAL Id: cea-01988479
https://hal-cea.archives-ouvertes.fr/cea-01988479
Submitted on 21 Jan 2019
HAL is a multi-disciplinary open access
archive for the deposit and dissemination of
sci-entific research documents, whether they are
pub-lished or not. The documents may come from
teaching and research institutions in France or
abroad, or from public or private research centers.
L’archive ouverte pluridisciplinaire HAL, est
destinée au dépôt et à la diffusion de documents
scientifiques de niveau recherche, publiés ou non,
émanant des établissements d’enseignement et de
recherche français ou étrangers, des laboratoires
publics ou privés.
Bimodal detection of proteins by
129
Xe NMR and
fluorescence spectroscopy
Emilie Mari, Yasmina Bousmah, Céline Boutin, Estelle Léonce, Gaëlle
Milanole, Thierry Brotin, Patrick Berthault, Marie Erard
To cite this version:
Emilie Mari, Yasmina Bousmah, Céline Boutin, Estelle Léonce, Gaëlle Milanole, et al.. Bimodal
de-tection of proteins by
129Xe NMR and fluorescence spectroscopy. ChemBioChem, Wiley-VCH Verlag,
Bimodal detection of proteins by
129
Xe NMR and fluorescence
spectroscopy
Emilie Mari,
[a,b]Yasmina Bousmah,
[b]Céline Boutin,
[a]Estelle Léonce,
[a]Gaelle Milanole,
[c]Thierry
Brotin,
[d]Patrick Berthault,*
[a]and Marie Erard*
[b]Abstract: The full understanding of biological phenomena involves
sensitive and non –invasive detection. Here we report the optimization of a probe for intracellular proteins that combines the advantages of fluorescence and hyperpolarized 129Xe NMR detection. The
fluorescence detection part is composed of six residues containing a tetracysteine tag (-CCXXCC-) genetically incorporated into the protein of interest and of a small organic molecule, CrAsH. CrAsH becomes fluorescent when it binds to the tetracysteine tag. The part of the biosensor that enables 129Xe NMR detection, linked to the CrAsH
moiety by a spacer, is based on a cryptophane core fully suited to reversibly host xenon. We benchmark three different peptides containing the tetracysteine tag and four organic biosensors of different stereochemistry to propose the best couple, fully suited for the in vitro detection of proteins.
Introduction
The study of intracellular biological mechanisms requires sensitive and non-invasive techniques. The combined use of several analytical methods makes it possible to overcome the limitation of each of them. This is the viewpoint of the multimodal approaches, highly developed in recent years, in particular for in vivo molecular imaging.[1] Fluorescence imaging techniques are easy to implement and widely used due to their high sensitivity and excellent spatial and temporal resolution. For the imaging of samples such as tissues or live organisms, the observation depth in fluorescence microscopy is limited by light scattering. This drawback could be overcome by the complementary use of magnetic resonance imaging if the inherent lack of sensitivity of this technique is circumvented for instance by using hyperpolarized 129Xe NMR. We report here the optimization of a synthetic biosensor for a specific protein of interest based on the dual detection by fluorescence imaging and hyperpolarized 129Xe NMR (Figure 1).
Figure 1.Structure of the biosensor. A) Concept of the combined fluorescence and hyperpolarized 129
Xe NMR detection biosensor. B) Structures of the biosensors obtained from CrAsH moieties (ligands) fused to water-soluble hexa-carboxylate cryptophanes (cages) by a spacer: MM-1, MM-2, PP-1 and PP-2.
R = CH2COOH
The fluorescence detection part involves a genetically encoded target peptide fused to the protein of interest which contains a tetracysteine tag (TC-tag: -CCXXCC-). The biosensor ligand moiety, CrAsH, is a biarsenical fluorogenic compounds [2] that is a carboxy derivative of the FlAsH probe, initially developed by Tsien and coworkers.[3] The two pairs of thiol groups present in the target peptide react with the arsenic atoms of the CrAsH ligand to form a covalent bond. The high affinity of CrAsH to the tetracysteine tag of the target peptide leads to the specific detection of the protein of interest.[4] In addition, upon binding, CrAsH switches from a dark to a strongly fluorescent state allowing a very good signal to noise ratio in fluorescence imaging.
[a] Dr. E. Mari, Y. Bousmah, Pr. M. Erard
Laboratoire de Chimie Physique, CNRS, Univ. Paris-Sud, Université Paris-Saclay
Bat 349, 91405, Orsay, France E-mail: marie.erard@u-psud.fr
[b] Dr. E. Mari, Dr. C. Boutin, E. Léonce, Dr. P. Berthault NIMBE, CEA, CNRS
Université de Paris Saclay, CEA Saclay 91191 Gif-sur-Yvette, France E-mail: patrick.berthault@cea.fr
[c] Dr. G. Milanole
SCBM, Université Paris-Saclay, CEA Saclay 91191 Gif-sur-Yvette, France
[d] Dr. T. Brotin
Univ Lyon, Ecole Normale Supérieure de Lyon
CNRS UMR 5182, Université Lyon 1, Laboratoire de Chimie 46 allée d'Italie
The interest of magnetic resonance imaging (MRI) for molecular imaging has experienced a renewed enthusiasm 20 years ago with the development of the first activatable contrast agents that act as biosensors in response to a specific biological activity.[5] However, this technique suffers from poor sensitivity due to the very low population differences between the nuclear spin energy levels at Boltzmann equilibrium. A way to tackle this lack of sensitivity consists in transiently unbalancing the nuclear spin repartition of the energy level populations initially at the Boltzmann distribution, by polarization transfer from a more ordered system such as photons or electrons. Among the species that can be spin-hyperpolarized, xenon is of high interest, due to its exogenous nature leading to the absence of background signal and the fact that it can act as a spy of biological events without interfering on them. Moreover owing to the high deformability of its large electron cloud, xenon is deeply sensitive to its local environment and constitutes a powerful NMR probe for various biological interactions. Soluble in most biological fluids, xenon can cross the plasma membrane in a few tens of milliseconds without losing its hyperpolarization.[6] All these properties led to 129Xe NMR-based biosensors whose concept is based on reversible encapsulation of the noble gas into dedicated molecular hosts that specifically alter the resonance frequency of the xenon nuclei.[7] In our case the host is based on a cryptophane cage and combines 129Xe NMR-based and fluorescence detection (Figure 1A). Other dual fluorescence / Xe NMR probes have been proposed in the literature.[8] Here however the concept is extended to the conception and use of a probe activatable both in fluorescence and 129Xe NMR (i. e. the responses of these modalities change upon binding to the target). With respect to our previous study in ref 9,[9] the reported chemical shift modifications of caged xenon induced by the binding of the probe to the target should be improved further for in cellulo biosensing applications. In this study, a set of four biosensors and three targeted peptide motifs have been investigated in order to optimize the 129Xe NMR response. The most promising couple has then used for the 129Xe NMR detection of purified proteins in vitro. At each step, the response in fluorescence spectroscopy of the best couple has been evaluated.
Results and Discussion
Biosensors are synthesized from the combination of a water-soluble hexacarboxylate cryptophane-222[10] and a CrAsH moiety (Figure 1B). The choice of a hydrophilic cryptophane core avoids aggregation or formation of self-organized systems.[11] Two enantiomers according to the helicity of the linkers between the triveratrylene bowls of the cryptophane (M;M or P;P) have been purified from the initial synthesis.[12] The CrAsH moiety has been obtained after addition of an anhydride (4-carboxyphtalic anhydride) on resorcinol. It leads to an equimolar mixture of two isomers of carboxyfluorescein. Then, the two atoms of arsenic and the ethylene diamine group in the para or meta positions toward the carboxyl function are introduced (Figure 1B).[13] The coupling of both CrAsH isomers to each enantiomer of cryptophane leads to two products labelled 1 or 2 (see supporting information for experimental details and product characterization). MM-1, MM-2 and PP-1 have been isolated for further investigation.
It has been impossible to properly isolate a sufficient amount of PP-2 from PP-1 due to the low yield of the coupling reaction (< 6%). Note that, as no stereogenic center is present on the CrAsH moiety, MM-1 and PP-1 are enantiomers and therefore xenon in their cavities exhibits the same 129Xe NMR spectrum. It is the same for MM-2 and PP-2.
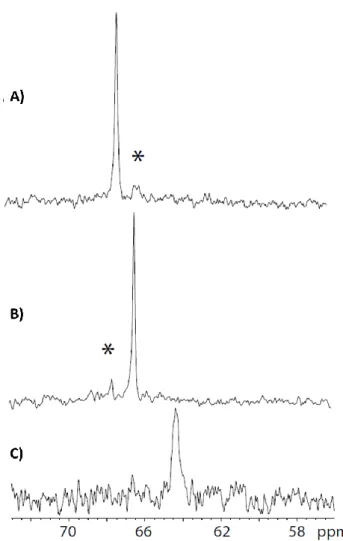
Figure 2.One-scan 129Xe NMR spectra of the biosensors (enlargement of he
high field region). A) MM-1 B) MM-2 and C) hexacarboxylate cryptophane-222. Concentration c.a. 30 µM, pH = 7.4. For A) and B), the asterisk indicates the presence of a residual of the other form. The difference of signal-to-noise ratio of these spectra only reflects variation in xenon polarization.
The aromatic rings of the cryptophanes create a large shielding of the encapsulated Xenon. As a consequence, the expected NMR signals are upfield shifted from the dissolved xenon signal by more than 120 ppm. We observed a clear 129Xe NMR response for the different biosensors MM-1 and MM-2 (Figure 2). This proves that the cavity of the biosensor is able to cage the noble gas. We have also checked by fast repetition of the sequence (soft pulse at the Xe@cryptophane frequency – acquisition) [14] that the xenon exchange in and out of the cavity is not impaired by the spacer nor by the CrAsH moiety. As MM-1 and MM-2 are both products of the same chemical reaction, traces of one isomer are still remaining in the other compound (indicated by an asterisk in Fig. 2). The minor peak in the MM-1 129Xe NMR spectrum corresponds to xenon in MM-2 and vice versa (Figure 2A and B). Both signals are separated by less than 1 ppm (67.1 ppm and
66.3 ppm for MM-1 and MM-2 respectively) showing the high environmental sensitivity of 129Xe NMR. We did not observe the signature of xenon encapsulated in the hexacarboxylate cryptophane at 64 ppm in the 129Xe NMR spectra of MM-1 and MM-2 (Figure 2C): all the biosensors in the solution are thus chemically intact, composed of the cryptophane cage, the spacer and the CrAsH ligand.
The NMR responses of the three biosensors have been evaluated in the presence of three model peptides possessing the tetracysteine motif, -CCXXCC-. The three peptide sequences have been chosen in such a way that the distance between the two pairs of cysteines matches the spacing between the two arsenics. As a consequence, the two dithiol-arsenic interactions are highly cooperative and entropically favorable. The first peptide (P1) has two pairs of cysteines spaced by an arginine and a
glutamic acid (WEAAAREACCRECCARA).[3a] This peptide has been selected for its ability to promote the formation of an α-helix - due to the EAAAR sequence -, the four thiols then forming a parallelogram on one of its faces. The second peptide (P2), has a
proline and a glycine between the two pairs of cysteines (FLNCCPGCCMEP).[15] NMR studies have shown that P
2 adopts
a non-traditional β-hairpin structure in complex with bi-arsenical compounds, strongly different from the α-helix structure of complexed P1.[16] The amino acids before and after the two pairs
of cysteines have shown their influence on the complexation properties.[3b] This led to the study of the third peptide P
3
(AREACCPGCCK), which is an optimized version of P2 fully
adapted for CrAsH.[2]
The chemical shift of caged xenon is strongly modified upon binding of the biosensors to the peptide target (Figure 3). When MM-1 is bound to the three different peptides – the flexible strand
P3 (Figure 3A), the β-hairpin P2 (Figure 3B), or the α-helix peptide
P1 (Figure 3C) – xenon encapsulated in the cryptophane exhibits
different signals. For instance δ = 67.7 ppm for P3 and δ = 74.1
ppm for P1 (Figure 3A, C). For P2 several signals are observed
(Figure 3B). They are shifted in comparison to the signal of the free biosensor (dashed line). This is likely the consequence of multiple grafting configurations of the biosensor on the hairpin. Indeed, even if the caged xenon is distant from the peptide, the structure of the peptide may lead to significantly different xenon chemical shifts. The other enantiomeric form of the hexacarboxylate cryptophane, PP-1, leads to a 129Xe chemical shift of δ= 76.3 ppm when bound to the flexible strand P3 (Figure
3D). Whereas MM-1 and PP-1 are enantiomers, as soon as they are grafted on a peptide, the 129Xe NMR chemical shifts of caged xenon are significantly different (Figure 3A, D). Note that for PP-1 in interaction with P3, as for MM-1 bound to P2, the presence of
another – broader – xenon signal witnesses the multiple grafting configurations of the biosensor. In this case, we have checked by dilution experiments that it could be due to intermolecular grafting (e. g. one biosensor molecule bound to two peptides). The interaction of P1 with MM-2 leads to a xenon resonance frequency
of δ = 84.5 ppm (Figure 3E). The exchange of the grafting position of the spacer on CrAsH from MM-1 to MM-2 results in a large xenon chemical shift splitting of 10.4 ppm (comparison between spectra in Figures 3C and 3E).
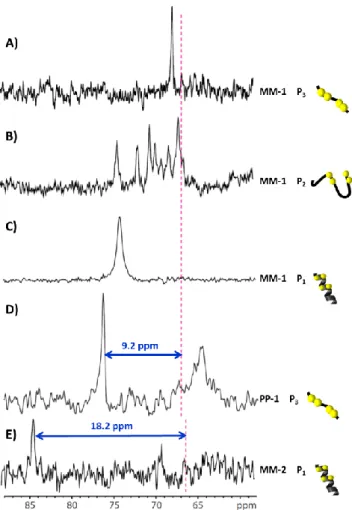
Figure 3. 129Xe NMR spectra of the biosensors bound to the peptides. MM-1
bound to P3 in A), to P2 in B) and to P1 in C),PP-1 bound to P3 in D) and MM-2
bound to P1 in E). The dashed lines represent the chemical shift of the
corresponding free biosensors. Yellow spheres symbolized the cysteine residues. For all spectra, the peptides are in large excess. The difference of signal-to-noise ratio of these spectra only reflects variation in xenon polarization.
Due to the extreme responsiveness of xenon towards perturbation in its environment, every modification of the biosensor structure results in new caged xenon chemical shift. The three biosensors lead to a single 129Xe signal depending on the cryptophane enantiomeric form, the CrAsH ligand grafting position and the peptide conformation. The strongest influence on the xenon magnetic shielding is due to the structure of the cryptophane cage itself. Nevertheless, it is not possible to pinpoint the structural feature of the molecular assembly responsible of the variation of the caged xenon chemical shift itself. The largest chemical shift variations with respect to the free biosensors have been observed for the combination PP-1 / P3 and MM-2 / P1
(9.2 ppm and 18.2 ppm respectively, Figure 3 D, E). Furthermore, the peak at δ = 76.3 ppm for the couple PP-1 / P3 is thinner than
the signal obtained with MM-2 / P1 at δ = 84.5 ppm (FWMH ca. 50
Hz versus 85 Hz, values extracted from a Lorentzian deconvolution). Tsien and coworkers suggest that P1 could adopt
multiple grafting configurations with CrAsH.[3a] This would lead to a different environment for the xenon and a slight broadening of the signal as it is observed for the MM-2 / P1 combination. With
PP-1 / P3, the main peak is likely the result of only one grafting
concentration. As a consequence, we have kept the PP-1 / P3
combination in the next experiments.
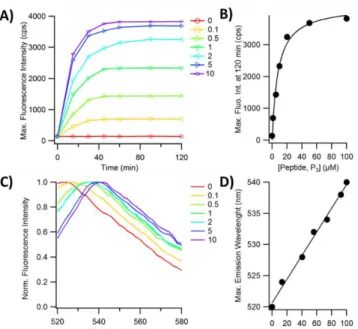
Figure 4. Characterization of the reaction of PP-1 with P3 in fluorescence
spectroscopy. 0 to 10 equivalents of P3 peptide were added to 10 µM PP-1 and
illuminated at 480 nm. A) Maximum of the fluorescence intensity against time, B) Maximum of the fluorescence intensity at 90 min against the concentration ratio peptide/biosensor, C) Evolution of the normalized fluorescence emission spectra monitored between 520 nm and 580 nm at 90 min, D) Evolution of the wavelength of the maximum fluorescence emission with the proportion of bound biosensors. Reaction performed at 37°C.
We have further studied the coupling of PP-1 with P3 by
monitoring the fluorescence properties of the CrAsH moiety in PP-1 upon binding. Its fluorescence increases PP-19 times upon binding to the peptide P3 and reaches its maximum at 10 equivalents
(Figure 4A). This maximum is obtained after 50 minutes of reaction and remains constant beyond. In order to estimate an apparent dissociation constant for the complexation of P3 with
PP-1, we plotted the variations of fluorescence intensity with the amount of peptide. They can be fitted by a saturation binding curve, leading to an apparent dissociation constant Kd of 8 ± 1 µM (Figure 4B). This affinity is lower than the Kd value of ~0.5 µM found for CrAsH with the same peptide in the same experimental conditions.[2] This is due to the presence of the cryptophane cage fused to the ligand moiety. We have further investigated the evolution of the fluorescence emission spectra of PP-1 upon addition of the peptide P3 using normalized spectra.
For ratios 0.1 to 1, the shape of the spectra widens and, in the meantime, the wavelength of the maximal fluorescence shifts to higher wavelengths, from 520 nm to 540 nm depending on the fraction of PP-1 bound to the peptide (Figure 4C). When there is a significant excess of peptide, the fluorescence emission spectrum sharpens again. The shape widens at first most likely due to the simultaneous presence of at least 3 populations, (i) free 1 - whose emission wavelength is centered at 520 nm, (ii) PP-1 / P3 complex whose emission wavelength is centered at 540 nm
and (iii) intermediate structures such as monoarsenical complexes or inter-peptide complexation. The shifts depend on the proportion of PP-1 / P3 complex. As there is only a very little
evolution of the fluorescence signal between 5 and 10 equivalent of P3, we assume that at 10 equivalents of peptide, the PP-1 / P3
complex is most likely present alone in solution, all PP-1 biosensors being bounded to P3. The fluorescence intensity is
very low in absence of peptide and its increase is proportional to the fraction of bound PP-1 when P3 is added (Figure 4A). So, the
fluorescence intensity at the plateau for each ratio allows us to determine the fraction of bound PP-1. The wavelength of the maximum of fluorescence intensity varies linearly with the apparent fraction PP-1 in complex with P3 (Figure 4D). This linear
dependence shows that, in addition to being a fluorescent sensor that can be switched on, the monitoring of the position of the fluorescence spectrum of the biosensor indicates the fraction of bound biosensor. In conclusion, the fluorescence increase upon CrAsH complexation with P3 is significant and easily detectable in
fluorescence spectroscopy.
The ability of the biosensor to detect a protein of interest has been further evaluated with a purified protein genetically fused to P3.
We have chosen the red fluorescent protein, mCherry, as a target. It was modified by fusion of the P3 tetracysteine tag at its
N-terminus with either a 4 or 18 amino-acid linker leading to constructions I and II respectively (Figure 5A). The unmodified form of mCherry was used as a reference. In the presence of an excess of mCherry, the NMR signal of xenon inside PP-1 is not shifted (Figure 5B, C) showing that there is no non-covalent interaction between the biosensor and the fluorescent protein. Upon addition of 2 or 8 equivalents of construction I, the NMR signal is strongly modified. With 2 equivalents, the signal of xenon in the free PP-1 is still present whereas two peaks upfield shifted by 2.5 ppm and 7.5 ppm appear (Figure 5D). With 8 equivalents, the signal of xenon in the free PP-1 disappears completely to the benefit of the two upfield shifted peaks already observed at the lower ratio (Figure 5E). They likely correspond to different xenon environments and thus to two different orientations of the cryptophane cage with respect to the protein. When 8 equivalents of the construction II were added to PP-1, no net 129Xe NMR frequency for caged xenon could be identified (not shown). Nevertheless, we controlled the fluorescence emission of the mixture before the NMR experiment and we checked that the complexation was efficient (see below). The lack of a clear NMR signal is thus most likely due to the very high flexibility of the linker leading to a distribution of relative positions of the cryptophane cage with respect to the protein.
Figure 5.129Xe NMR spectra of he biosensors bound to the protein of interest,
mCherry. A) Scheme of the modified protein. 129Xe NMR spectra of PP-1 (2µM)
in the presence of reducing buffer (B), wi h 8 equivalents of unmodified mCherry (C), with 2 (D) or 8 (E) equivalents of construction I.
Altogether, these observations demonstrate again the very high sensitivity of xenon to its environment, even at such large distances. In addition, the chemical shift variations observed upon reaction of PP-1 with the construction I (2.5 and 7.5 ppm) are smaller than the 9.2 ppm principal value obtained for the same peptide in its free version. This confirms a posteriori the necessity to optimize at first the amplitude of the chemical shifts for biosensor bound to the free peptide alone.
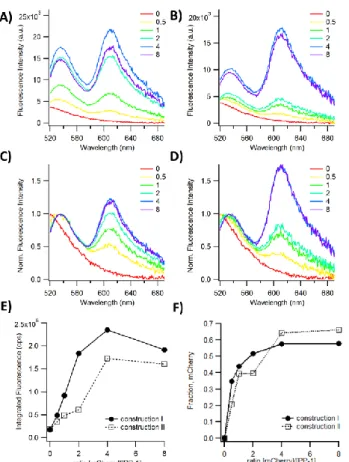
Figure 6.Characterization of the reac ion of construc ions I or II with PP-1 via fluorescence spectroscopy. A representative set of data among 3 independent experiments is presented. 0 to 8 equivalents of construction I (A and C) and II (B and D) were added to 0.5 µM of PP-1 and illuminated at 490 nm. Fluorescence emission spectra were recorded from 520 nm to 700 nm (A and B) and normalized to the amplitude of the fluorescence of the CrAsH band (C and D). (E) Integrated fluorescence of the spectra shown in A and B. (F) The fraction of the integrated fluorescence corresponding to the emission from mCherry itself was calculated for each ratio [mCherry]/[PP-1].
We have investigated by fluorescence spectroscopy the reaction of the constructions I and II with PP-1 (Figure 6). mCherry is a fluorescent protein with an absorption spectrum centered at 587 nm. It is very close to the maximum of fluorescence emission of CrAsH at 540 nm. The spectral overlap and the spatial proximity of both fluorophores upon the coupling of PP-1 to the protein lead to an efficient Förster resonance energy transfer (FRET) from CrAsH to mCherry, CrAsH being the donor and mCherry the acceptor. Upon reaction of both constructions I and II by PP-1, we made several observations (Figure 6A, B). First, the wavelength of the CrAsH band shifts from below 520 nm to 540 nm. Second, the amplitude of the later band increases at 540 nm. Third, we observed the presence of a band at 610 nm corresponding to the stimulated fluorescence of the bound mCherry by FRET. Even if the evolution of these three parameters is slightly different for constructions I and II, it proves the efficient detection of the tetracysteine sequence on both constructions by PP-1.
The total fluorescence that is proportional to the amount of bound biosensor was calculated by integration of the two bands of the fluorescence emission spectra. It increases gradually with the ratio [mCherry]/[PP-1] for both constructions (Figure 6E). The maximum integrated fluorescence is 8-10 times the one of the biosensor alone. Nevertheless, photons are directly emitted from CrAsH or through the FRET by mCherry. This contribution of mCherry to the fluorescence signal is presented Figure 6F. The quantum yield of mCherry is lower than the one of CrAsH (0.22 ;[17] vs ~ 0.8 deduced form [2] respectively). The contribution of mCherry, whose quantum yield is lower, decreases the effective integrated fluorescence detected. We estimated at 5 106 cps the maximum integrated fluorescence without FRET by replacing the contribution of mCherry to the signal (60 % with a quantum yield of 0.22) by an equivalent fraction of CrAsH. This is approximately 20 times the initial fluorescence (Figure 6E) consistently with the 19 times-increase obtained with the peptide alone. The maximum of fluorescence is reached at a lower ratio for construction I than for construction II (ratio of 2 vs. 4) showing a better affinity of the biosensor for the first construct (Figure 6E). The wavelength shift of the CrAsH band with the concentration of mCherry is maximum for a 1:1 ratio for construction I that has the shorter linker whereas it increases stepwise for the construction II (Figure 6C and D). The gradual shift of the emission band of CrAsH upon binding suggest a binding mechanism of the protein to the biosensor likely involving several steps. This could be due to the flexibility of the long linker in construction II that allows conformations in which the TC-tag is not fully involved in a concerted reaction of the two arsenic atoms. In addition the final coupling product of the construction II with PP-1 cannot be detected in 129Xe NMR. Again, the high flexibility of the long linker in construction II could be responsible of this observation. In conclusion, the length of the amino-acid linker that anchors the tetracysteine tag on the protein of interest influences the response in fluorescence spectroscopy as well as in 129Xe NMR. This length need to be optimized. The optimization of amino-acid linkers is a very general concern in the genetically encoded biosensors field. This has already been discussed for other type of biosensors such as the FRET-based biosensors.[18]
Conclusions
Using hyperpolarized 129Xe NMR and fluorescence spectroscopy, we showed the detailed optimization of a bimodal biosensor. Each component influences the efficacy of the detection and has to be chosen carefully from the design of the organic moiety, the structure of the peptide and the length of the peptide between the specific protein of interest and the target peptide. The couple P3 /
PP-1 was the best combination for NMR and fluorescence detection. We also showed that the fusion of P3 to the protein of
interest can be optimized. The quality of the NMR signals was here correlated to an efficient cooperative binding leading to a clear shift of CrAsH fluorescence band to 540 nm. The suitability of this biosensor in live cell imaging could now be evaluated in a next step.
Experimental Section
All chemicals were purchase at Sigma. The peptide P1, P2 and P3 were ordered at BioMat k (Delaware, USA)
All experiments were performed in Phosphate-Buffered Saline (PBS) solution at pH 7.4. It guarantee a stable ionic strength during all the measurements. Coupling experiments were performed in reducing conditions: triscarboxyethylphosphine (TCEP) at 1 mM, β-mercaptoethanol at 1 mM and 10 µM of 1,2-Ethanedithiol (EDT) for 1µM of biosensor. Such strategy prevents non-specific complexation. Monothiols such as 2-mercaptoethanol are helpful to catalyse equilibration but do not compete themselves. EDT is exchanged by the peptide. [3a] In
order to guarantee that the cysteines are in the thiolate form, the pH of the medium should be in the region of 7. Indeed, pKa of thiols in cysteines has been found to be between 7.6 and 9.6. [19] The reducing reactive were first
mixed to the biosensor and then added to the target. For end point experiments, the proteins and the biosensors in the reducing medium are incubated 60 min at 37°C.
Hyperpolarized xenon was produced in the batch mode via SEOP (Spin Exchange Optical Pumping) using a home-built setup [20]. Five minutes
suffice to produce five millilitres of xenon at a polarization ranging from 15 to 25%. Frozen hyperpolarized xenon immersed in a bath of liquid nitrogen and subjected to a magnetic field of 3 kG provided by a solenoid is transported near the NMR magnet. There it is sublimated in the fringe field of the magnet and transferred thanks to a vacuum line to the NMR tube. A hollow spinner enabled us to condense it in the upper part of the NMR tube without cooling the solution.
The hyperpolarized 129Xe NMR experiments were run at 11.7 T and 293 K
using a 5mm-broadband inverse probehead. 129Xe NMR spectra were
recorded at micromolar concentrations of peptides inducing no interaction or ionic strength modification. Actually, it has been proved during our experiments that small modification of salt concentrations -and therefore the ionic strength - can alter significantly the resonance frequency of dissolved xenon. They were all recorded in 64 scans, and the free induction decays were apodized with a Lorentzian broadening of 10 Hz before Fourier transformation. The spectra were cal brated with respect to the peak corresponding to xenon dissolved into PBS referenced at 196 ppm. The spectra can be then compared to each other.
Absorption and fluorescence spectra were recorded with a SynergyH1 plate reader (Biotek, USA) in 96-well plate (clear bottom, black wall). The plate reader is equipped with monochromators and allows the precise tuning of excitation and emission wavelengths. The temperature is fixed at 37°C. For the spectra presented figure 6, the direct contribution of mCherry to the fluorescence was taken in account: spectra of the same mixture but without PP-1 were systematically subtracted (PP-1 was replaced with PBS buffer). Fluorescence spectra of constructions I and II were recorded before the NMR experiments in order to verify that the binding of the biosensor to the protein was effective.
The total fluorescence plotted Figure 6A and B is the sum of the two contr butions of CrAsH and mCherry: 𝐹𝑡𝑜𝑡𝑎𝑙= 𝐹𝐶𝑟𝐴𝑠𝐻+ 𝐹𝑚𝐶ℎ𝑒𝑟𝑟𝑦. The
contr bution, α, of mCherry to the spectra was calculated as: 𝛼 = 𝐹𝑚𝐶ℎ𝑒𝑟𝑟𝑦/𝐹𝑡𝑜𝑡𝑎𝑙, 𝐹𝑡𝑜𝑡𝑎𝑙 being the integrated fluorescence (surface of the
whole spectrum). In order to calculated 𝐹𝑚𝐶ℎ𝑒𝑟𝑟𝑦, we used a fluorescence
spectrum of mCherry whose surface was normalized to 1, 𝐹𝑚𝐶ℎ𝑒𝑟𝑟𝑦𝑁𝑂𝑅𝑀 𝑡𝑜 1 with
𝐹𝑚𝐶ℎ𝑒𝑟𝑟𝑦= 𝑥 × 𝐹𝑚𝐶ℎ𝑒𝑟𝑟𝑦𝑁𝑂𝑅𝑀 𝑡𝑜 1. It was subtracted to 𝐹𝑡𝑜𝑡𝑎𝑙 as following: 𝐹𝐶𝑟𝐴𝑠𝐻=
𝐹𝑡𝑜𝑡𝑎𝑙− 𝑥 × 𝐹𝑚𝐶ℎ𝑒𝑟𝑟𝑦𝑁𝑂𝑅𝑀 𝑡𝑜 1. We optimized the parameter x in order to obtain a
pure spectra for CrAsH centred at 540 nm and with no fluorescence above 665 nm.
The synthesis of the biosensor, the cloning, the expression and the purification of mCherry are detailed in supplementary information. The sequence of the linker in the construction I is –TFGS- and in construction II –TFGSFTDVMSTGTGSTGS-.
Acknowledgements
Emilie Mari’s PhD fellowship was funded by the IDEX Paris Saclay.
Keywords: 129Xe NMR • fluorescence • biosensor • tetracyteine-tag • fluorescent protein • cryptophane
References
[1] a) M. Srinivas, I. Melero, E. Kaempgen, C. G. Figdor, I. J. de Vries,
Contrast Media Mol Imaging 2013, 8, 432-438; b) J. Zhao, J.
Chen, S. Ma, Q. Liu, L. Huang, X. Chen, K. Lou, W. Wang, Acta
Pharm Sin B 2018, 8, 320-338.
[2] H. S. Cao, B. W. Chen, T. C. Squier, M. U. Mayer, Chem Com
2006, 2601-2603.
[3] a) B. A. Griffin, S. R. Adams, R. Y. Tsien, Science 1998, 281, 269-272; b) S. R. Adams, R. E. Campbell, L. A. Gross, B. R. Martin, G. K. Walkup, Y. Yao, J. Llopis, R. Y. Tsien, J Am Chem Soc 2002,
124, 6063-6076.
[4] a) I. Chen, A. Y. Ting, Curr Opin Biotechnol 2005, 16, 35-40; b) A. Pomorski, A. Krezel, ChemBioChem 2011, 12, 1152-1167. [5] a) C. Baudelet, B. Gallez, Magn Reson Med 2002, 48, 980-986; b)
M. Woods, G. E. Kiefer, S. Bott, A. Castillo-Muzquiz, C. Eshelbrenner, L. Michaudet, K. McMillan, S. D. Mudigunda, D. Ogrin, G. Tircso, S. Zhang, P. Zhao, A. D. Sherry, J Am Chem Soc
2004, 126, 9248-9256.
[6] C. Boutin, H. Desvaux, M. Carriere, F. Leteurtre, N. Jamin, Y. Boulard, P. Berthault, NMR in Biomedicine 2011, 24, 1264-1269. [7] E. Mari, P. Berthault, Analyst 2017, 142, 3298-3308.
[8] a) C. Boutin, A. Stopin, F. Lenda, T. Brotin, J. P. Dutasta, N. Jamin, A. Sanson, Y. Boulard, F. Leteurtre, G. Huber, A. Bogaert-Buchmann, N. Tassali, H. Desvaux, M. Carriere, P. Berthault,
Bioorg Med Chem 2011, 19, 4135-4143; b) H. M. Rose, C. Witte,
F. Rossella, S. Klippel, C. Freund, L. Schroder, Proc Natl Acad Sci
U S A 2014, 111, 11697-11702; c) B. A. Riggle, Y. Wang, I. J.
Dmochowski, J Am Chem Soc 2015, 137, 5542-5548; d) C. Witte, V. Martos, H. M. Rose, S. Reinke, S. Klippel, L. Schroeder, C. P. R. Hackenberger, Angewandte Chemie-Int Ed 2015, 54, 2806-2810; e) G. Milanole, B. Gao, A. Paoletti, G. Pieters, C. Dugave, E. Deutsch, S. Rivera, F. Law, J. L. Perfettini, E. Mari, E. Leonce, C. Boutin, P. Berthault, H. Volland, F. Fenaille, T. Brotin, B. Rousseau, Bioorg Med Chem 2017, 25, 6653-6660.
[9] N. Kotera, E. Dubost, G. Milanole, E. Doris, E. Gravel, N. Arhel, T. Brotin, J. P. Dutasta, J. Cochrane, E. Mari, C. Boutin, E. Leonce, P. Berthault, B. Rousseau, Chem Com 2015, 51, 11482-11484. [10] G. Huber, T. Brotin, L. Dubois, H. Desvaux, J. P. Dutasta, P.
Berthault, J Am Chem Soc 2006, 128, 6239-6246.
[11] V. Roy, T. Brotin, J. P. Dutasta, M. H. Charles, T. Delair, F. Mallet, G. Huber, H. Desvaux, Y. Boulard, P. Berthault, Chemphyschem
2007, 8, 2082-2085.
[12] A. Bouchet, T. Brotin, M. Linares, D. Cavagnat, T. Buffeteau, J Org
Chem 2011, 76, 7816-7825.
[13] Y. Ueno, G. S. Jiao, K. Burgess, Synthesis 2004, 2591-2593. [14] P. Berthault, A. Bogaert-Buchmann, H. Desvaux, G. Huber, Y.
Boulard, J Am Chem Soc 2008, 130, 16456.
[15] B. R. Martin, B. N. G. Giepmans, S. R. Adams, R. Y. Tsien, Nat
Biotech 2005, 23, 1308-1314.
[16] F. Madani, J. Lind, P. Damberg, S. R. Adams, R. Y. Tsien, A. O. Graslund, J Am Chem Soc 2009, 131, 4613-+.
[17] N. C. Shaner, R. E. Campbell, P. A. Steinbach, B. N. G. Giepmans, A. E. Palmer, R. Y. Tsien, Nat Biotech 2004, 22, 1567-1572.
[18] T. Thestrup, J. Litzlbauer, I. Bartholomäus, M. Mues, L. Russo, H. Dana, Y. Kovalchuk, Y. Liang, G. Kalamakis, Y. Laukat, S. Becker, G. Witte, A. Geiger, T. Allen, L. C. Rome, T.-W. Chen, D. S. Kim, O. Garaschuk, C. Griesinger, O. Griesbeck, Nat Meth 2014, 11, 175.
[19] A. Pomorski, J. Otlewski, A. Krezel, ChemBioChem 2010, 11, 1214-1218.
[20] C. Chauvin, L. Liagre, C. Boutin, E. Mari, E. Leonce, G. Carret, B. Coltrinari, P. Berthault, Rev Sci Instrum 2016, 87, 4940928.