HAL Id: hal-01282837
https://hal.archives-ouvertes.fr/hal-01282837
Submitted on 15 Jan 2021
HAL is a multi-disciplinary open access
archive for the deposit and dissemination of
sci-entific research documents, whether they are
pub-lished or not. The documents may come from
teaching and research institutions in France or
abroad, or from public or private research centers.
L’archive ouverte pluridisciplinaire HAL, est
destinée au dépôt et à la diffusion de documents
scientifiques de niveau recherche, publiés ou non,
émanant des établissements d’enseignement et de
recherche français ou étrangers, des laboratoires
publics ou privés.
Multipod-like silica/polystyrene clusters
Anthony Désert, Jérémy Morele, Jean-Christophe Taveau, Olivier Lambert,
Muriel Lansalot, Elodie Bourgeat-Lami, Antoine Thill, Olivier Spalla, Luc
Belloni, Serge Ravaine, et al.
To cite this version:
Anthony Désert, Jérémy Morele, Jean-Christophe Taveau, Olivier Lambert, Muriel Lansalot, et
al.. Multipod-like silica/polystyrene clusters. Nanoscale, Royal Society of Chemistry, 2016, 8 (10),
pp.5454-5469. �10.1039/C5NR07613G�. �hal-01282837�
1
Multipod-like silica/polystyrene clusters: new insights in the control and description of their
morphology, and tentative correlation to geometrical models for guiding their synthesis†
Anthony Désert,1,2 Jérémy Morele,1 Jean-Christophe Taveau,2* Olivier Lambert,2 Muriel Lansalot,3 Elodie Bourgeat-Lami,3 Antoine Thill,4* Olivier Spalla,4 Luc Belloni,4 Serge Ravaine5* and Etienne Duguet1*
Received (in XXX, XXX) Xth XXXXXXXXX 20XX, Accepted Xth XXXXXXXXX 20XX
DOI: 10.1039/b000000x
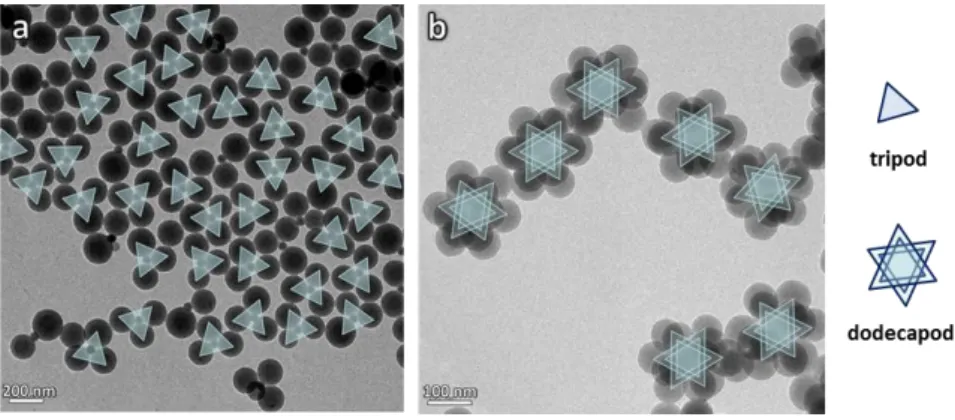
Multipod-like clusters composed of a silica core and PS satellites are prepared according to a seeded-growth emulsion polymerization of styrene in the presence of size-monodispersed silica particles previously surface-modified with methacryloxymethyltriethoxysilane. Tuning the diameter and concentration of the silica seeds achieves homogeneous batches of tetrapods, hexapods, octopods, nonapods and dodecapods with morphology yields as high as 80 %. Three-dimensional
reconstructions by cryo-electron tomography are presented on large fields for the first time and show the high symmetry and regularity of the clusters demonstrating the good control of the synthesis process. These synthesis experiments are visited again digitally, in order to successfully refine an original simulation model and understand better the correlation between the history of the cluster growth and the final composition of the cluster mixture. Finally, using the model as a predictive tool and varying extra experimental conditions, e.g. the composition of the surfactant mixture and the styrene concentration, results in trapping other cluster morphologies, such as tripods.
Introduction
Colloidal clusters made of robust aggregates of a low and controlled number of spherical particles are often called “colloidal molecules”, because they resemble to the space-filling models of conventional simple molecules.1-4 They are of particular interest not only as models to investigate fundamental questions about particle packing, but also as anisotropic building blocks capable to establish directional interactions and therefore to form new supra-particular materials. Among the main routes reported for achieving clusters made of one core and several satellite particles are: (i) clustering of preformed colloids assisted by electrostatic forces,5 coalescence,6 confinement within droplets,7 or chemical linkers,8 (ii) phase separation in seeded-growth emulsion polymerization,9-11 and (iii) controlled surface nucleation and growth in metal epitaxial growth,12,13 or emulsion polymerization as developed by ourselves.14
The ideal synthesis route shall produce large amounts, ²i.e. at least at the gram scale, of identical clusters and should be versatile enough for tuning their morphology.4 In this context, the last route is particularly promising and we recently reported first results on an optimized synthetic method based on the styrene seeded-growth aqueous emulsion polymerization route using a mixture of ionic/non-ionic surfactants (sodium dodecylsulfate SDS and Synperonic® NP30 in the wt. ratio 5/95) and well-calibrated silica seeds.15 By this method, large amounts of regular tetrapods and hexapods made of a central silica core and four or six polystyrene (PS) satellite nodules were prepared with morphology yields over 80 % from 55-nm and 85-nm silica seeds, respectively. The robustness of the process was supported by extensive statistical analyses from large-field transmission electron microscopy images, and also from charge detection mass spectrometry experiments.16 Such tetrapods and hexapods, as-obtained at the gram scale, could advantageously mimic any molecule of types AX4 and AX6 according to the well-known Gillespie formalism,17 such as methane CH4 and sulfur hexafluoride SF6 molecules, respectively.
Nevertheless, important research efforts to demonstrate the dual efficiency/versatility of the process were still required. An in-depth investigation to understand and rationalize the experimental observations on the cluster synthesis was thus undertaken. An early model was developed which relates the size of the silica seeds and the final number of PS nodules.14,15 This approach was quite efficient but needs a calibration factor which is dependent on the experimental conditions of the polymerization recipe. Later this approach was extended by a more general geometrical model, called Thill’s model in the following sections, for which not only the calibration factor is no longer needed, but also the cluster growth scenario may be explicitly simulated for matching the impact of the
2
modification of the polymerization conditions and giving the nature and proportion of the side-products.18
In light of these models and of a great number of new synthesis experiments, the present paper deals with the demonstration of the versatility and limitations of the optimized process. In the first section, some experimental parameters, e.g. the concentration and size of the silica seeds, are investigated again in order to prepare a series from tripods to dodecapods. A special attention was paid to thorough morphology characterization of the as-obtained clusters, using in particular cryo-electron tomography19 on large fields for the very first time. In the second section, these experiments are visited again digitally, i.e. through the comparison of the clusters fractions obtained experimentally and by running Thill’s model, in order to refine the latter and better understand the correlation between the history of the cluster growth and the final composition of the cluster mixture. In the last section, these lessons allow to consider new experimental conditions, e.g. by varying the fraction of SDS in the surfactant mixture and the styrene concentration, for catching other clusters in high yields. This paper claims neither to explain every mechanism detail, nor to describe a universal recipe to synthesize clusters of any morphology. But it aims to help to consider these syntheses from another angle and to identify in a more rational way what are the barriers to break down for the next developments.
Experimental
Synthesis procedures
Materials. Tetraethoxysilane (TEOS, 99 %, Aldrich), L-arginine (98.5 %, Aldrich), ammonium hydroxide (28-30 % in water, J. T.
Baker), absolute ethanol (99.9 %, Scharlau), styrene (S, 99 % purity, inhibited with 4-tert-butylcatechol, Aldrich), methacryloxymethyltriethoxysilane (MMS, 97 %, ABCR), Synperonic® NP30 (Aldrich), sodium dodecylsulfate (SDS, 99 %, Aldrich) and sodium persulfate (99 %, Aldrich) were used without further purification. Ultrapure water (18.2 MOhm.cm at 25°C) was obtained with a Direct-Q3 system (Millipore).
Silica seed synthesis and surface modification. Silica seeds were prepared according to a two-stage recipe previously published.15
“Pre-seeds” were obtained in a first stage where TEOS was slowly hydrolysed at the surface of a L-arginine aqueous solution.20 Typically, 100 mL of L-arginine aqueous solution (6 mM) were added in a 150-mL vial thermostated with hot water circulation at 60°C and equipped with a reflux condenser and a 3-cm Teflon®-coated stirring bar. When the constant temperature of 60°C was attained, a chosen volume of TEOS was gently added in order to create a top organic phase. The stirring rate was adjusted in order to maintain the organic phase undisturbed and the aqueous phase efficiently mixed (~150 rpm). The reaction was stopped 2 h after the organic phase had completely disappeared. Silica concentrations were determined by gravimetric analysis. In a given volume, the number of silica seeds Nsilica was calculated from the silica concentration and the particle average diameter and assuming that the
particles were spherical and their density was 2.2 g.cm-3. Regrowth stages were performed at room temperature in a conventional glass flask where 250 mL of ethanol, 35 mL of ammonium hydroxide and 10 mL of the aqueous dispersion of silica “pre-seeds” were successively introduced. The mixture volume was completed to 500 mL with ethanol. Then, a calculated amount of TEOS was added at the rate of 0.5 mL.h-1. The mixture was stirred till the completion of the TEOS addition. After checking of the seed size and concentration, the reacting mixture was transferred into a three-neck round bottom flask equipped with a reflux condenser and MMS was added at the concentration of 0.5 function.nm-2 of silica (based on the estimate of the silica developed surface area from the average diameter and concentration values). It was let to react for 3 h at room temperature and 1 h at 90°C. The excess ammonium hydroxide was removed from the reacting medium with the help of a rotary evaporator. Then, particles were purified by dialysis against water until neutral pH in order to remove the remaining reactants and replace ethanol with water. The final concentration of silica seeds was determined by measuring the mass of a dried extract. Nine silica batches were prepared with diameter varying from 44 to 146 nm and polydispersity indexes lower than 1.005 (see ESI, Table S1†).
Synthesis of the PS/silica clusters. The seeded-growth emulsion polymerization of styrene was performed in a thermoregulated
reactor under a nitrogen atmosphere, using Synperonic® NP30 and SDS at a total surfactant concentration of 3 g.L-1, sodium persulfate as initiator and MMS-modified silica particles as seeds. Under a constant stirring at 170 rpm, the reactor was successively filled with water, the aqueous dispersion of silica seeds, surfactants, styrene and lastly initiator when the temperature of 70°C was attained. Temperature control and stirring were maintained for 5 h. The monomer-to-polymer conversion, i.e. styrene-to-polystyrene conversion, was determined gravimetrically.
3
Characterization techniques
Electron microscopy experiments and statistical calculations. TEM images were obtained with a FEI CM120 microscope
operating at an accelerating voltage of 120 kV. Typically, the collected samples were diluted 100 times in ethanol and one drop was deposited on a copper grid coated with a carbon membrane. Statistical analyses of the cluster morphology were performed on a minimum of 100 clusters per batch and up to 1000 clusters in the case of the purest batches.
Cryo-electron microscopy (cryo-TEM) and tomography (cryo-ET). A 5-µL sample of the aqueous dispersion of the clusters was
deposited onto a holey carbon coated copper grid. The liquid excess was blotted with a filter paper and the grid was plunged into a liquid ethane bath cooled with liquid nitrogen (Leica EM CPC). Specimens were maintained at a temperature of approximately -170°C, using a cryo holder (Gatan), and were observed under low-dose conditions with a FEI Tecnai F20 electron microscope operating at 200 kV and at a nominal magnification of 14,500 X and 5,000 X for the large fields. Images were recorded with a 2k x 2k low scan CCD camera (Gatan). For cryo-ET, tilt-series were collected automatically from -65º to +65º at 1º intervals along the tilt axis using the UCSF tomography software.21 For image processing, the 2D projection images – binned 2-fold – were aligned with the IMOD software22 package using colloidal gold particles as fiducial markers only for the high magnification image tilt series, and then tomographic reconstructions were calculated by weighted back-projection using Priism package.23 The spherical particles making up the clusters were segmented in the tomograms using a lab-made implementation of the 3D Hough Transform24 as a plugin for ImageJ allowing us to extract the XYZ-coordinates of the center and the radius of each sphere. Then, the result of this segmentation was visually checked and fixed if necessary. In a second step, the morphologies were automatically determined based on the distances between the high-level density of the silica particles and the PS nodules. When the distance was lower than the sum of the two radii, the PS nodule was considered to belong to the cluster. The various skeletons of these morphologies were then converted in a PDB file for the rendering with UCSF Chimera package.25
Results and discussion
First section: general considerations
The process of the seeded-growth emulsion polymerization of styrene in the presence of silica has been already described (Scheme 1).14,15,19,26-29 The surface of the silica seeds must be previously treated by compatibilizers, e.g. methacryloxymethyltriethoxysilane (MMS), in order to create organophilic loci promoting the surface capture of the growing macromolecules and therefore the nucleation/growth of the PS nodules. In particular, MMS has to be grafted with a controlled surface density. A too low density is generally insufficient for making the resulting clusters robust enough and their falling-in is often observed on the TEM grid.27 A too high density makes the silica seed too organophilic, i.e. too easily wetted by the PS nodules, and leads to its progressive and more or less complete embedding in a single nodule (see ESI, Fig. S1†). In the present conditions of polymerization, the MMS surface density appeared to be optimal when the reagent was used at a concentration of 0.5 fct.nm-2. As already reported,15 the as-prepared clusters are robust enough to be manipulated, observed and even concentrated in mild centrifugation conditions. Moreover, as in any batch prepared in this study, few grams of clusters are readily obtained.
4
Scheme 1. Synthesis strategy of PS/silica clusters and chemical formulae of the main reagents.
The silica seed concentration is one of the experimental parameters which may be easily varied (Table 1).26 Fixing the SDS fraction in the surfactant mixture to 5 wt.%, the concentration of styrene to 100 g.L-1 and the amount of initiator to 0.5 wt.% relative to the monomer (Entry #1.2 vs. Entry #1.1), it was first observed that the presence of 85-nm silica seeds led to the formation of smaller and more numerous PS nodules. Increasing the seed concentration made this phenomenon all the more strong (Entries #1.2 to #1.5). It means that many nucleation loci exist on the surface of the silica seeds making the nucleation on the seed surface (called here heterogeneous nucleation) more efficient than in the aqueous phase. Therefore, the increased number of silica seeds leads to smaller PS particles.15 Whatever the seed concentration, hexapods were surprisingly achieved as the main population with a morphology yield between 53 and 83 % with regard to the silica seed number. The highest value corresponded to a silica seed number of 7.3*1015 L-1, i.e. a silica surface area Ssilica of about 166 m2.L-1 (Entry #1.3). This experiment was defined as the reference one (#Ref) throughout the course of the present study. A thorough examination of the side-products obtained in the other experiments showed that, at low seed concentration (Entry #1.2), the number of free PS particles is high. On the contrary, at high seed concentrations (Entries #1.4 and #1.5), the main by-products were “multi-silica” clusters, i.e. larger clusters made of two or three silica cores, which probably resulted from an imperfect initial dispersion of silica seeds or an unwanted inter-cluster coalescence during the polymerization process.
Table 1. Influence of the silica seed concentration on the morphology and geometrical parameters of the PS/silica clusters
(Dsilica = 85 nm; [styrene]0 = 100 g.L -1
; [Na2S2O8]0 = 0.5 g.L -1
; [surfactant] = 3 g.L-1 including 5 wt.% of SDS). Bold numerals concern the main cluster population. In darken cells: comparative results of the simulation experiments according to Thill’s model as discussed in the 2nd section.
Entry #1.1 #1.2 #1.3 (Ref) #1.4 #1.5 Experimental conditions Nsilica (1015 L-1) 0 5.5 7.3 11 15 Ssilica (m2.L-1) 0 125 166 250 340 Conversion (%) 88 93 92 89 89 a - 50 40 24 17.5 Final batch composition in clusters
Exp. vs. simul. Exp.b Exp.b Simul. Exp.b Simul. Exp.b Exp.b
PC 0.8 0.8 PP 1 1 % mono/bipods - - - - - 2 1 % tripods - 2 0.2 - - 9 3 % tetrapods - 4 1.3 3 0.7 11 7 % pentapods - 14 13.9 13 10.1 10 16 % hexapods - 72 84.6 83 86.3 61 53 % heptapods - 1 0 - 2.9 - -% “multi-silica” - 7 - 1 - 7 20 (nm) PDI -163 1.022 170 1.021 152 1.008 158 1.023 151 1.021 143 1.013 Final batch composition in free PS particles amount +++++++ +++ 3.8 % d + 3.3 % d + + (nm) 189 ~163 164 ~147 152 ~146 ~159 c - ~7 7 ~7.5 7 ~5 ~3
Typical TEM image on Fig. 1b/S3†
a
as calculated from Eq. 3 b
as extracted from the statistical analysis of TEM images c
as calculated from Eq. 4 from the experimental results and used in the simulation experiments d
5
We had reported that, for a specific polymerization recipe, the higher the seed size the more numerous the PS nodules found accommodated on its surface.14,15,29 Based on a mathematical model dealing on the minimization of the energy of n points whose positions are unconstrained on the surface of a sphere using a two-term potential energy function,30 we had derived a mathematical formula (Eq. 1) allowing to anticipate the optimal seed diameter Dsilica for targeting a specific number of PS nodules per silica seed
at the end of the polymerization.
(
3 -1
) (1)
The multiplicative K constant had been defined as an adjustable parameter related to the average size of the PS nodules. So, we had succeeded in achieving multipods with of 2, 3, 4, 6, 8 10 and 12 indeed by using a value of K = 16.2 (for DPS of about 200
nm) in the case where only Synperonic® NP30 was used as surfactant and the monomer-to-polymer conversion was kept lower than 30 %.14 By replacing 5 wt.% of Synperonic® NP30 by SDS, we had shown that the monomer-to-polymer conversion was almost complete, with values of about 150 nm, and tetrapods and hexapods were obtained with morphology yield over 80 % from
55-nm and 85-55-nm silica seeds (against 85-55-nm and 127-55-nm seeds previously), respectively.15 These were in agreement with a new value of K = 10.9.
In order to visit again the multipod series with increasing values, batches of silica seeds from 40 to 140 nm with
polydispersity index (PDI) as low as 1.006 were prepared and surface-modified with MMS at the optimal concentration of 0.5 fct.nm-2 (See ESI Table S1†). Emulsion polymerization of styrene was performed in the presence of these seeds and a fraction of 5 wt.% of SDS in the surfactant mixture. The concentration of seeds was systematically fixed at the previous optimal concentration of ca. 170 m2.L-1 in order to perform the polymerization in conditions similar to those of the reference experiment, get PS nodules with comparable final diameters (150 ± 10 nm), and therefore make the K parameter more or less constant. The experimental conditions for their preparation and the description of their composition and main geometrical parameters as extracted from the statistical analysis of TEM images are gathered in Table 2 and representative TEM pictures are displayed on Figure 1. It may be observed that the expected morphologies were obtained, but the statistical analysis showed they were not necessarily the main products. Actually, as expected, tetrapods, hexapods, octopods and nonapods were obtained (Entries #2.2, #2.4, #2.6 and #2.7) indeed as the main cluster population with yields from 54 to 84 %. But when tripods or pentapods were expected (Entries #2.1 and #2.3), tetrapods were obtained with yields of 58 and 47 %, respectively. A similar phenomenon was observed with heptapods (Entry #2.5) and decapods (Entry #2.8) in favour of hexapods (60 %) and dodecapods (49 %), respectively. A rapid survey shows that tetrapods, hexapods, octopods, nonapods and dodecapods were more readily obtained, invalidating partially the mathematical model used for tuning the diameter of the silica seeds (Eq. 1).14,15
6
Table 2. Influence of the diameter of the silica seeds on the morphology and geometrical parameters of the PS/silica clusters
([styrene]0 = 100 g.L-1; [Na2S2O8]0 = 0.5 g.L-1; [surfactant] = 3 g.L-1 including 5 wt.% of SDS). Bold numerals concern the main cluster population. In darken cells: comparative results of the simulation experiments according to Thill’s model as discussed in the 2nd section. Entry #2.1 #2.2 #2.3 #2.4 (Ref) #2.5 #2.6 #2.7 #2.8 Targeted clusters (expected NPS/silica) tri-pods (3) tetra-pods (4) pentapods (5) hexapods (6) heptapods (7) octopods (8) nonapods (9) decapods (10) Experimental conditions Dsilica(nm) a 39 54 69 83 97 112 126 140 Dsilica(nm) 44 55 69 85 96 110 123 146 Nsilica (1015 L-1) 28 18 12 7.3 6.0 4.4 3.7 2.5 Ssilica (m2.L-1) 170 171 179 166 174 167 176 167 Conversion (%) 76 89 92 92 86 89 90 80 b 58 54 42 40 29 e 28 24 e 17 e Final batch composition in clusters
Exp. vs. simul. Exp.c Exp.c Exp.c Exp.c Simul. Exp.c Simul. Exp.c Simul. Exp.c Simul. Exp.c Simul.
Pc 0.8 0.8 0.8 0.8 0.8 PP 1 1 1 1 1 % bipods 12 2 12 - - - - - - - - - -% tripods 25 11/29 21 -/3 0
}
15}
0.5 - - - - - -% tetrapods 58 84/68 47 3/3 0.7 - - - - - 0.1 % pentapods - -/1 5 13/8 10.1 11 4.1 - 1.5 -/2 0.4- - 0.9 % hexapods - -/2 10 83/86 86.3 60 15.2 18 12.7 2/5 4.0 2/4 10.0 % heptapods - - - - 2.9 7 41.0 19 36.6 2/5 21.5 2/4 17.3 % octopods - - - - - - 39.2 54 43.4 14/19 38.9 2 10.9 % nonapods - - - - - --}
6}
5.8 80/60 33.0 7/18 16.0 % decapods - - - - - - - -/2 2.2 22/23 25.0 % hendecapods - - - - - - - - - - - 12/18 0.2 % dodecapods - - - - - - - - - - - 49/32 18.8 % “multi-silica” 5 3 5 1 - 7 - 3 - 2 - 4 (nm) PDI 144 1.029 146 1.012 161 1.057 152 1.008 158 1.023 149 1.015 151 1.018 152 1.007 162 1.055 150 1.002 166 1.065 166 1.006 175 1.041 Final batch composition in free PS particles amount + 3.4% + +2.4% ++ 13% +++ 15% +++ f 6.1% (nm) ~148 ~145 ~146 ~147 152 ~150 148 ~145 151 ~146 155 ~171 166 d - - - ~7.5 7 ~8 8 ~13 13 ~15 15 ~12 12Typical TEM image on Fig. 1a/S † 1b/S3† 1c/S4† 1d/S5†
a
targeted value as calculated from Eq. 1 with K = 10.9
b
as calculated from Eq. 3 c
as extracted from the statistical analysis of TEM images (or cryo-ET 3D-reconstructions of Fig. 1 for underlined fonts, except for the batch #2.8 for which they resulted from two large field 3D-reconstructions whose one is not presented in this paper)
d as calculated from Eq. 4 from the experimental results and used in the simulation experiments e
numerous millimeter-sized polymer particles were also obtained in this batch making very probably overestimated the amount of styrene actually used for producing polystyrene satellites and therefore the value
f 7 % with regard to the total number of PS particle (attached to silica seeds or not) and as extracted from a specific statistical analysis of TEM images
7
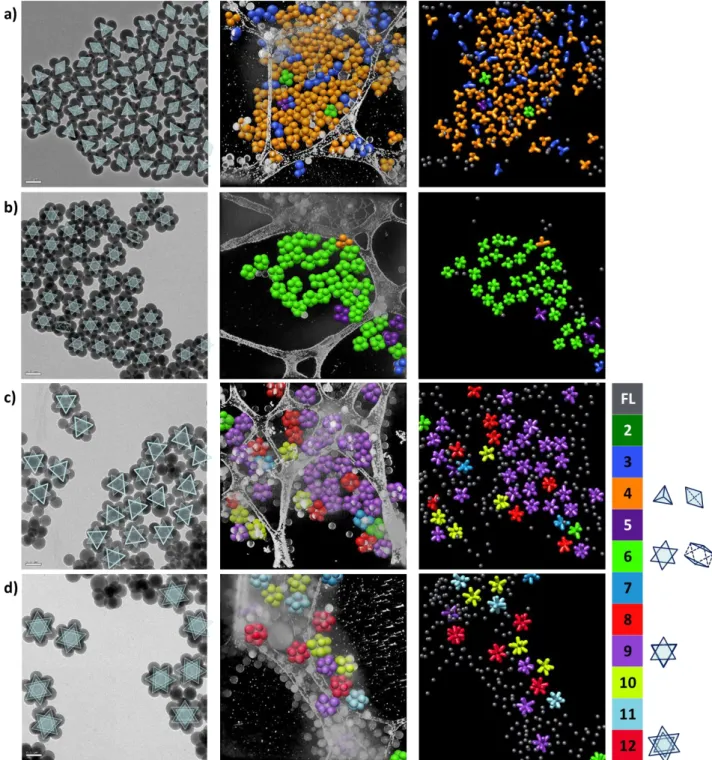
Fig. 1. Typical TEM images and 3D-reconstruction volumes of PS/silica clusters obtained by styrene emulsion polymerization from
silica seeds of different diameters: a) 55 nm (Entry #2.2); b) 85 nm (Entry #2.4); c) 123 nm (Entry #2.7); d) 146 nm (Entry #2.8). Experimental details and statistical analysis of morphologies are presented in Table 2. Left column: TEM images where the undoubtedly identified multipods belonging to the most abundant morphology family are labelled with patterns explained on the right.
Original (unlabelled) TEM images may be examined in ESI, Fig. S † to S5†. Scale bar: 00 nm. Middle column: Isosurfaces of the segmented beads extracted from the tomograms (in light grey) calculated from the cryo-TEM images presented in ESI, Fig. S6†. For
sake of clarity, the free and unresolved morphologies were not displayed. Right column: Skeletons of the corresponding morphologies. Each cluster was colorized according to the number of its pods, according to the colour lookup table on the right. Free
latex particles (FL) were kept in grey colour.
For the very first time, large fields of clusters were reconstructed (Figure 1) showing simultaneously several tens of clusters such as they were in the aqueous dispersion just prior to the freezing stage. Such 3D-images are particularly interesting for determining undoubtedly the exact morphology of every cluster, if those which were found close to the glassy film surface were systematically discarded because they might have experienced partial degradation when the film was suddenly made thinner. Admittedly, extensive
8
statistical analyses (i.e. from a very large population) of the cluster morphology distribution from 3D-reconstructions cannot be made as easily as from conventional TEM images (Table 2). But they present the advantage to give a local photography of an intact volume while the drying process on conventional TEM grids is known to promote surface segregation of objects of different morphologies. The comparison of statistical analyses between conventional TEM grids and 3D-reconstructions is quite consistent with 84% against 68% of tetrapods (Entry #2.2), 83% against 86% of hexapods (Entry #2.4), 80% against 60% of nonapods (Entry #2.7) and 49% against 32% of dodecapods (Entry #2.8).
Figure 2 displays high-resolution 3D-reconstructions of tetrapods, hexapods, nonapods and dodecapods (Entries #2.2, #2.4, #2.7 and #2.8, respectively) obtained by cryo-electron tomography according to an acquisition and processing technique already applied to octopods.19 Provided that the sizes of the PS nodules on a same cluster were quite similar, the morphology of the clusters appears highly symmetrical, deriving from known polyhedra (Table 3). Among them, tetrapods, hexapods and dodecapods derive from regular polyhedra: tetrahedron, octahedron and icosahedron, respectively, if the PS nodules are likened to vertices. They are also known as Platonic solids, which include also the cube (or hexahedron) and the dodecahedron. But only those which were mainly observed here present equidistant vertices making their faces exclusively made of equilateral triangles and giving the most efficient packing of PS nodules around the central silica sphere (cf. the mathematical problem of enemy dictators, or Tammes problem31). The Platonic solid having 8 vertices is the cube, but its faces are made of squares, and a more compact arrangement may be attained from a square antiprism where four square faces are reorganised in eight triangular faces, i.e. a well-known case of symmetry breaking allowing an optimal solution.31 That is why the observed octopods usually derive from square antiprisms.19 Nonapods appear to be more exotic morphologies, which may be described on the basis of a tri-augmented triangular prism (Johnson’s solid J51) which is however deformed by the presence of the silica core making some PS nodules contactless.
Fig. 2. Cryo-EM and cryo-ET images of multipod clusters: a) tetrapods, b) hexapods, c) nonapods, and d) dodecapods (Entries #2.2,
#2.4, #2.7 and #2.8, respectively). Each row presents from left to right a cryo-TEM image of such clusters, two different orientations of the 3D-reconstructed multipod, and its skeleton. In the latter, the vertices correspond to the centers of the PS nodules extracted by
9
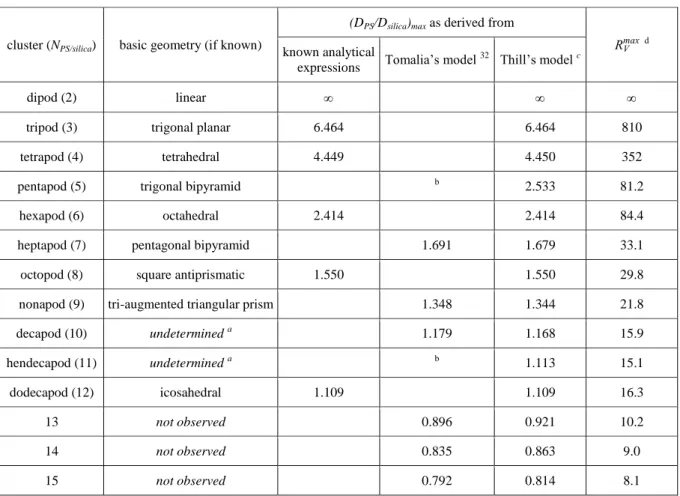
Table 3. Geometrical boundary of simulated and ideal clusters considering that all PS satellite nodules (assessed to be spherical and
of identical diameter) are in contact with the central silica sphere.
cluster (NPS/silica) basic geometry (if known)
(DPS/Dsilica)max as derived from
d
known analytical
expressions Tomalia’s model
32 Thill’s model c
dipod (2) linear
tripod (3) trigonal planar 6.464 6.464 810
tetrapod (4) tetrahedral 4.449 4.450 352
pentapod (5) trigonal bipyramid b 2.533 81.2
hexapod (6) octahedral 2.414 2.414 84.4
heptapod (7) pentagonal bipyramid 1.691 1.679 33.1
octopod (8) square antiprismatic 1.550 1.550 29.8
nonapod (9) tri-augmented triangular prism 1.348 1.344 21.8
decapod (10) undetermined a 1.179 1.168 15.9 hendecapod (11) undetermined a b 1.113 15.1 dodecapod (12) icosahedral 1.109 1.109 16.3 13 not observed 0.896 0.921 10.2 14 not observed 0.835 0.863 9.0 15 not observed 0.792 0.814 8.1 a
we failed to assimilate the morphology of the observed decapods and hendecapods to gyroelongated square bipyramids (Johnson’s solid J17) and elongated pentagonal pyramid (Johnson’s solid J9), respectively
b
no possibility for five satellite nodules to make simultaneously contact to the central sphere if a sixth one cannot be attached. A similar situation is with eleven satellite nodules compared to the case where they are twelve32
c
computed from ( ) 3 using the values obtained from Thill’s model
d
computed from Thill’s model after averaging the values obtained over 100 simulations (PP = 1 and PC = 0) by recording the volume
ratio attained at the time when the first PS nodule is expulsed from the seed surface18
From these first series of experiments, it may be drawn that clusters from tripods to dodecapods can be obtained. Nevertheless, the simple mathematical model used for computing the presumed optimal size of the silica seeds failed in some situations. Some morphologies, i.e. tetrapods, hexapods, octopods, nonapods and dodecapods, appear to be produced more readily. That is why it seemed mandatory to improve the modelling side of this study in order to better understand and therefore control the synthesis of these clusters.
Second section: Development and refinement of the simulation model
As previously shown, using the optimal surface density of MMS onto the silica seeds, i.e. 0.5 fct.nm-2, results in the preferential surface nucleation and growth of a limited number of PS nodules per seed. Even though the early stages of this process remains unexplored, it may be reasonably assumed that NPS/silica is influenced by several parameters. A first set of these parameters is
well-known in the context of the conventional latex chemistry and are mainly the temperature and the monomer, surfactant and initiator concentrations. The second set of parameters is directly linked to the presence of the silica seeds: their size and the surface area they develop. We have previously seen that Ssilica influences and values because of the promoted heteronucleation
mechanism. But the Dsilica is absolutely as important because, in the context of the growth of the polymer nodules, it conditions the
maximal number of satellites which can co-exist on the same seed for obvious steric reasons. Therefore, because of their growth, the final number of PS nuclei per seed can be lower than the initial one which is defined at the time when the
10
nucleation stage is completed and the growth stage starts. Indeed, some growing nodules may merge when they come into contact and some other ones may abandon the seed surface when the latter becomes too crowded.
For any value of higher than or equal to 3, there exists indeed a maximum size ratio (DPS/Dsilica)max or volume ratio
between the PS nodules and the silica seed. Precise knowledge about this geometrical limit is clearly one of the key for the successful synthesis of predefined clusters in high yield. Using the definition of the PS-to-silica volume ratio ( / )3 in Eq.
1, we obtained Eq. 2 linking RV and NPS/silica with the adjustable parameter K which depends on the average size of the PS nodules.
3 - 1 3 (2)
Eq. 2 is an approximation of the geometrical boundary between possible and impossible morphologies due to steric reasons. To improve the estimation of the boundary, we used a model based on pure geometrical constraints and previously developed for the synthesis of supermolecular complexes of dendrimer macromolecules by Tomalia and coworkers, and called here Tomalia’s model.32 It considers a rigid ‘‘target’’ sphere of diameter D1 and ‘‘probe’’ spheres, also rigid, each of diameter D2, arriving in the coordination
shell of the target sphere and attaching to the target sphere at random sites. The authors therefore examined the related problem of parking spheres on spheres: how many probe spheres, on average, will become attached to the target sphere if the process continues until all available sites are exhausted. From this study, geometrical boundaries (D2/D1)max were calculated, when analytical
expressions exist, i.e. in the case of the clusters of high symmetry, or estimated in the other situations ((DPS/Dsilica)max, Table 3). Two
main areas may be considered on Figure 3a (green trace) where (DPS/Dsilica)max were convertedinto values: a non-existence
domain above the segmented trace of the geometrical boundaries, and an existence domain on the trace, where the satellite spheres are in close contact on the horizontal segments. Therefore, the vertical segments represent the size ratio ranges for which a specific morphology exists.
Tomalia’s model may be considered pertinent if it is pointed out that in our situation the process no longer consists of parking pre-formed spheres around another one, but involves a progressive rearrangement of growing spheres around a central one by permitting any too bulky PS nodule to be either removed from the seed surface or merged through a coalescence event with an other nodule and therefore causing a new rearrangement and possible growth. Tomalia's model is oblivious to this cluster story before reaching the boundary, but it may be considered for our purpose if the existence domain is extended to the whole surface area below the segmented trace of the geometrical boundaries.
In order to account for the complex situation of the growth of PS over a pre-existing seed, we recently developed a third and more sophisticated geometrical model, called here Thill’s model, which integrates the growth story of the satellite spheres.18 It assumes in particular that the nucleation and growth stages are separate, i.e. the initial PS nuclei appear not only simultaneously but also with the same size. The model was used to simulate independently the morphology evolution of single silica seed or statistical series of single seeds according to several growth scenarios where the importance of the nodule surface rearrangement, coalescence and expulsion can be modulated. Thill’s model does consider that all nuclei grow at the same surface rate and when two growing PS satellites comes into contact they first have the possibility, with a given probability PP, that one pushes the other one on the seed surface to
continue to grow (Figure 3b). Then if the silica surface becomes too crowded for further motion, two events are made possible for releasing free space: two PS satellites merge in a larger one by coalescence, or one is expelled from the silica surface and continue to grow independently. The design of the algorithm avoids inefficient motion sequences and takes into account the probability of coalescence vs. expulsion PC, as a function of the age of the PS satellites (because the latex coalescence is known to be more likely at
low monomer-to-polymer conversion). Lastly, each cluster is aged separately, therefore the aggregation between clusters cannot be considered, meaning that the sometimes-observed clusters made of several silica seeds cannot be simulated.
Thill's model was first used to refine the geometrical boundary proposed in Tomalia's model. Indeed, for a given number of satellites , the size ratio was determined at the time when rearrangement is no longer possible. Using values of PP = 1 and
PC = 0, the simulation was run 100 times and RV values attained when the first nodule expulsion occurs were recorded. The average
values are reported in Table 3. The values of (DPS/Dsilica)max estimated in this way fit quite well with those reported by Tomalia
11
values for the cases NPS/silica = 5 and 11 that were not proposed by Tomalia and coll.
In experimental situations, the true geometrical boundary is probably slightly different from the calculated ones, because (i) the sphericity and the size monodispersity of the PS nodules are never ideal, (ii) their contact angle with the silica surface makes the latter partially engulfed in the PS nodules, differently from the models where spheres are considered rigid and ideally spherical and share only contact points, and (iii) when growing the PS nodules are swollen with styrene making them more bulky than observed later on TEM grids under vacuum. Nevertheless, these calculated geometrical boundaries appeared to be a serious basis for the next developments and discussion.
(a) (b)
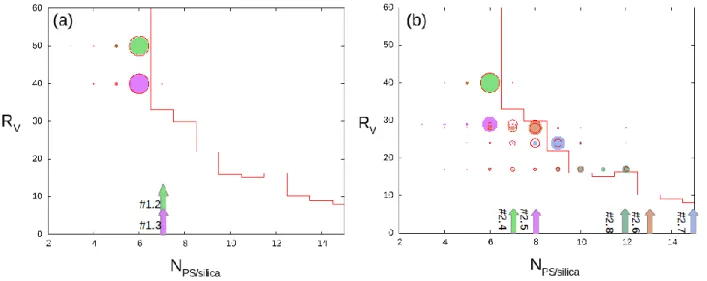
Fig. 3. (a) Existence domain of clusters made of PS nodules arranged onto the surface of a central silica sphere expressed in
PS-to-silica ratio volume RV as a function of NPS/silica and as defined by the surface area below the geometrical boundaries = f(NPS/silica)
computed from Tomalia's and Thill’s models (green and red traces partially superimposed, respectively). The extra purple and blue traces were obtained from Eq. 2 with K = 16.2 and K = 10.9, respectively. (b) Rules of Thill’s model for the nucleation and growth of
the PS nodules.
In a production batch of PS/silica clusters, it shall be envisioned that every cluster arises from the bottom of the existence domain along vertical lines corresponding to the number of initially growing PS nodules . If the possibility of merging or losing
inadvertently nodules is neglected, it “climbs” this line, along which it stops as soon as the growth stage, i.e. the polymerization reaction, is complete. But, if, prior to the completion, the geometrical boundary is reached, it implies that the PS nodules have become too bulky and that, for ensuring their further growth, the value of NPS/silica shall be reduced by at least one unit. This is carried
out through either expulsion from the surface or coalescence which gives rise to free PS particles or to an increase of the size polydispersity of the PS satellites, respectively. From that moment, the fate of this cluster is more or less described by the segmented geometrical boundary. In the former case, because the RV value is also simultaneously decreased, the fate trace is a little bit more
away from the boundary (See ESI, Fig. S7b† compared to S7a†). In such a scenario and taking into account the polydispersity in the growth progress of the cluster population, the most abundant clusters should be those which would have the longer life expectancy,
i.e. those which tolerate the largest ranges of DPS/Dsilica or RV values (Fig. 3b). So, it may be observed that clusters with NPS/silica = 5
or 11 are very difficult to obtain through this refinement process by steric hindrance. For example, when the geometrical boundary is reached with 6 nodules at RV ~ 80, a coalescence event will reduce the number of nodules to 5 but for 5 nodules is even lower
than for 6 (Table 3). Therefore, the new morphology will not be stable and more probably immediately evolve into that of a tetrapod. In the case of nodule expulsion, the situation is slightly more favourable as RV after expulsion is reduced: for six nodules reaching the
geometrical boundary at RV = 80, RV after expulsion will be 5/6 * 80 = 67 and thus the newly formed pentapod could still grow
before reaching its own geometrical boundary. In the case of hendecapods, the situation is the same for coalescence and it is slightly less favourable for expulsion as RV after expulsion is only reduced by a factor 11/12. Therefore, a dodecapod expelling a nodule at its
geometrical boundary will be transformed into a hendecapod with RV ~ 14.7 which is very close to the limit of 15.1. Lastly, it may be
mentioned that the occurrence of mutual repulsion between PS nodules prior to coalescence or expulsion events has a strong effect on the cluster fate. When PP = 0, whatever the value of PC, the growing cluster never gets closer to the geometrical boundary (ESI Fig.
S7c† and S7d†) because the random distribution of the PS nuclei make some of them rapidly in contact leading to a premature and regular decrease of the NPS/silica value.
12
It was very informative to report the cluster fractions obtained in the different synthesis batches described in Tables 1 and 2 as dots on the RV = f(NPS/silica) diagram on Fig. 4a and 4b, respectively. The y axis position of a batch is a priori determined knowing the
size and concentration of the silica seeds on one side, and the volume of styrene taking into account the monomer-to-polymer conversion attained at the end of the polymerization on the other side, according to Eq. 3. The experimental parameters used in the already described batches allowed to vary from 17 to 58. These values fix unambiguously the y axis position on the diagram
RV = f(NPS/silica) in the cases where the amount of free PS particles is negligible (as noted in Tables 1 and 2). In the other situations,
these global values shall not be mistaken with the local RV values of the single clusters. Indeed, considering the global , a
morphology can appear into the non-existence domain of the RV = f(NPS/silica) diagram because is artificially increased by the
contribution of the free PS particles. Therefore, in the presence of non-negligible amounts of free PS particles, the values are more or less over-estimated with regard to the local ones.
styrene 0 (styrene-to-polystyrene conversion)
polystyrene density
6
3 (3)
The initial x axis position, i.e. , was more complex to fix unambiguously. In order to estimate it, we made the hypothesis that
every free PS particles found in the batch had initially nucleated and begun to grow onto the surface of a silica seed in agreement with the heterogeneous nucleation regime previously demonstrated. Therefore, the smallest isolated PS particles of size
observed on the TEM grids would have been expelled from a silica seed upon approaching the steric hindrance boundary. Making also the assumption that the growth rate of the nodules is not strongly affected by the fact they are attached to or detached from the seeds, we made a rough estimate of the initial whole number of nuclei using Eq. 4 for every batch described in Tables 1 and 2.
(
)
3
(4)
In order to mimic digitally through Thill’s model the synthesis experiments reported in Tables 1 and , two unknowns have also been varied from one numerical experiment to the other one in order to match the statistical results on the proportions of the cluster morphologies and the size-polydispersity of the PS nodules. They are the PC value depending on the coalescence vs. expulsion
scenario, and the probability of pushing PP, because it could make sense from a chemical viewpoint to restrict the free motion
possibility and permit a coalescence/expulsion event even if the motion is still possible. As in the previous study,18 we observed that a high surface mobility of the PS nodules (PP = 1) has to be considered in order to reproduce the observed results. This analysis was
unexpected because the PS nodules are supposed to be covalently bonded to the silica surface through the MMS coupling agent whose acrylate moiety has in all likelihood copolymerized with styrene. It means that the PS nodules move or roll onto the surface for optimizing their steric arrangement at the expense of some energy penalties such as breaking of covalent bonds or extraction of copolymerized chains from the nodule bulk. The optimal PC values was 0.8 for most simulations. When the final volume ratio
was attained, the number of remaining PS nodules, their position and size were saved for statistical use. By fabricating digitally 1000 clusters per batch, i.e. in similar modeling conditions, the advantage of Thill’s model is to give not only the proportion of the main clusters obtained, but also the nature and the proportions of the side-products including the free (expelled) PS particles.
We thus revisited digitally the experiments described in Table 1 which dealt with the influence of the silica seed concentration and showed that hexapods were systematically obtained as the main cluster population. The values of and were measured/computed and added to the data of Table 1. At first glance, these calculations made the estimation of questionable because, without the need to run the model, the average values of ~5 and ~3 for the experiments at high silica seed
concentrations (Entries #1.4 and #1.5, respectively) were not consistent with the final production of hexapods ( = 6).
Moreover, for these same batches, we observed a mismatch between the RV value reported in Table 1 and the one obtained by
computing ni( / )3, which was explained by the already-discussed large amounts of “multi-silica” clusters (up to 0% of
the batch composition). Such “multi-silica” clusters could have prevented the efficient growth of a significant proportion of PS satellites. This unexpected evolution prevented us from exploiting the values and using Eq. 3. Therefore these two cases were excluded from the simulation study.
The correlation between the experimental and numerical results was indeed studied for the reference batch (Entry #1.3) and the batch performed at lower seed concentration (Entry #1.2). The x,y coordinates of the compositions of both batches were reported on
13
the existence diagram as spherical spots with diameter proportional to the actual proportions of the different clusters found in the batch (Figure 4a). The value of equal to 4 as calculated from Eq. 4 is shown as an arrow of the same colour arising from the bottom of the diagram. In this way, it may be easily observed that, for Entry #1.3, the pathway from the arrow to the corresponding spots crosses the existence diagram boundary and the final x,y coordinates of the batches are very close to the geometrical boundary. Indeed, the value for seven nuclei is 33.1 (cf. Table 3), slightly below the experimental value of 39. It means that this batch probably experienced some refinement by steric hindrance through either coalescence or more probably expulsion of nuclei because of the non-negligible amount of free PS particles. This effect was more acute when the amount of silica seeds was lower (Entry #1.2) with a higher value of (Table 1), consistently with a higher amount of free PS particles and therefore an earlier saturation of the seed surface. Therefore Thill's model was run for both cases, the proportions of the different clusters were extracted statistically (shown as red circles on Figure 4a) and a very good agreement was found with the experimental ones when the extra parameters PP
and PC were fixed to 1 and 0.8, respectively (Table 1).
Fig. 4. Plot of the cluster composition of the experimental (colored spots) and numerical (empty red spots) batches on the
RV = f(NPS/silica) diagram when (a) the concentration of the silica seeds and (b) the size of the silica seeds were varied according to the
data from Table 1 and Table 2, respectively. The whole values of were labelled with arrows arising from the bottom of the diagram.
A similar strategy was employed with the data of Table 2 when the varying parameter was the size of the silica seeds, and simultaneously their concentration for maintaining a developed surface area of about 170 m2.L-1 (Figure 4b). We had previously reported the successful synthesis of multipods with NPS/silica of 2, 3, 4, 6, 8 10 and 12 when only Synperonic® NP30 was used as
surfactant and the monomer-to-polymer conversion was kept lower than 30 %.14 The x,y position of these batches is well described by Eq. 2 with a value of K = 16.2 (for DPS of about 200 nm). These cases are relatively far from the geometrical boundary and this
explains why the obtained morphologies were badly defined and systematically observed in complex mixtures (Figure 3a, purple trace). By replacing 5 wt.% of Synperonic® NP30 by SDS, attained values of about 150 nm, and, with yields as high as 80 %,
tetrapods and hexapods were obtained from 55-nm and 85-nm silica seeds, respectively, in agreement with a new value of K = 10.9.15 This K value makes the estimation closer to the geometrical boundary (Figure 3a, blue trace).
First, it may be observed that with the smallest seeds (Entries #2.1 to #2.3), the geometrical boundary was never reached, with systematically lower than (Table 2). This result is in agreement with the negligible amount of the free PS particles estimated by TEM and this is a direct proof of the validity of the heteronucleation hypothesis, at least in these experimental conditions where in particular the developed surface area of silica is about 170 m2.L-1. Therefore, for these three batches, it was not possible to determine unambiguously the values, and Thill’s model was not applied.
In contrast, the refinement process based on the steric hindrance was efficient for the experiments made with seeds with diameter of 85 nm and higher (Entries #2.4 to #2.8), as confirmed by the numerical experiments performed with the previously determined values of PP and PC and allowed to reproduce quite satisfactorily the observed morphologies (Table 2, Figure 4b).
14
The case of the Entry #2.8 deserves to be discussed more deeply. It may be indeed observed that the x,y coordinates of the main clusters, i.e. dodecapods, do not belong to the existence domain. We tried to understand this abnormality by studying thoroughly the size distribution and shape of the PS nodules: if a slight oblong shape may be observed on some TEM pictures, its quantification from 3D-reconstruction images failed or fell in the uncertainty range. Of course the simulated results were inconsistent giving octopods (35 %) and nonapods (48 %) as main products. A way to improve the fit with the experimental results was to decrease the value to 14 and decreases the number of initial nuclei . As mentioned in Table 2, this batch was also made of polystyrene particles of few millimetres probably entrapping a huge number of clusters. As a consequence, the volume of styrene actually employed for producing the nodules was very probably overestimated giving therefore an overestimated value. Similar large polystyrene particles were also observed in two other batches (Entries #2.5 and #2.7), but with lesser consequences because the x,y coordinates were farer from the geometrical boundary.
The good correlation between the chemical and numerical experiments showed therefore the robustness of Thill’s model and the soundness of the founding hypotheses. It may be drawn that for achieving a high yield of a targeted morphology with n PS satellites per silica core, it is more efficient to let operate the refinement process based on the geometrical hindrance, by adjusting the between the and and by starting from a value as high as possible at the expense of the production of high amounts of free PS particles and of a certain size-polydispersity of the PS satellites if the coalescence mechanism is preferred. It allows indeed to correct partially the unavoidable dispersion on the values and in such situations the model is efficient by
injecting simply the single average value.
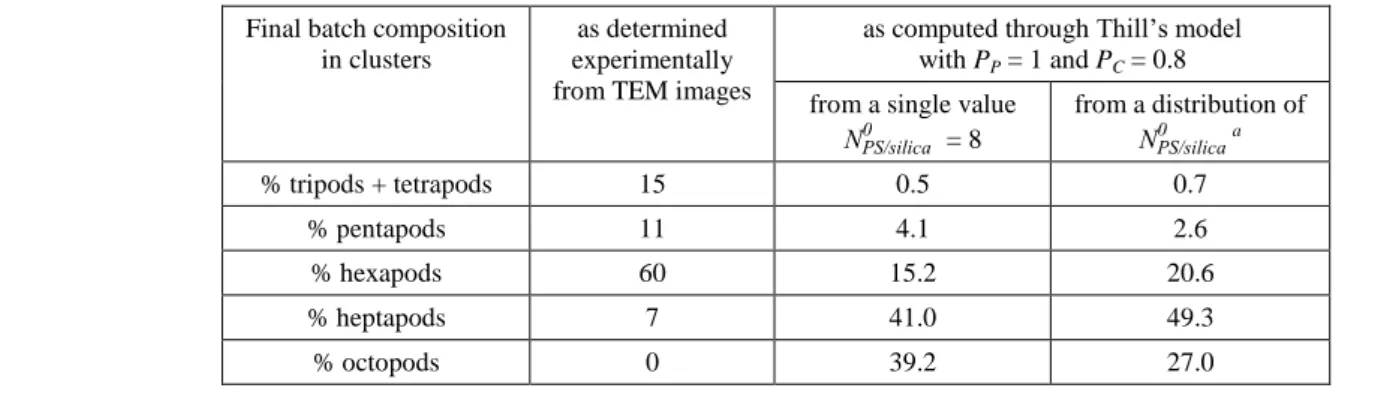
In the cases where the geometrical boundary was not reached, the morphology polydispersity resulted essentially from the polydispersity of the initial number of nuclei per seed . In this case, Thill’s model is probably not efficient for predicting the observed morphologies, because it ignores this polydispersity by considering a single initial nuclei number for a given seed size. On the contrary, when the geometrical boundary is reached, the impact of the initial nuclei polydispersity in number is no longer important. We thus compared the morphologies predicted by Thill's model from 1000 seeds bearing exactly 8 initial nuclei on one side and from a mixture of 50, 200, 500, 200 and 50 seeds bearing 6, 7, 8, 9 and 10 PS nuclei, respectively, in the case of the batch #2.5 (Table 4). The very slight differences in the cluster distribution obtained from both simulations is the proof of the validity of this hypothesis.
Table 4. Influence of the polydispersity of the number of initial nuclei per seed on the final morphology distribution (in the case of the batch #2.5).
Final batch composition in clusters
as determined experimentally from TEM images
as computed through Thill’s model with PP = 1 and PC = 0.8
from a single value
= 8 from a distribution of a % tripods + tetrapods 15 0.5 0.7 % pentapods 11 4.1 2.6 % hexapods 60 15.2 20.6 % heptapods 7 41.0 49.3 % octopods 0 39.2 27.0
a made of a mixture of 50, 200, 500, 200 and 50 seeds bearing 6, 7, 8, 9 and 10 PS nuclei, respectively.
Third section: Towards new experimental levers for widening the range of accessible clusters
As previously observed, clusters with a small number of PS satellites, e.g. tripods, weren’t easy to get as the main population. Thill’s model taught to us that there would exist two main routes to prepare them.
The first route would be to take advantage of the refinement process based on the geometrical hindrance. It means that the value must be as high as the = 352 (Table 3). This value is huge and it would necessitate either to increase the concentration of styrene in proportion that would make the polymerization unrealistic or to decrease the silica amount by lowering the concentration of the particles (but the previous results showed that this solution is not efficient) or the size of the silica seeds. For instance, starting
15
from the reference batch, the seed diameter should be decreased from 85 to at least 40 nm, but at the expense of the formation of a huge amount of free PS particles.
The second route would be to decrease the number of initial nuclei per seed by rendering the nucleation process less
favorable. We had already discussed about the consequence of the presence of SDS in the surfactant mixture with regard to the final size and number of PS nodules.15 Preliminary experiments in the absence of silica seeds showed that the higher the SDS concentration, the smaller and the more numerous the PS particles (see ESI, Fig. S8†, red data). This phenomenon remained, but appeared less pronounced, when 85-nm silica seeds were introduced (see ESI, Fig. S8†, blue data). It would be related to the previously described role of SDS and silica seeds in heterogeneous nucleation. In light of this phenomenon, we first attempted to start again from the reference experiment and just to decrease the fraction of SDS from 5 to 1 wt.% (Table 5, Entry #5.2). The statistical analysis of the TEM images showed that the distribution morphology was dramatically narrowed with essentially tetrapods (71 %) and tripods (23 %). In order to make the tripods as the main products (70 %), we were obliged to decrease also the seed size from 85 to 54 nm (Table 5, Entry #5.1, Figure 5a). In that situation the high concentration of seeds also led to 11 % of “multi-silica” clusters. Interestingly, it may be observed that this narrowed cluster distribution was obtained without the refinement process at the geometrical boundary. Eq. 4 was not used to compute because of the obvious absence of free PS particles. But it can be
postulated that the narrow morphology dispersion was linked to the narrow distribution of . Thill’s model was not run for
these experiments because, as the boundary was never reached and with PP = 1, it would only grow the initial nuclei up to the final
16
Table 5. Influence of the SDS fraction in the surfactant mixture and of the styrene concentration on the morphology and geometrical
parameters of the PS/silica clusters ([Na2S2O8]0 = 0.5 g.L-1; [surfactant] = 3 g.L-1). Bold numerals concern the main cluster population. In darken cells: comparative results of the simulation experiments according to Thill’s model.
Entry #5.1 #5.2 #5.3 #5.4 Experimental conditions Dsilica (nm) 54 85 85 85 Nsilica (1015 L-1) 19 7.3 7.3 7.3 Ssilica (m2.L-1) 174 166 166 166 [styrene]0 (g.L-1) 100 100 100 45 wt.% of SDS 1 1 10 5 Conversion (%) 90 90 91 89 a 57 38 40 17 Final batch composition in clusters
Exp. vs. simul. Exp.b Exp.b Exp.b Simul. Exp.b Simul.
PC 0.1 0.2 PP 1 1 % mono/bipods 17 2 - 0.4 - -% tripods 70 23 - 5.0 - -% tetrapods 2 71 - 12.9 - -% pentapods - 1 3 25.9
}
4}
1.6 % hexapods - - 21 37 % heptapods - - 12 17.9 - 1.0 % octopods - - 38 0.9 5 5.5 % nonapods - - - - 5 12.0 % decapods - - - - 6 20.5 % hendecapods - - - - 5 21.0 % dodecapods - - - - 74 38.4 % “multi-silica” 11 3 26 - 1 (nm) PDI 156 1.020 163 1.022 139 1.003 141 1.009 83 1.021 901.011 Final batch composition in free PS particles amount +++ 36 % d + 24 % d (nm) ~158 ~180 ~139 140 ~88 89 c ~2.3 ~4 ~9 9 ~15 15Typical TEM image on Fig. 5a/S9† S10† S11† 5b/S12†
a
as calculated from Eq. 3 b
as extracted from the statistical analysis of TEM images c
as calculated from Eq. 4 from the experimental results and used in the simulation experiments d
17
Fig. 5 Typical TEM images of PS/silica clusters obtained by styrene emulsion polymerization from silica seeds in different
experimental conditions described in Table 5: (a) Entry #5.1; (b) Entry #5.4. The undoubtedly identified multipods belonging to the most abundant morphology family are labelled with patterns described on the right. Original (unlabelled) TEM images may be
examined in ESI, Fig. S9† and S1 †, respectively.
Fig. 6. Plot of the cluster composition of the experimental (colored spots) and numerical (empty red spots) batches on the
RV = f(NPS/silica) diagram when the concentration of styrene and/or the SDS proportion in the surfactant mixture were varied according
to data from Table 5. The whole values of were labelled with arrows arising from the bottom of the diagram.
Another challenge was to produce already-observed clusters but for a different seed size. For instance, we attempted the synthesis of dodecapods from 85-nm silica seeds. The reflex action was to start from the reference experiment and increase the fraction of SDS from 5 to 10 wt.% (Table 5, Entry #5.3). Nevertheless, we achieved a complex mixture with mostly octopods (38 %) but also “multi-silica” clusters ( 6 %) showing that the role of the non-ionic surfactant, i.e. Synperonic© NP30, seems mandatory for stabilizing the emulsion system and therefore controlling the morphology of the clusters.29 In this case, Thill's model required a strong reduction of the coalescence probability in order to approach the experimental results. With PC = 0.1 instead of 0.8 for 5% of SDS, the model
predicted 32% of expelled PS particles and an average nodule size of 139 nm in very good agreement with the experimental data. However, the model failed to reproduce the 38% of octopod morphology.
Increasing the value was more efficiently achieved by lowering the monomer concentration, i.e. increasing the
surfactant-to-monomer ratio. Dodecapods were indeed readily obtained with a yield of 74 % by decreasing the styrene concentration from 100 to 45 g.L-1 (Table 5, Entry #5.4, and Figure 5b). Thill’s model was run on this last experiment, but however failed to reproduce such a high proportion of dodecapods: the targeted was only slightly above the limit for 12 nodules but the simulation started with 15 nuclei; the steric boundary will thus be reached well before the end of the polymerization at RV = 8 and the cluster will evolve close
18
to the boundary for a long period. It is interesting to note that, in this case, the free PS particles were larger than the satellite nodules,
i.e. a situation which cannot occur in Thill's model. It may come from the fact that, when close to the steric boundary, the growth of
the attached nodules would be more or less significantly slower than for the free particles because the monomer feeding would be less efficient.
Variations of the initial styrene concentration were very efficient for modifying the nucleation step. Indeed, when the styrene concentration was reduced from 100 g.L-1 (Entry #1.3) to 45 g.L-1 (Entry #5.4), the initial nuclei concentration estimated from Eq. 4 increased from 9 to 15, leading to very different fates, because the geometrical boundary was supposed to be reached for RV ~30 and
~8, respectively. However, the targeted attained after complete monomer conversion was 40 and 17 for Entries #1.3 and #5.4, respectively. Through this example, it may be seen that the hypothetic position of a batch on the existence diagram when the monomer concentration is reduced did not necessarily follow the same evolution as the geometrical boundary and the increase of the initial nuclei number leads to an increase of the time interval during which the morphology selection through coalescence or expulsion is active. This process produces many side morphologies. As a result, the batch #5.4 produced a larger number of free PS particles and a higher polydispersity in the obtained morphologies compared to the reference experiment. A possible workaround would be to stop the reaction before the complete conversion of styrene, at the expense of tricky purification stages for removing the excess styrene.14 For example, using about 70 g.L-1 as initial styrene concentration should give 12 initial nuclei but the experimental would thus be 27. It would be necessary to stop the reaction at a styrene-to-polystyrene conversion of about 60% in order to not reach the geometrical boundary which is RV = 16 for 12 initial nuclei. Such process would lead to a morphology polydispersity only
due to the dispersion in the initial nuclei number. The quality of such nucleation-controlled morphologies is still largely unknown especially for the large nodule numbers and should be the subject of future research. We know that in the cases of very limited nucleation the geometrical boundary is never reached. These batches do not display the formation of pure products but a largely dominating population of 70-80% which is already very satisfying.
Conclusion
The variation of a low number of experimental parameters, i.e. the size of the silica seeds, the fraction of SDS in the surfactant mixture and the concentration of styrene, allowed us to obtain batches of regular clusters, from tripods to dodecapods, made of a silica core and PS satellites whose number, size and position were controlled. These clusters were thoroughly characterized by extensive statistical analysis of TEM images and for the first time from large-field cryo-electron tomography reconstructions. The more symmetrical are those which were obtained with the highest yields, e.g. tripods, tetrapods, hexapods, nonapods and dodecapods. Thill’s model implemented in this study demonstrated that (i) the surface rearrangement of the growing PS nodules is unexpectedly mandatory for making the cluster geometry regular and (ii) coalescence events allow one to explain the slight polydispersity of the PS nodules. Also, it showed that the highest morphology yields may be obtained in the situations where the number-polydispersity of the growing PS nodules is narrowed and tuned to the targeted values or when the geometrical boundary is reached and a subsequent steric refinement spontaneously occurs. The enforcement of these simple rules allowed us to target successfully some specific morphologies and very probably the less symmetrical ones at short term. However, despite these important rationalization insights, the mechanism of the early stage of nucleation remains unexplained and necessitates further investigations.
Some of the as-obtained multipod-like clusters may mimic conventional simple molecules made of one central atom:4 tripod for BF3 (trigonal planar), tetrapod for CH4 (tetrahedral), or hexapod for SF6 (octahedral), even if the respective atomic radii remains to be tuned thanks to the synthesis parameters, e.g. monomer-to-polymer conversion. Dodecapods may mimic atomic icosahedral clusters such as those observed in the crystalline structure of some intermetallic compounds, e.g. A15 phases. From a more general viewpoint, these new clusters could be classified among the H-4:(S-2)n nanoparticles in the frame of the nano-periodic system proposed by Tomalia and coll. in an attempt of unifying and defining nanoscience from metal nanoparticles to fullerenes, dendrimers, polymeric micelles, viruses, etc.33-34
Lastly, these clusters are also precursors of original anisotropic building-blocks, e.g. spherical silica nanoparticles bearing a controlled number of dimples which may be used as entropic35 or entropic/enthalpic36 patches for self-assembly purpose. They are indeed expected to establish directional interactions and therefore to form open supra-particular materials.
![Table 2. Influence of the diameter of the silica seeds on the morphology and geometrical parameters of the PS/silica clusters ([styrene] 0 = 100 g.L -1 ; [Na 2 S 2 O 8 ] 0 = 0.5 g.L -1 ; [surfactant] = 3 g.L -1 including 5 wt.% of SDS)](https://thumb-eu.123doks.com/thumbv2/123doknet/13146446.388974/7.892.92.811.181.986/influence-diameter-morphology-geometrical-parameters-clusters-surfactant-including.webp)

![Table 5. Influence of the SDS fraction in the surfactant mixture and of the styrene concentration on the morphology and geometrical parameters of the PS/silica clusters ([Na 2 S 2 O 8 ] 0 = 0.5 g.L -1 ; [surfactant] = 3 g.L -1 )](https://thumb-eu.123doks.com/thumbv2/123doknet/13146446.388974/17.892.84.769.167.931/influence-fraction-surfactant-concentration-morphology-geometrical-parameters-surfactant.webp)