HAL Id: hal-03086953
https://hal.archives-ouvertes.fr/hal-03086953
Submitted on 23 Dec 2020HAL is a multi-disciplinary open access archive for the deposit and dissemination of sci-entific research documents, whether they are pub-lished or not. The documents may come from teaching and research institutions in France or abroad, or from public or private research centers.
L’archive ouverte pluridisciplinaire HAL, est destinée au dépôt et à la diffusion de documents scientifiques de niveau recherche, publiés ou non, émanant des établissements d’enseignement et de recherche français ou étrangers, des laboratoires publics ou privés.
Magnetization Density Distribution of Sr 2 IrO 4 :
Deviation from a Local jeff = 1 / 2 Picture
Jaehong Jeong, Benjamin Lenz, Arsen Gukasov, Xavier Fabrèges, Andrew
Sazonov, Vladimir Hutanu, Alex Louat, Dalila Bounoua, Cyril Martins, Silke
Biermann, et al.
To cite this version:
Jaehong Jeong, Benjamin Lenz, Arsen Gukasov, Xavier Fabrèges, Andrew Sazonov, et al.. Magnetiza-tion Density DistribuMagnetiza-tion of Sr 2 IrO 4 : DeviaMagnetiza-tion from a Local jeff = 1 / 2 Picture. Physical Review Letters, American Physical Society, 2020, 125 (9), pp.097202. �10.1103/PhysRevLett.125.097202�. �hal-03086953�
Magnetization density distribution of Sr
2IrO
4: Deviation from a
local j
eff= 1/2 picture
Jaehong Jeong,1, 2,∗ Benjamin Lenz,3, 4 Arsen Gukasov,1 Xavier Fabr`eges,1 Andrew
Sazonov,5 Vladimir Hutanu,5 Alex Louat,6 Dalila Bounoua,1 Cyril Martins,7 Silke
Biermann,3, 8, 9, 10 V´eronique Brouet,6 Yvan Sidis,1 and Philippe Bourges1,† 1Universit´e Paris-Saclay, CNRS, CEA,
Laboratoire L´eon Brillouin, 91191, Gif-sur-Yvette, France
2Center for Correlated Electron Systems, Institute for Basic Science (IBS),
Seoul National University, Seoul 08826, Korea
3Centre de Physique Th´eorique, Ecole Polytechnique, CNRS UMR7644,
Institut Polytechnique de Paris, 91128 Palaiseau Cedex, France
4IMPMC , Sorbonne Universit´e, CNRS , MNHN ,
IRD, 4 place Jussieu , 75252 Paris, France
5Institute of Crystallography, RWTH Aachen University and J¨ulich Centre for Neutron
Science (JCNS) at Heinz Maier-Leibnitz Zentrum (MLZ), 85747 Garching, Germany
6Laboratoire de Physique des Solides,
Universit´e Paris-Sud, UMR 8502, 91405 Orsay, France
7Laboratoire de Chimie et Physique Quantiques,
UMR 5626, Universit´e Paul Sabatier, 118 route de Narbonne, 31400 Toulouse, France
8Coll`ege de France, 11 place Marcelin Berthelot, 75005 Paris, France 9Department of Physics, Division of Mathematical Physics,
Lund University, Professorsgatan 1, 22363 Lund, Sweden
10European Theoretical Spectroscopy Facility, 91128 Palaiseau, France, Europe
Abstract
5d iridium oxides are of huge interest due to the potential for new quantum states driven by strong spin-orbit coupling. The strontium iridate Sr2IrO4 is particularly in the spotlight because
of the so-called jeff= 1/2 state consisting of a quantum superposition of the three local t2g orbitals
with – in its most simple version – nearly equal population, which stabilizes an unconventional Mott insulating state. Here, we report an anisotropic and aspherical magnetization density distribution measured by polarized neutron diffraction in a magnetic field up to 5 T at 4 K, which strongly deviates from a local jeff = 1/2 picture even when distortion-induced deviations from the equal
weights of the orbital populations are taken into account. Once reconstructed by the maximum entropy method and multipole expansion model refinement, the magnetization density shows cross-shaped positive four lobes along the crystallographic tetragonal axes with a large spatial extent, showing that the xy orbital contribution is dominant. The analogy to the superconducting copper oxide systems might then be weaker than commonly thought.
Sr2IrO4 possesses a tetragonal structure with I41/acd space group, in which the IrO6
octahedra are rotated by ≈11◦ around the c-axis with an opposite phase for the neighboring
Ir ions and it orders antiferromagnetically below TN ≈ 230 K [1–5]. Strong spin-orbit
cou-pling (SOC) stabilizes an unconventional Mott insulating ground state, which is commonly described by a spin-orbital product state within a so-called jeff = 1/2 model [2, 6–8]. In the
most simple version of this model, 5d electrons at the Ir4+ (5d5) ions occupy the t
2g states
with an effective angular momentum leff = 1, which are split by the relatively large SOC
into a jeff = 1/2 doublet and a jeff = 3/2 quartet. The Coulomb repulsion induces a gap in
the narrow half-filled jeff = 1/2 band, and stabilizes the Mott insulating state with the
pseu-dospin jeff = 1/2 [2, 7], which consists of three equally populated spin-orbital components
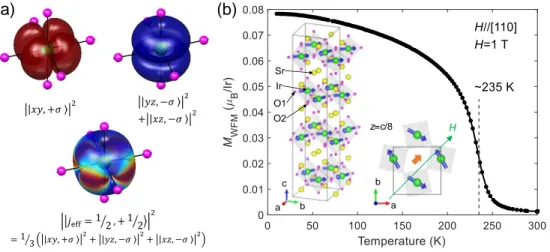
in the t2g band (Fig. 1a):
jeff = 1 2,± 1 2 = √1
3(|xy, ±σi ± |yz, ∓σi + i |xz, ∓σi) . (1) where ±σ denotes the spin of the electrons.
While resonant and inelastic X-ray scattering [6, 9] gave credit to a description in terms of these jeff = 1/2 states [10], the simple description with equal weights for the orbital
populations has been questioned owing to the tetragonal distortion that is not negligible [11– 13]. Indeed, the most simple model with equal weights is realized only for a perfect cubic symmetry, while any lattice distortions (compression, elongation or tilting of the octahedra around the c-axis) split the t2g orbitals into three non-degenerate Kramers doublets [7, 11,
13–16], driving the lowest energy state away from the equal weight case of Eq. (1). In the following we adopt the nomenclature common to the field and still refer to the states that diagonalize the local Hamiltonian in the presence of the distortions present in Sr2IrO4 as
jeff = 1/2 and jeff= 3/2 states. Fig. 1a compares the electron and spin density distributions
corresponding to the perfectly cubic and the distorted cases.
In addition, a strong hybridization between Ir 5d and O 2p orbitals, which seems to be natural for a large spatial extent of 5d orbitals, has been proposed to account for a large re-duction of the ordered magnetic moment [2] as well as for antiferromagnetic (AFM) exchange interactions between the nearest-neighboring Ir ions and for the canted magnetic moments following the octahedral rotations [7, 15]. The strong hybridization of the d-orbitals with the p-orbitals of the ligand oxygen is reminiscent of K2IrCl6 [17] and the isostructural ruthenate
(b) (a) ȁ𝑥𝑦, +𝜎ۧ2 ȁ𝑦𝑧, −𝜎ۧ 2 + ȁ𝑥𝑧, −𝜎ۧ2 ห𝑗eff= ൗ12 , + ൗ12ൿ 2 = ൗ13 ȁ𝑥𝑦, +𝜎ۧ2+ ȁ𝑦𝑧, −𝜎ۧ2+ ȁ𝑥𝑧, −𝜎ۧ2 a b z=c/8 Ir O1 Sr O2 a b c H
FIG. 1: The jeff = 1/2 states and uniform magnetization of Sr2IrO4. (a) Illustration of
the electron and spin density distributions for the ideal (distorted) jeff = 1/2, mj = 1/2 state,
which consists of three (nearly) equally populated t2g orbitals with mixed spin states. The red
and blue colors represent spin-up and spin-down states, respectively. (b) The magnetization vs temperature curve under H = 1 T (H//[110]). It exhibits a weak ferromagnetic moment inherited from the AF-II order transition [3] at≈235 K. The inset shows the crystal and magnetic structure of Sr2IrO4 for an applied magnetic field along H//[110].
muon spin relaxation measurements have suggested the formation of oxygen moments [19], and charge redistribution between adjacent IrO2 and SrO layers has been revealed using
electron spin resonance measurement [20]. Further, unusual magnetic multipoles have been proposed to be observed by neutron diffraction [21] and recently a hidden magnetic order having the same symmetry as a loop-current state has been observed by polarized neutron diffraction [22].
The magnetic moments of Ir ions are confined in the ab-plane and track the staggered octahedral rotation in an − + +− sequence along the c-axis in the unit cell [3]. Owing to this canted AFM structure, each IrO2 layer has a weak ferromagnetic (WFM) moment
along the principal crystallographic axis in the ab-plane at zero magnetic field. This WFM is compensated due to the − + +− stacking sequence whereas, in a magnetic field higher than Hc ≈ 0.3 T applied in the ab-plane [2, 3], a net homogeneous WFM moment appears
in the plane (inset of Fig. 1b) above the metamagnetic transition. Remarkably, this WFM moment follows the direction of applied magnetic field in the ab-plane [23–25] and attains a saturation value of ≈0.08µB/Ir in the field of 1 T [23]. In the current experiment, a uniform
magnetic field (H) up to 5 T has been applied along the vertical direction (Fig. 2a). The IrO6
octahedral rotation generates two additional magnetic terms in the simple Heisenberg-type Hamiltonian [25]: Jz and Dzyaloshinskii-Moriya terms, which restrict the angle between
adjacent pseudospins to π + 2α with the octahedral rotation angle α [7]. However, it does not break the in-plane rotational symmetry as the pseudospins are free to rotate in the plane while keeping the same canting angle between them (the situation is shown in the inset of Fig. 1b for a field applied along the [110] direction). Therefore, under the applied magnetic field, the WFM moment does not interlock with the rotation of IrO6 octahedra in contrast
with the AFM staggered moment at zero field.
The existence of this WFM allows us to probe the magnetization density distribution in crystals by polarized neutron diffraction (PND). This technique is unique because it provides direct information about the 3-dimensional distribution of the magnetization throughout the unit cell, which in turn allows for a determination of the symmetry of occupied orbitals. This method has been successfully used in the study of ferromagnetic ruthenate Ca1.5Sr0.5RuO4,
isostructural to Sr2IrO4, where an anomalously high spin density at the oxygen site and the
xy character of the Ru d-orbitals have been reported [18].
The typical experimental setup for PND, shown in Fig. 2a, consists of a neutron polarizer, a flipping device that reverses the incident neutron polarization, a magnet and a detector. The sample is magnetized by a magnetic field applied along the vertical axis and scattering intensities of Bragg reflections for the two opposite states (spin-up and spin-down) of the incident polarization are measured. They are used to calculate the so-called flipping ratio, allowing access to the Fourier components of the magnetization density, as
RPND = I↑ I↓ = F2 N + 2p sin2αFNFM + sin2αFM2 F2
N − 2pe sin2αFNFM + sin2αFM2
, (2)
where FN is the nuclear structure factor and FM is the magnetic structure factor. p and e
are the polarization efficiency of the polarizer and flipper, respectively, and α is the angle between the scattering vector and the magnetization [26]. The flipping ratios RPND of
more than 280 (hkl) reflections were measured in the weakly ferromagnetic state above the metamagnetic transition at 2 K for two magnetic field orientations, Hk[010] and Hk[¯110] (well above the critical field Hc ≈ 0.3 T [6, 25]). The measured intensities for two orientations
were averaged [26]. As shown in Fig. 2b, the magnetic structure factors FM were directly
(a) (b) sample detector flipper polarizer 𝐼↑~ 𝐹𝑁+ 𝐹𝑀2 off on 𝐼↓~ 𝐹𝑁− 𝐹𝑀2 𝐌𝒛 𝐤𝑖 𝐐 = 𝐤𝑖− 𝐤𝑓 𝐻 ∥ 𝑧 𝐤𝑓 Neutron spin (c) (d)
FIG. 2: Polarized neutron diffraction setup and measured neutron magnetic structure factor of Sr2IrO4. (a) The experimental setup for a polarized neutron diffraction experiment.
The arrows at the bottom denote a spin polarization of neutrons. The vertical direction corresponds to either the [010] or [¯110] crystallographic direction for each sample orientation [26]. (b) The magnetic structure factor of all measured momentum transfer Q with the theoretical radial integrals hjni for isolated Ir4+ ions. A series of reflections along the (0, 0, l) are highlighted: (0, 0, 4n) in blue
squares, (2, 0, 4n) in green diamonds, (1, 1, 4n + 2) in red up-triangles, (2, 1, 2n + 1) in purple down-triangles, and (2, 2, 4n) in black left-triangles. The (4, 0, 0), (4, 2, 0) and (4, 4, 0) are also presented in black right-triangles, and the rest in grey circles. Measured and fitted magnetic structure factors |FM(Q)| for (c) the optimized MEM result and (d) optimized multipole expansion result.
factors FN. For convenience, the amplitudes are given in Bohr magnetons, normalized by the
number of Ir atoms (8) in the unit cell, and taken in absolute values to remove alternating signs of the phase factor. The amplitude, FM(0), is imposed in agreement with the saturation
moment (0.08µB/Ir) given by the uniform magnetization measurement [23].
by a smooth decreasing function of Q, called the magnetic form factor, corresponding to a linear combination of radial integrals calculated from the electronic radial wave function. Instead in Fig. 2b, one observes a large distribution of the measured structure factor indi-cating unusually large anisotropy. That large anisotropy is explained by a predominance of xy-orbital as shown below using the reconstruction of the magnetization density in real space. The theoretical radial integrals hjni for an isolated Ir4+ ion [27] are also shown in
Fig. 2b for comparison. We recall that hj2i,hj4i and higher-order integrals are needed to
describe the departures from spherical symmetry. As seen from Fig. 2 except for the (0, 0, l) reflections, decreasing gradually with increasing Q, the majority of reflections strongly devi-ate from any expected smooth curve. Moreover, while the (0, 0, 4n), (2, 0, 4n) and (2, 2, 4n) reflections are close to thehj0i curve in a small Q region, the (1, 1, 4n + 2) and (2, 1, 2n + 1)
reflections deviate from it quite strongly. This indicates an aspherical magnetization density, which is typical of ions with one or two unpaired electrons in the d-orbitals [17, 28, 29]. In addition, one can see that high-Q reflections like the (4, 0, 0), (4, 2, 0) and (4, 4, 0) ones show anomalously large values.
Next, a real space visualization has been performed by a reconstruction of the magne-tization density, using two different very well-established and widely used approaches; a model-free maximum entropy method (MEM) [30] and a quantitative refinement using the multipole expansion of the density function [31]. Both techniques have advantages and lim-its and should be employed where they are the most efficient. Typically, no assumption is made for the initial magnetization distribution in MEM whereas the d-orbitals shape is constrained in the multipole expansion.
Since the crystal structure is centrosymmetric, the magnetization density can be directly reconstructed from the measured magnetic structure factors by MEM [30]. Fig. 3a-d, shows the 3-dimensional magnetization density reconstructed by using a conventional flat density prior. A positive magnetization density in red color denotes a magnetic moment density parallel to the applied magnetic field and a negative one in blue is antiparallel. There are three key features to be noted in the figure. First, the magnetization density at Ir sites has four positive density lobes directed along the a, b axes, corresponding to a dominant pos-itive magnetization density of dxy orbital symmetry (Fig. 3b). The two other components
of the effective jeff = 1/2 state model, dyz and dxz, which would form an axially symmetric
seen in Fig. 3c,d. Thus the WFM density originates predominantly from the xy orbital (a schematic illustration of the magnetic components in this situation is given in the Supple-mental file (Fig. S4) [26], in contrast with the local jeff = 1/2 picture). Second, positive
density lobes are very strongly elongated, in such a way that some magnetization density is delocalized well beyond of the IrO6 octahedra. Third, contrary to the expectation of strong
iridium oxygen ligand hybridization, no visible induced magnetization density appears at the oxygen sites. Actually, no significative polarization dependence has been found in any of dozens measured (2, 1, 2n + 1) reflections where oxygen atoms contribute. This is in contrast with the isostructural 4d compound Ca1.5Sr0.5RuO4, where ∼20% of the magnetic moment
is transferred to the in-plane O sites [18]. However, one can notice the presence of a negative magnetic density mostly along the Ir-O direction existing between the large positive lobes. In fact, a significant negative magnetization density as large as half of the net moment is essential for a better description in the MEM analysis [26].
To confirm the symmetry found by MEM, multipole expansion was performed for an alternative refinement of the WFM density [31, 32]. It is composed of radial and angular parts: Slater-type radial wave functions and real spherical harmonic density functions [26]. In Fig. 3e-h, the magnetization density distribution with the best refinement is shown. The main positive magnetization density lobes located between the local x- and y-axis appear clearly, which corresponds to the dxy symmetry. Therefore, the multipole expansion model
fully confirms the dxy symmetry found by MEM. A benefit of the multipole method is to
determine the contribution of all five d-orbitals to the magnetization. Using the orbital-multipole relations [31], the magnetic moments on each orbitals were obtained as: +0.48, −0.051, −0.035 and −0.314µB/Ir for dxy, dyz/xz, dz2 and dx2−y2, respectively. Thus a positive
dxy and to a lesser extent a negative dx2−y2 orbital are dominant in the refinement (the
latter effect is minor in the MEM method), while the dyz/xz orbitals are barely populated.
Interestingly, the admixture of dx2−y2 character to the jeff = 1/2 orbital also has been found
in first principles simulations [33].
It is obvious that the refinement of multipoles with a single radial exponent cannot fit the widely delocalized density. Therefore, we introduce in the refinement a second radial exponent to describe the delocalized Ir density. Such a model shows a considerably better agreement factor (Rw ∼ 0.09) compared to the model with a single radial exponent (Rw ∼
(a) (b) (c) (d)
(e) (f) (g) (h)
FIG. 3: Magnetization density distribution reconstructed by MEM and multipole ex-pansion refinement. 3D magnetization density distribution on the z = c/8 layer reconstructed by (a) the MEM and (e) multipole expansion model refinement. Isosurfaces encompassing 30%, 50% and 70% of the volume density are plotted with a desceding opacitiy according to their iso-values. Red and blue surfaces denote positive and negative magnetizations, repectively. The solid square and dotted lines denote the unit cell and Ir-O bonds, respectively. Sliced density contour maps at (b,f ) (x, y, c/8), (c,g) (x, a/4, z) and (d,h) (a/4 + x, x, z) are also shown for both meth-ods. The contour step is 0.04 and 0.08µB/˚A3 for (b-d) and (f-h), respectively. The black arrows
correspond to the Ir-O bonding directions.
the magnetization density of Ir found by the MEM analysis. To appreciate the relevance of the obtained magnetization maps, we calculate the magnetic structure factors from the optimized MEM and multipoles results. By plotting them along with the measured ones in Fig. 2c (for MEM) and Fig. 2d (for multipoles), one sees that the calculated densities with MEM reproduce better the experimental data.
While the standard modeling of layered iridates by means of an anisotropic super-exchange Hamiltonian within the effective local jeff = 1/2 picture correctly captures the
WFM moment of the ground state and explains the most salient magnetic properties of Sr2IrO4 [7, 10, 15, 16, 34], this local jeff = 1/2 model is at odds with the present findings: its
density, while taking into account distortions would – even worse – enhance the xz and yz orbital weight of the hole and thus of the WFM (see Fig. 1a).
These considerations give an additional twist to the exotic properties of Sr2IrO4 and
the possibilities of modeling them as well as to the relationship to superconducting copper oxides. Recently, our PND results has been interpreted in terms of spin anapole [35], pointing towards the existence of multipole correlations that goes beyond the local jeff = 1/2 picture.
An alternative interpretation based on a momentum-dependent composition of the orbital carrying the hole in terms of atomic t2g states will be published elsewhere [36]. In this type
of model, the hole resides in an orbital that results from a non-local, that is a k-dependent superposition of Wannier functions of t2g character. In this light, it is less surprising that
neither the simplified jeff = 1/2 picture discussed above nor the state that takes into account
the structural distortions but remains restricted to a local superposition of atomic orbitals describes our present experimental findings.
In summary, using PND we have evidenced a magnetization density distribution in Sr2IrO4 that is inconsistent with the local jeff = 1/2 picture. The measured magnetic
struc-ture factor shows a strong axial anisotropy and anomalous values at large Q, which indicate an aspherical magnetization density distribution with a significant orbital contribution. Real space visualization exhibits a dominant dxy orbital character with highly elongated lobes of
Ir magnetization densities towards the next Ir atoms. Although a strong d-p hybridiza-tion is expected in Sr2IrO4, the magnetization density at the ligand oxygen sites is barely
present. Our results elucidate that the ground state of Sr2IrO4 substantially deviates from
the commonly accepted local jeff = 1/2 state.
We acknowledge supports from the projects NirvAna (contract ANR-14-OHRI-0010) and SOCRATE (ANR-15-CE30-0009-01) of the French Agence Nationale de la Recherche (ANR), by the Investissement dAvenir LabEx PALM (GrantNo. ANR-10-LABX-0039-PALM) and by the European Research Council under grant agreement CorrelMat-617196 for financial support. J.J. was supported by an Incoming CEA fellowship from the CEA-Enhanced Eu-rotalents program, co-funded by FP7 Marie-Sklodowska-Curie COFUND program (Grant Agreement 600382) and by the Institute of Basic Science (IBS) in Korea (Grant No. IBS-R009-G1). Instrument POLI at Maier-Leibnitz Zentrum (MLZ) Garching is operated in co-operation between RWTH Aachen University and Forschungszentrum J¨ulich GmbH (J¨ ulich-Aachen Research Alliance JARA). We thank Pr S.V. Lovesey for valuable comments on the
manuscript and J. Porras for scientific discussions.
∗ [email protected] † [email protected]
[1] Q. Huang, J. Soubeyroux, O. Chmaissem, I. N. Sora, A. Santoro, R. J. Cava, J. J. Krajewski, and W. F. Peck, Journal of Solid State Chemistry 112, 355 (1994).
[2] B. J. Kim, H. Jin, S. J. Moon, J.-Y. Kim, B.-G. Park, C. S. Leem, J. Yu, T. W. Noh, C. Kim, S.-J. Oh, et al., Physical Review Letters 101, 076402 (2008).
[3] F. Ye, S. Chi, B. C. Chakoumakos, J. A. Fernandez-Baca, T. Qi, and G. Cao, Physical Review B 87, 140406(R) (2013).
[4] C. Dhital, T. Hogan, Z. Yamani, C. de la Cruz, X. Chen, S. Khadka, Z. Ren, and S. D. Wilson, Physical Review B 87, 144405 (2013).
[5] N. H. Sung, H. Gretarsson, D. Proepper, J. Porras, M. Le Tacon, A. V. Boris, B. Keimer, and B. J. Kim, Philosophical Magazine 96, 413 (2016).
[6] B. J. Kim, H. Ohsumi, T. Komesu, S. Sakai, T. Morita, H. Takagi, and T. Arima, Science 323, 1329 (2009).
[7] G. Jackeli and G. Khaliullin, Physical Review Letters 102, 017205 (2009). [8] F. Wang and T. Senthil, Physical Review Letters 106, 136402 (2011).
[9] J. Kim, D. Casa, M. H. Upton, T. Gog, Y.-J. Kim, J. F. Mitchell, M. van Veenendaal, M. Daghofer, J. van den Brink, G. Khaliullin, et al., Physical Review Letters 108, 177003 (2012).
[10] J. Bertinshaw, J. Y. Kim, G. Khaliullin, and B. J. Kim, Ann. Rev. of Condens. Matter Phys. 10, 315 (2019).
[11] L. C. Chapon and S. W. Lovesey, Journal of Physics: Condensed Matter 23, 252201 (2011). [12] D. Haskel, G. Fabbris, M. Zhernenkov, P. P. Kong, C. Q. Jin, G. Cao, and M. van Veenendaal,
Physical Review Letters 109, 027204 (2012).
[13] M. Moretti Sala, S. Boseggia, D. F. McMorrow, and G. Monaco, Physical Review Letters 112, 026403 (2014).
[14] A. Abragam and B. Bleaney, Electron paramagnetic resonance of transition ions (OUP Oxford, 2012).
[15] N. B. Perkins, Y. Sizyuk, and P. W¨olfle, Physical Review B 89, 035143 (2014). [16] B. Lenz, C. Martins, and S. Biermann, J. Phys.: Condens. Matter 31, 293001 (2019). [17] J. W. Lynn, G. Shirane, and M. Blume, Physical Review Letters 37, 154 (1976).
[18] A. Gukasov, M. Braden, R. J. Papoular, S. Nakatsuji, and Y. Maeno, Physical Review Letters 89, 087202 (2002).
[19] M. Miyazaki, R. Kadono, M. Hiraishi, A. Koda, K. M. Kojima, K. Ohashi, T. Takayama, and H. Takagi, Physical Review B 91, 155113 (2015).
[20] N. A. Bogdanov, V. M. Katukuri, J. Romh´anyi, V. Yushankhai, V. Kataev, B. B¨uchner, J. van den Brink, and L. Hozoi, Nature Communications 6, 7306 (2015).
[21] S. W. Lovesey and D. D. Khalyavin, Journal of Physics: Condensed Matter 26, 322201 (2014). [22] J. Jeong, Y. Sidis, A. Louat, V. Brouet, and P. Bourges, Nature Communications 8, 15119
(2017).
[23] L. Fruchter, D. Colson, and V. Brouet, Journal of Physics: Condensed Matter 28, 126003 (2016).
[24] M. Nauman, Y. Hong, T. Hussain, M. S. Seo, S. Y. Park, N. Lee, Y. J. Choi, W. Kang, and Y. Jo, Physical Review B 96, 155102 (2017).
[25] J. Porras, J. Bertinshaw, H. Liu, G. Khaliullin, N. H. Sung, J.-W. Kim, S. Francoual, P. Stef-fens, G. Deng, M. Moretti Sala, et al., Physical Review B 99, 085125 (2019).
[26] See Supplemental Material at [url] for the sample preparation and characterization (section I), for details of PND measurements (section II), for the data treatment methods (section III), for details of the MEM analysis (section IV) and for details of the multipole expansion analysis (section V), which includes Refs. [37–43].
[27] K. Kobayashi, T. Nagao, and M. Ito, Acta Crystallographica Section A: Foundations of Crys-tallography 67, 473 (2011).
[28] S. Shamoto, M. Sato, J. M. Tranquada, B. J. Sternlieb, and G. Shirane, Physical Review B 48, 13817 (1993).
[29] I. A. Zaliznyak and S.-H. Lee, Tech. Rep., BROOKHAVEN NATIONAL LABORATORY (US) (2004).
[30] R. J. Papoular and B. Gillon, EPL (Europhysics Letters) 13, 429 (1990).
[31] P. Coppens, X-ray charge densities and chemical bonding, vol. 4 (International Union of Crys-tallography, 1997).
[32] N. K. Hansen and P. Coppens, Acta Crystallographica Section A 34, 909 (1978).
[33] C. Martins, M. Aichhorn, and S. Biermann, Journal of Physics: Condensed Matter 29, 263001 (2017).
[34] C. Martins, B. Lenz, L. Perfetti, V. Brouet, F. Bertran, and S. Biermann, Phys. Rev. Materials 2, 032001 (2018).
[35] D. D. Khalyavin and S. W. Lovesey, Physical Review B 100, 224415 (2019). [36] B. Lenz et al., to be published (2020).
[37] A. Gukasov, A. Goujon, J.-L. Meuriot, C. Person, G. Exil, and G. Koskas, Physica B: Con-densed Matter 397, 131 (2007), ISSN 0921-4526, URL http://www.sciencedirect.com/ science/article/pii/S0921452607001445.
[38] A. Gukasov, S. Rodrigues, J.-L. Meuriot, T. Robillard, A. Sazonov, B. Gillon, A. Laverdunt, F. Prunes, and F. Coneggo, Physics Procedia 42, 150 (2013).
[39] J. Akimitsu, H. Ichikawa, N. Eguchi, T. Miyano, M. Nishi, and K. Kakurai, Journal of the Physical Society of Japan 70, 3475 (2001).
[40] C. Martins, Ph.D. thesis, Ecole Polytechnique, Palaiseau (2010).
[41] S. Agrestini, C.-Y. Kuo, M. Moretti Sala, Z. Hu, D. Kasinathan, K.-T. Ko, P. Glatzel, M. Rossi, J.-D. Cafun, K. O. Kvashnina, et al., Physical Review B 95, 205123 (2017). [42] A. Paturle and P. Coppens, Acta Crystallographica Section A 44, 6 (1988).
[43] P. J. Brown and J. C. Matthewman, Rutherford Appleton Laboratory, Rep. RAL–93–009 (1993).
Supplemental Material
Magnetization density distribution in Sr
2IrO
4: Deviation from a
local j
eff= 1/2 picture
Jaehong Jeong,1, 2,∗ Benjamin Lenz,3, 4 Arsen Gukasov,1 Xavier Fabr`eges,1 Andrew
Sazonov,5 Vladimir Hutanu,5 Alex Louat,6 Dalila Bounoua,1 Cyril Martins,7 Silke
Biermann,3, 8, 9, 10 V´eronique Brouet,6 Yvan Sidis,1 and Philippe Bourges1,†
1Universit´e Paris-Saclay, CNRS, CEA,
Laboratoire L´eon Brillouin, 91191, Gif-sur-Yvette, France
2Center for Correlated Electron Systems, Institute for Basic Science (IBS),
Seoul National University, Seoul 08826, Korea
3Centre de Physique Th´eorique, Ecole Polytechnique, CNRS UMR7644,
Institut Polytechnique de Paris, 91128 Palaiseau Cedex, France
4IMPMC , Sorbonne Universit´e, CNRS , MNHN ,
IRD, 4 place Jussieu , 75252 Paris, France
5Institute of Crystallography, RWTH Aachen University and J¨ulich Centre for Neutron
Science (JCNS) at Heinz Maier-Leibnitz Zentrum (MLZ), 85747 Garching, Germany
6Laboratoire de Physique des Solides,
Universit´e Paris-Sud, UMR 8502, 91405 Orsay, France
7Laboratoire de Chimie et Physique Quantiques,
UMR 5626, Universit´e Paul Sabatier, 118 route de Narbonne, 31400 Toulouse, France
8Coll`ege de France, 11 place Marcelin Berthelot, 75005 Paris, France 9Department of Physics, Division of Mathematical Physics,
Lund University, Professorsgatan 1, 22363 Lund, Sweden
10European Theoretical Spectroscopy Facility, 91128 Palaiseau, France, Europe
I. SAMPLE PREPARATION AND CHARACTERIZATION
High-quality single crystals of Sr2IrO4 were grown at Laboratoire de Physique des Solides
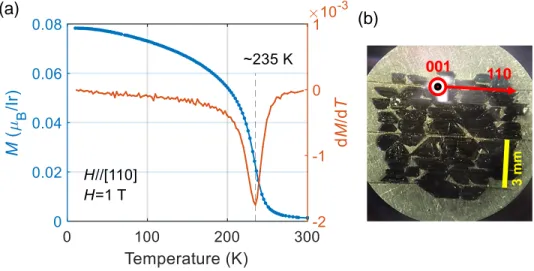
at Orsay using a self-flux method in the platinum crucibles. The temperature dependence of the uniform magnetization was measured using a SQUID under a magnetic field of H = 1 T along the [110] direction (Fig. S1a). Sr2IrO4 undergoes a canted antiferromagnetic
(AFM) transition. The ordered AFM moment is found to be about 0.21 µB/Ir1 or about
0.36 µB/Ir2 by single crystal neutron diffraction. We here discussed the weak in-plane
ferromagnetic moment due to the moment canting (see Fig 1.b in the main text). In presence of the magnetic field above H > 0.2 T, the system exhibits a ferromagnetic component at T ≈ 235 K, where the derivative dM/dT diverges. The saturation weak ferromagnetic (WFM) moment is ≈0.08µB/Ir at T = 10 K. It is well consistent with the reported value
for single crystals grown under the best conditions3. For the polarized neutron diffraction
measurements, which require a large amount of the sample, 50 single crystals of a small size (typically < 2× 1 × 0.2 mm3) were coaligned within a diameter of 10 mm on an aluminum
plate (Fig. S1b). 3 mm 110 001 (a) (b)
FIG. S1. (a) Temperature dependence of the uniform magnetization and its derivative measured by a SQUID. (b) Coaligned 50 single crystals on an aluminum plate.
II. POLARIZED NEUTRON DIFFRACTION
Polarized neutron diffraction (PND) measurements were performed on three different po-larized neutron diffractometers, 5C1 and 6T2 at the ORPH ´EE reactor (LLB CEA Saclay)4,5,
and POLI at FRM-II (Maier-Leibnitz Zentrum Garching). Thermal and hot polarized neu-tron wavelengths were used with λ=1.4 ˚A (6T2), 1.15 ˚A (POLI) and 0.84 ˚A (5C1). A vertical uniform magnetic field of 5 T on 5C1/6T2 at LLB and 2.2 T on POLI at FRMII has been applied at the sample position. As the weak ferromagnetic component saturates above∼ 1 T, that difference between the applied fields is not significant. The temperature was set at 4 K in the antiferromagnetic state of Sr2IrO4.
Incoming neutrons were polarized by a Heusler alloy monochromator, a supermirror ben-der or a 3He filter. The direction of incident neutron polarization – spin-up or spin-down
– was chosen by a polarization flipper. The incident spin-polarized neutrons are scattered by the nuclei and by the local magnetization, which are denoted by nuclear and magnetic scattering, respectively. The total neutron cross section for a non-chiral system is given by
σ = FNFN∗ + M⊥· M∗⊥+ Pi· (M⊥FN∗ + M∗⊥FN) , (S1)
where FN is the nuclear structure factor, M⊥ is the magnetic interaction vector and Pi
is the incident neutron polarization vector. The magnetic interaction vector is given as M⊥ = ˆQ× FM(Q)× ˆQ with the scattering vector Q and FM(Q) the magnetic structure
factor, i.e., the Fourier transform of the magnetic moment distribution. Therefore, only magnetic components perpendicular to the scattering vector participate in the magnetic scattering. The last magnetic-nuclear interference term appears only for a polarized beam (|Pi| > 0), and it contributes to the scattering for a mixed nuclear-magnetic Bragg reflection
with propagation vector q = 0. It corresponds to the magnetic response at the Brillouin zone center, Γ, point that would differ from the magnetic response at the aniferromagnetic propagation wave vector. In all the manuscript, we are only speaking about the weak fer-romagnetic component of the moment. This method is well established for paramagnetic and ferromagnetic (FM) systems. It gave access, e.g., to the 3d-orbital population in fer-romagnetic insulator YTiO36. While in conventional spin density studies either a positive
or a negative spin component can be present at a given ion, in the iridates thanks to the spin-orbit coupling both positive and negative densities can coexist at the same Ir site (Fig. 1a of the manuscript)7. To access this intra-atomic variation of magnetization density high
resolution polarized hot neutron diffraction data are needed. Here we have performed PND (i) to establish the symmetry of the Ir 5d orbitals occupied by unpaired electrons and (ii) to check the presence of unpaired electron density on the oxygen ligand.
In case of PND where incoming neutron polarization is directed parallel or antiparallel to an external magnetic field, one measures the intensity of the scattered neutrons for the two states of the flipper. We note that no final polarization analysis is performed. Therefore, the measured intensity, obtained for each state of the flipper, is written as a function of the real structure factors,
I↑ = FN2 + M⊥2+ 2PiFNM⊥z
I↓ = FN2 + M⊥2− 2Pi0FNM⊥z,
(S2)
where M⊥ is now the projection of the magnetic interaction vector M⊥ along the polariza-tion vector Pi with Pi and Pi0 being the incident polarization for spin-up and spin-down,
respectively. The PND measurement is thus only sensitive to the uniform magnetization along the applied magnetic field, which is the vertical z-direction in our case. Using Pi = p,
Pi0 = pe, M⊥ = sin αFM and M⊥z = sin2αFM where α is the angle between the magnetic
interaction vector and the scattering vector, the flipping ratio is given as Eq. (2) in the main text with the polarization efficiency p of the polarizer and the flipping efficiency e of the flipper. We give here the incident polarization characteristics of the three diffraction instruments which have been used:
• On 5C1, we used a Heussler polarizer with incident polarization p=0.91, and a cry-oflipper with efficiency e=0.995(6).
• On 6T2, polarizing bender and adiabatic radiofrequency flipper with p=0.981(7) and e >0.99.
• On POLI, 3He polarizer was used with varying polarization efficiency 0.90> p >0.75,
monitored with time by measuring the3He polarization and adiabatic flipping.
The flipping ratio technique is less sensitive to imperfections of a polarizer, as compared to the experiment with neutron polarization analysis. This is due to the fact that, as seen from Eq. (2) in the main text, the magnetic structure factor is roughly proportional to p and not to the flipping ratio Ri = 11+p−p of the polarizer. So, the systematic errors due to
It is well known that extinction effects might have a crucial influence in the polarized neutron data treatment procedure. Therefore, the Becker-Coppens model was used to treat for the extinction in our refinement. We found that the introduction of extinction corrections had no beneficial effect on the refinement. This is likely due to the very small thickness of the crystallites constituting the sample and the rather short neutron wavelengths, 0.84 -1.4 ˚
A, used in the experiment. The same last argument is also valid for the multiple scattering. Next, absorption can introduce error in the flipping ratios only in combination with strong extinction. In the absence of extinction, the flipping ratios do not depend on the absorption. Since in our measurements the extinction was found equal to zero, the absorption correction is not relevant here.
Moreover we have performed in total 7 different experiments with two sample orientations, using three different wavelengths 0.84, 1.18 and 1.4 ˚A. Hence in each of the experiments the multiple scattering contributions was different. However, the extracted magnetic structures amplitudes were found in agreement within error bars after merging equivalents with the redundancy factor 5.
III. DATA TREATMENT WITH TWO MAGNETIC FIELD ORIENTATIONS
The flipping ratios were measured at a number of Bragg reflections with two different sample orientations with respect to the applied magnetic field: Hk[010] and Hk[¯110]. The magnetic structure factors at common reflections such as (0, 0, l), (2, 0, l) and (2, 2, l) are shown for each orientation in Fig. S2. At large Q, Bragg reflection (4,0,0) was measured only with Hk[010] while (4,2,0) and (4,4,0) only with Hk[¯110].
It is important to notice that the scaling for both orientations is the same and it is consistent to macroscopic SQUID measurements, which show the same saturation magnetic moment for a magnetic field along the two directions. It also supports an isotropic WFM moment, which follows the applied magnetic field8–10. We therefore have combined and
a b
FIG. S2. Measured magnetic structure factors with a magnetic field along (a) Hk[010] and (b) Hk[¯110].
IV. ANALYSIS USING THE MAXIMUM ENTROPY METHOD
We have tested the maximum entropy method (MEM) by changing the initial positive and negative magnetic moments. The resulting positive and negative magnetic moments are limited by the initial values, thus they are starting points for fitting and also serve as upper bounds. The difference between positive and negative moments was set to the net unit cell magnetic moment, 0.64µB/u.c. (8 times 0.08µB/Ir). As seen in Fig. S3a, the agreement
factor defined by Rw = P(|Fobs− Fcalc| /σF) /P(|Fobs|/σF) is poor (≈ 15%) for only a
small negative moment being allowed. It decreases rapidly as the initial negative moment increases, and it is saturated with twice better Rw ≈ 8% for a significant negative moment
above 0.25µB. Initial values larger than 0.3µB, however, do not improve the agreement
factor any more and the resulting negative moment does not follow the initial value either. Instead, the both positive and negative densities spread out so the density distribution is only dispersed while the spatial features are unchanged as shown in Fig. S3d,g. Therefore, we have chosen +0.94µB and−0.30µB as optimized initial positive and negative moments, and
the resulting moments are +0.93µB(+0.116µB/Ir) and−0.29µB(−0.036µB/Ir), respectively.
In the figure 3a and 3b of the manuscript, the WFM density originates predominantly from the xy orbital, at variance with the standard local jeff= 1/2 picture. This effect cannot
be explained by distortion-induced deviations from the naive equal-weight jeff = 1/2 state.
present in the crystal structure11,12. Therefore the j
eff = 1/2 description of the hole state
cannot account for the present findings, even in its most refined version13. We show in Fig.
S4 a schematic illustration of the magnetization for both the local jeff=1/2 model and a
predominant xy orbital for the WFM moment. One also remark that positive density lobes are very strongly elongated, in such a way that some magnetization density is delocalized well beyond of the IrO6 octahedra. This is consistent with the very large spatial extent of
the t2g orbitals (reaching the nearest neighbouring Ir atoms) found by core-to-core RIXS and
ab initio calculation14. It also could give a support to a direct Ir-Ir exchange mechanism,
via electron hopping between the neighboring ions.
V. ANALYSIS USING A MULTIPOLE EXPANSION MODEL
The magnetization density can be modeled by a superposition of spherical harmonic density functions, known as the multipolar expansion15,16:
m(r) = X atoms ∞ X l=0 R2n(r) l X m=−l pl,myl,m(θ, φ), (S3)
where Rn(r) are radial wave functions, yl,m(θ, φ) are angular density functions, and pl,m are
population coefficients. Simple normalized, Slater-type nodeless radial wave functions Rn(r)
are defined as:
Rn(r) =
s
(2ζ)2n+1
(2n)! r
n−1exp(−ζr),
with n = 5 chosen for the 5d-orbitals. The angular density functions yl,m(θ, φ) are the
real-valued spherical harmonic functions:
yl,m(θ, φ) = Nl,mPl|m|(cos θ) cos mφ for m > 0 sin|m|φ for m < 0, where Pm
l are the associated Legendre polynomials and Nl,m are the normalization factors17
satisfying Z |yl,m| dΩ = 1 for l = 0 2 for l > 0.
Note that these angular density functions are distinct from the angular wave functions, Ym l ,
which are complex-valued and have a different normalization condition, R |Ym l |
(g) (b) (d) (f) (c) (e) (a)
FIG. S3. (a) Agreement factor Rw and resulting negative moment per unit cell versus the initial
value for negative moment for the MEM analysis. (b-d) The 3D magnetization density distribution on the z = c/8 layer reconstructed by the MEM analysis with the initial negative moment (b) −0.01, (c) −0.30, and (d) −0.70µB per unit cell. Isosurfaces encompassing 30%, 50% and 70%
of the volume density are plotted with a descending opacity according to their isovalues. Red and blue surfaces denote positive and negative magnetizations, respectively. The solid square and dotted lines denote the unit cell and Ir-O bonds, respectively. (e-g) Sliced density contour maps at (x, y, c/8) for the given initial negative moments. The contour step is 0.04µB/˚A3. The blacks
arrow correspond to the Ir-O bonding directions tilted by 11◦ from the crystallogaphic tetragonal axes.
(b) (a) Direction of in-plane magnetic moment H H xy yz/xz xy yz/xz H H
FIG. S4. (a) Magnetization density distribution for the local jeff=1/2 picture. The xy, yz and
xz magnetic components have the same pseudospin moment (black arrows) at each Ir site. The magnetic moments at adjacent sites are aligned antiferromagnetically, perpendicular to the applied magentic field H, and the canted FM moment (orange arrows) along H appears in both xy and yz/xz components. (b) Magnetization density distribution for the proposed k-dependent jeff=1/2
picture. The magnetic moment in the xy component is aligned along H, while one in the yz/xz component is perfectly antiparallel and perpendicular to H. The WFM moment solely comes from the xy component. become f (Q) = ∞ X l=0 φl(Q) l X m=−l pl,myl,m(θk, φk) with φl(Q) = 4πil Z ∞ 0 R2n(r)jl(Qr)r2dr,
where jlis a spherical Bessel function of order l. Then the least-squares refinement with the
measured FM was done using the mplsq program18. For the refinement, the total magnetic
moment is constrained: µIr+ 2µO1+ 2µO2 = 0.08µB/Ir.
The multipole expansion in general can describe any atomic magnetization or charge density when all l and m values are allowed in the expansion. However, we used a limited number of harmonic functions (d00, d20, d40, d44+) that can describe the d-orbital density
and are allowed by the site symmetry, D4h. There is also a direct relation matrix between
(a)
(b)
FIG. S5. (a) Multipole density functions allowed by 4/mmm symmetry. Red and blue surface denote positive and negative density, respectively. (b) Density distribution of d orbitals constructed by a linear combination of multipole density functions.
the point group D4h (4/mmm) are shown in Fig. S5a. Because the spherical harmonic
functions constitute a complete set in the spherical harmonic point group, the orbital density distribution given by a square of wave function |Ym
l |2 must be a linear combination of
spherical harmonic density functions yl,m16. The orbital-multipole relations for the point
group D4h are defined as pml |Ylm|2 = pi,jyi,j with
p0 2 p±12 p2 2 p−22 = 0.200 1.039 1.396 0.000 0.200 0.520 −0.931 0.000 0.200 −1.039 0.233 1.570 0.200 −1.039 0.233 −1.570 p0,0 p2,0 p4,0 p4,4 .
The d orbital densities reconstructed using the spherical density functions are also shown in Fig. S5b. Using this orbital-multipole relations, the orbital populations were obtained from the fitted density function populations.
In order to describe the large spatial extent of the positive magnetization density, the radial wave function was also examined. It is clear as shown in Fig. S6f that the theoretical radial function with the radial exponent ζ = 3.74 is not fit well (Rw ≈ 22%) with the
(c) (d) (e)
(f) (g) (h)
(a) (b)
FIG. S6. (a) Agreement factor Rw versus the radial exponent ζ for the multipole expansion model
with a single radial exponent. The agreement factor decreases by∼20% at ζ ' 2.7 compared with the theoretical radial exponent ζ0 = 3.74. (b) Agreement factor Rw with two radial exponents
ζ1 and ζ2. Radial wave functions R(r) and radial distribution functions r2R2(r) with (c) the
theoretical radial exponent for isolated Ir atoms, (d) an optimized single radial exponent, and (e) double radial exponents. (f-h) Reconstructed magnetization density distributions with different radial wave functions in (c-e).
found by the MEM analysis. The best value ζ = 2.7 for a single radial exponent was also refined, but the agreement factor was not improved significantly (Rw ≈ 18%) as shown in
Fig. S6a. Therefore, we introduced an additional radial exponent. The radial wave function with two radial exponents provides significantly better agreement (Rw ≈ 9%) with measured
(a) (b)
FIG. S7. Magnetization density distribution obtained by orbital density model fit with (a) all five d orbitals and (b) only three t2g orbitals.
shown in Fig. S6h.
Further, between the positive lobes, negative density lobes occurs as well which are more pronounced in the multipole refinement than in the MEM results (see the Fig. 3 of the main mansucript). They are about 60% of positive ones and surprisingly have dx2−y2 symmetry,
requiring an admixing of the eg orbital to the ground state. Ii is worth to remind that the
MEM method is model-free whereas in the multipole expansion method, we have necessarily to start with certain multipoles corresponding to the d-orbitals. The dx2−y2 contribution
could be overestimated due to insufficient modeling in the multipole description. However, the main result in the MEM - dominant xy and no yz/xz character - is well reproduced by the multipole expansion method. We tried various models (see Fig. S6), and the given result is still the best fit.
In order to examine a possible magnetization density expected from a strong d-p hy-bridization at the oxygen site, the refinements with a spherical magnetization density at
the O1 and O2 sites were also performed, but contrary to expectations, no evidence for the existence of the oxygen moment was found. The agreement factor did not become better and also the refined magnetization density at the O sites is statistically negligible.
We have also examined to fit the data with actual orbital density functions instead of multipole density functions. When all possible 5d orbitals are allowed, it obviously gives the same result (Rw ≈ 9%) with similar population of each orbitals as shown in Fig. S7a.
In addition, as it is known to consist mostly of t2g orbitals, the model fit allowing only
dxy, dyz, dxz orbitals was also performed. As shown in Fig. S7b, the negative magnetic
density with dx2−y2 symmetry disappears as expected, but the agreement becomes twice
worse (Rw ≈ 17%). Therefore, we conclude that the observed magnetic octapolar shape,
mainly from y44+ angular density function, is essential to describe our measured data.
∗ [email protected] † [email protected]
1 F. Ye, S. Chi, B. C. Chakoumakos, J. A. Fernandez-Baca, T. Qi, and G. Cao, Physical Review
B 87, 140406(R) (2013).
2 C. Dhital, T. Hogan, Z. Yamani, C. de la Cruz, X. Chen, S. Khadka, Z. Ren, and S. D. Wilson,
Physical Review B 87, 144405 (2013).
3 N. H. Sung, H. Gretarsson, D. Proepper, J. Porras, M. Le Tacon, A. V. Boris, B. Keimer, and
B. J. Kim, Philosophical Magazine 96, 413 (2016).
4 A. Gukasov, A. Goujon, J.-L. Meuriot, C. Person, G. Exil, and G. Koskas, Physica B: Condensed
Matter 397, 131 (2007).
5 A. Gukasov, S. Rodrigues, J.-L. Meuriot, T. Robillard, A. Sazonov, B. Gillon, A. Laverdunt,
F. Prunes, and F. Coneggo, Physics Procedia 42, 150 (2013).
6 J. Akimitsu, H. Ichikawa, N. Eguchi, T. Miyano, M. Nishi, and K. Kakurai, Journal of the
Physical Society of Japan 70, 3475 (2001).
7 M. Moretti Sala, S. Boseggia, D. F. McMorrow, and G. Monaco, Physical Review Letters 112,
026403 (2014).
8 L. Fruchter, D. Colson, and V. Brouet, Journal of Physics: Condensed Matter 28, 126003
9 M. Nauman, Y. Hong, T. Hussain, M. S. Seo, S. Y. Park, N. Lee, Y. J. Choi, W. Kang, and
Y. Jo, Physical Review B 96, 155102 (2017).
10 J. Porras, J. Bertinshaw, H. Liu, G. Khaliullin, N. H. Sung, J.-W. Kim, S. Francoual, P. Steffens,
G. Deng, M. Moretti Sala, A. Efimenko, A. Said, D. Casa, X. Huang, T. Gog, J. Kim, B. Keimer, and B. J. Kim, Physical Review B 99, 085125 (2019).
11 C. Martins, Couplage Spin-Orbite et Interaction de Coulomb dans l ´Iridate de Strontium
Sr2IrO4, Ph.D. thesis, Ecole Polytechnique, Palaiseau (2010).
12 N. B. Perkins, Y. Sizyuk, and P. W¨olfle, Physical Review B 89, 035143 (2014).
13 J. Bertinshaw, J. Y. Kim, G. Khaliullin, and B. J. Kim, Ann. Rev. of Condens. Matter Phys.
10, 315 (2019).
14 S. Agrestini, C.-Y. Kuo, M. Moretti Sala, Z. Hu, D. Kasinathan, K.-T. Ko, P. Glatzel, M. Rossi,
J.-D. Cafun, K. O. Kvashnina, A. Matsumoto, T. Takayama, H. Takagi, L. H. Tjeng, and M. W. Haverkort, Physical Review B 95, 205123 (2017).
15 N. K. Hansen and P. Coppens, Acta Crystallographica Section A 34, 909 (1978).
16 P. Coppens, X-ray charge densities and chemical bonding, Vol. 4 (International Union of
Crys-tallography, 1997).
17 A. Paturle and P. Coppens, Acta Crystallographica Section A 44, 6 (1988).
18 P. J. Brown and J. C. Matthewman, Rutherford Appleton Laboratory, Rep. RAL–93–009


![FIG. S2. Measured magnetic structure factors with a magnetic field along (a) H k [010] and (b) H k [¯ 110].](https://thumb-eu.123doks.com/thumbv2/123doknet/13193241.392029/20.918.113.784.164.407/fig-s-measured-magnetic-structure-factors-magnetic-field.webp)


