HAL Id: hal-02372340
https://hal.archives-ouvertes.fr/hal-02372340
Submitted on 20 Nov 2019HAL is a multi-disciplinary open access archive for the deposit and dissemination of sci-entific research documents, whether they are pub-lished or not. The documents may come from teaching and research institutions in France or abroad, or from public or private research centers.
L’archive ouverte pluridisciplinaire HAL, est destinée au dépôt et à la diffusion de documents scientifiques de niveau recherche, publiés ou non, émanant des établissements d’enseignement et de recherche français ou étrangers, des laboratoires publics ou privés.
Comparing the reactivity of glasses with their crystalline
equivalents: the case study of plagioclase feldspar
Anne Perez, Damien Daval, Maxime Fournier, Mélanie Vital, Jean-Marc
Delaye, S. Gin
To cite this version:
Anne Perez, Damien Daval, Maxime Fournier, Mélanie Vital, Jean-Marc Delaye, et al.. Comparing the reactivity of glasses with their crystalline equivalents: the case study of plagioclase feldspar. Geochimica et Cosmochimica Acta, Elsevier, 2019, 254, pp.122-141. �10.1016/j.gca.2019.03.030�. �hal-02372340�
1
Comparing the reactivity of glasses with their crystalline
1equivalents: the case study of plagioclase feldspar
23
Anne Perez1,2*, Damien Daval1, Maxime Fournier3, Mélanie Vital4, Jean-Marc Delaye3 4
Stéphane Gin3 5
6
1
LHyGeS, CNRS, Université de Strasbourg, UMR 7517, 1 rue Blessig 67084 Strasbourg, 7
France 8
2
LGE, Université Paris-Est, Laboratoire Géomatériaux et Environnement, (EA 4508), UPEM, 9
77454 Marne-la-Vallée, France 10
3
CEA, DEN, DE2D, SEVT, F - 30207 Bagnols sur Cèze, France 11
4
Departamento de Química, Universidad Nacional de Mar del Plata, 722. Funes 3350, 7600 12
Mar del Plata, Argentina 13
14 15 16
* Corresponding author: anne.perez@u-pem.fr 17
2
Abstract
18
To evaluate the impact of atomic short- and long-range orders on silicate dissolution kinetics, 19
the dissolution of amorphous and crystalline oligoclase was investigated at pH 1.5 and 10 at 20
90°C. Experiments in solution saturated with respect to SiO2 am were additionally performed
21
to constrain the effect of Si-rich surface layer formation on dissolution rates. The face-specific 22
dissolution rates of the crystalline oligoclase and of the oligoclase glass were determined from 23
element budget in solution and surface retreat measured by vertical scanning interferometry. 24
The results show that atomic ordering primarily impacts solid reactivity, irrespective to the 25
pH of the solution. A strong relation between the crystal surface orientation, the evolution of 26
its topography and its dissolution rate was observed. The (001), (010) and (10-1) flat faces 27
containing the strongest bonds dissolved the most slowly and their dissolution rates remained 28
constant throughout the experiments. In contrast, the stepped (1-11) face was characterized by 29
the highest initial dissolution rate, but progressively decreased, suggesting that the preferential 30
dissolution of stepped sites expose afterwards more stable planes. The differences in terms of 31
etch pit density from one surface to another also explained the difference in dissolution rates 32
for the (001) and (010) faces. The fluid chemistry suggested the formation of very thin (100-33
200 nm) Si-rich surface layers in acidic conditions, which weakly affected the dissolution rate 34
of the pristine crystal. At pH 1.5, oligoclase glass dissolves at a rate similar to that of the 35
fastest studied faces of the crystal, suggesting the absence of structural effect on oligoclase 36
dissolution. Whereas Si-rich surface layers likely formed by interfacial dissolution-37
reprecipitation for oligoclase crystal, molecular dynamic calculations suggest that the slightly 38
more open structure of the glass could also allow ion-exchange following water diffusion into 39
the solid. This mechanism could explain why the surface layer of the glass is characterized by 40
a different chemical composition. Results at pH 10 are strikingly different, as the oligoclase 41
glass dissolves up to 50 times faster than its crystalline equivalent. This non-linear response of 42
3 the material upon pH was linked to the density of critical bonds in oligoclase that is indeed 43
pH-dependent. In acidic pH, the preferential dissolution of Al leaves a highly polymerized 44
and relaxed Si-rich surface, whereas in basic pH the preferential dissolution of Si leads to a 45
complete de-structuration of the network because of the lack of Si-O-Al bonds. 46
4
1. Introduction
47 48
Predicting the reactivity of silicates over geological timescales is a fundamental concern 49
in the environmental and Earth science fields. Modeling the long-term chemical weathering of 50
silicate glasses is a particularly challenging issue. Glass alteration studies are essential to 51
assess the environmental impact and insure the safe storage of highly radioactive wastes over 52
the next hundreds of thousands of years (Grambow, 2006; Verney-Carron et al., 2008; 53
Libourel et al., 2011; Vienna et al., 2013; Geisler et al., 2015; Icenhower and Steefel, 2015; 54
Gin et al., 2016). Investigating the dissolution mechanisms and kinetics of silicates is also 55
crucial for geochemical concerns. As an example, the weathering of basaltic glass and silicate 56
rock is extensively studied in the field and in the laboratory to properly assess the chemical 57
mass balance of the oceans and evaluate the potential CO2 sequestration by silicates
58
(Galeczka et al., 2014; Johnson et al., 2014; Sissmann et al., 2014; Parruzot et al., 2015; 59
Ducasse et al., 2018). 60
Numerous experimental studies introducing standardized short-term dissolution tests 61
of silicate glass/minerals dissolution are described in the literature (Wolff-Boenisch et al., 62
2004; Golubev and Pokrovsky, 2006; Hellmann and Tisserand, 2006; Pierce et al., 2008; 63
Arvidson and Lüttge, 2010; Daval et al., 2010; Hellmann et al., 2010; Fenter et al., 2014; 64
Perez et al., 2015). The results of these tests, involving a wide variety of experimental 65
conditions (such as pH, temperature, saturation index, electrolyte background, static/flow rate 66
conditions) are used to provide empirical rate laws that can be implemented into geochemical 67
models in order to estimate the long-term scale of the dissolution processes. However, this 68
long-term reactivity of silicates cannot currently be properly predicted: the systematically 69
observed kinetic laboratory/field discrepancy might be related to the underestimation of the 70
impact of intrinsic properties of the dissolving silicate, poorly constrained compared to the 71
impact of extrinsic parameters such as pH or the saturation state of the fluid (White and 72
5 Brantley, 2003). The progressive evolution of the surface area during the dissolution process 73
and the impact of these physicochemical changes on dissolution rates should be taken into 74
account to develop more realistic dissolution models (Lüttge et al., 2013). Recent studies 75
showing that the structural anisotropy of a mineral induces changes in terms of surface area 76
and reactivity during the dissolution process are nice illustrations of this assertion (Bandstra 77
and Brantley, 2008; Daval et al., 2013; Godinho et al., 2014a, Gruber et al., 2014; Pollet-78
Villard et al., 2016a, b). The demonstration of the impact of various energy surface sites 79
(dislocations, kink and step sites for minerals, differently coordinated Si surface groups for 80
glasses) on dissolution rates is also a good example (Dove et al., 2008; Fischer et al., 2014; 81
Pollet-Villard et al., 2016; Godinho et al., 2014a). Finally, the potential passivating role of 82
amorphous silica-rich surface layers (ASSLs) developed during the weathering process has 83
been shown as crucial for both crystalline and amorphous silicate structures (Casey, 2008; 84
Gin et al., 2015; Hellmann et al., 2015; Gin et al., 2018). The formation of a gel layer on glass 85
samples is most frequently attributed to an ion exchange between alkali and water diffusing 86
through the surface, followed by a self-reorganization of the interdiffusion layer (Cailleteau et 87
al., 2008; Frugier et al., 2008). However, a new mechanism initially built up for silicate 88
minerals, suggesting that crystal surfaces dissolve congruently within a thin interfacial film of 89
water and that an alteration layer forms by precipitation in this water film, has recently been 90
put forward for glasses (Hellmann et al., 2012; Hellmann et al., 2015). Elucidating these 91
mechanisms is currently a priority for both the mineralogical and material science 92
communities, as different formation mechanisms of surface layers should imply distinct 93
physicochemical properties of these layers and different impacts on the long-term dissolution 94
kinetics of silicate materials (Grambow and Müller, 2001; Rébiscoul et al., 2004; Gin et al., 95
2015; Ruiz-Agudo et al., 2016). 96
6 In this context, this work has been undertaken as an attempt to compare the dissolution 97
behavior of both crystalline and amorphous phases and improve the understanding of the 98
impact of the intrinsic structure of a solid on its dissolution. To reach this goal, batch feldspar 99
dissolution experiments were conducted at 90°C, in contact with ultrapure water solutions at 100
very acid or very basic pHs. Such pHs were chosen on the basis of previous studies, in order 101
to favor, or not, the development of surface layers. The oligoclase feldspar and a synthetic 102
amorphous equivalent were submitted to identical experiments in order to highlight the effect 103
of structural order/disorder on the dissolution process. Moreover, for the crystal, 4 crystalline 104
orientations of oligoclase were studied, in order to highlight the impact of structural atomic 105
bonding on the dissolution rates. 106
107
2. Material and Methods
108109
2.1 Materials
110
Centimeter-sized oligoclase crystals were purchased from Mawingu Gems. The chemical 111
composition of the samples (Na0.83K0.02Ca0.07Al1.06Si2.96O8) was determined by ICP-MS 112
analysis after performing an alkali-fusion protocol. 113
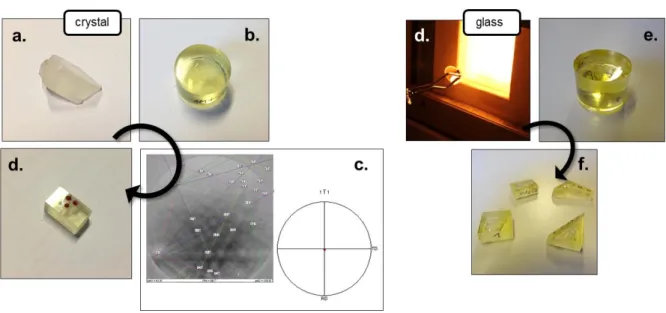
The glass was prepared from the crystalline material. 10 g of crystal were placed in a 114
platinum crucible. Glass preparation took place in a high-temperature furnace Carbolite HTF 115
1700 (Figure 1d). The temperature was increased up to 1500 °C and kept constant for 2 hours 116
to homogenize the melt, then increased again up to 1650 °C to reduce its viscosity. After 2 117
hours at 1650 °C, the bottom of the crucible was poured into water to quench the silicate melt 118
into a glass. The glass was finally annealed overnight at 550°C. 119
The structure of the two materials was analyzed by solid-state nuclear magnetic resonance 120
spectroscopy (NMR) and X-ray diffraction (XRD). Results are displayed in Supplementary 121
7 Data. Briefly, these analyses showed that the glass is amorphous and contains negligible 122
amounts of remaining oligoclase crystallites (< ~ 0.6 wt. %), as revealed by semi-quantitative 123
processing of XRD patterns acquired on mixture of the glass samples with an internal 124
standard of LaB6. In addition, the Si-Al crystal structure is highly ordered (Yang et al., 125 1986). 126 127 2.2 Sample preparation 128
Oligoclase samples were oriented along the , and preferential 129
cleavages or cut following the orientation (Figure 1a). The selection of the four 130
oriented surfaces was made on the basis of the Periodic Bond Chain (PBC) theory (Hartman 131
and Perdok, 1955). The PBC theory states that crystal faces can be sorted out according to the 132
number of uninterrupted chains of energetically strong bonds (PBC) they contain. Faces 133
containing respectively 2, 1 and no PBC are named F- (for flat), S- (for stepped) and K- (for 134
kinked) faces. The structure of feldspars was studied by Woensdregt (1982) according to the 135
PBC theory, who suggested to subdivide the F category between F1 and F2 subcategories, 136
which contain only the strongest PBCs of the structure (only Al–O or Si–O bonds) or also 137
contain weaker K–O or Na–O PBC, respectively. According to Woensdregt (1982), the 138
and planes both belong to the F1 category, belongs to the F2 category and 139
belongs to the S category. Oriented samples were then embedded in epoxy resin such that 140
only the crystallographic face of interest was exposed at the epoxy surface, and polished 141
through a multi-step abrasive sequence (Figure 1b). The crystallographic orientations were 142
checked using Electron Backscatter Diffraction (EBSD) on a Tescan Vega 2 scanning 143
electron microscope (SEM) (Figure 1c). The oriented samples were divided into small pieces 144
and portions of their surfaces were protected with ~ 1 mm-diameter room-temperature-145
vulcanizing (RTV) glue spots. 146
8 The piece of oligoclase glass was cut into several pieces. These pieces were embedded 147
in epoxy resin, polished through a multi-step sequence with an ultimate polishing step in a 148
colloidal suspension (Figure 1e) and masked with glue spots (Figure 1f). The geometric 149
surface of each embedded sample was estimated after measurements carried out on binocular 150
photographs of the samples. 151
The initial roughness of each sample surface was measured with a vertical scanning 152
interferometer (VSI, ZYGO NewView 7300). For all samples, the initial average arithmetic 153
roughness (Ra), defined as the arithmetic average of the absolute values of the roughness
154
profile, ranged between 10 nm and 40 nm, and were measured on 180 × 180 µm² VSI images, 155
corresponding to the field of view imaged at the maximum magnification. The geometric 156
surface of each sample was calculated from the dimensions of the monoliths and ignoring the 157 surface roughness. 158 159 2.3 Dissolution experiments 160
Oligoclase samples were introduced into 120 mL PFA Savillex® reactors 161
continuously stirred with magnetic bars placed over PTFE tripods. The reactors were filled 162
with 80 mL of solution and incubated at 90°C. 163
Each studied sample was immersed either in pH 1.5 or pH 10 solutions (the given pH 164
values corresponds to the pH of the solution at 90°C), whose saturation indices with respect to 165
amorphous silica (SiO2 am) were equal to 0 or ~1. These solutions were prepared from
166
ultrapure water (18.2 MΩ·cm). High-grade HCl (37%, ACS reagent) and LiOH (Prolabo) 167
were used to adjust the pH. The solutions saturated with respect to SiO2 am at 90 °Cwere
168
prepared by dissolving 0.36 g and 5.11 g of SiO2 am (Merck Silicagel 60) in 1L of ultrapure
169
water for experiments conducted at pH 1.5 and 10, respectively. 170
171 172
9
2.4 Analyses
173
Our experimental strategy enabled us to obtain face-resolved fluid data with 174
Inductively Coupled Plasma Atomic Emission Spectroscopy (ICP-AES) and to deduce the 175
face-specific dissolution rate at the boundary between the surface layer and non-altered solid, 176
which is referred below to as the “internal interface” (see Wild et al. (2016) for details). 177
Conversely, the opposite boundary of the surface layer, located at the interface with the bulk 178
solution is referred hereafter to as the “external interface”. Our study benefited from the use 179
of VSI to determine dissolution rates at this external interface. 180
181
2.4.1 Solution analyses by ICP-AES
182
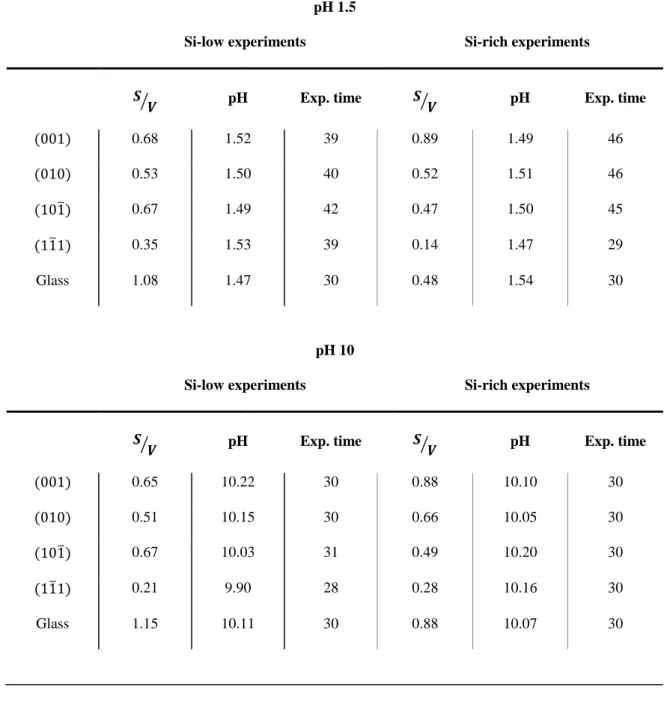
Experiment durations ranged between 28 and 46 days, depending on the experimental 183
conditions (pH, monoliths/powders, crystal/glass). Solution sampling was regularly carried 184
out for the analyses of Si, Al and Na using ICP-AES (Thermo ICAP 6000). pH was also 185
checked at each sampling time and adjusted by small additions of LiOH or HCl if necessary. 186
For each element i, the normalized mass loss NLi (mg/m2) from the mineral/glass into 187
the solution was calculated at each sampling time using the following Eq. (1): 188
(1)
189
where [i] is the concentration (mg/m3) of the element i in solution, S the surface area of the 190
material in contact with the fluid (m2), V the volume of solution (m3) and xi the mass 191
percentage of the element i in the solid. The variations of V due to sampling and evaporation 192
were measured by weighing the reactors before and after sampling and taken into account in 193
the calculation, whereas S was considered as the initial geometric surface area of the sample. 194
The equivalent thickness (or leaching depth) of the altered mineral/glass Ethi (nm) was 195
then calculated based on each elemental release following Eq. (2): 196
10 (2)
198
where ρ is the density of the mineral (2.62 g/cm3) or the glass (2.34 g/cm3). 199
A summary of the experimental parameters used in all experiments is given in Table 1. 200
The theoretical thickness of amorphous Si-rich surface layers (ASSLs) developed on 201
each mineral surface was estimated on the basis of Na concentrations. A congruent reaction is 202
characterized by a stoichiometric release of Si, which is theoretically 2.96 times greater than 203
that of the measured Na concentrations. As a consequence, the difference between the 204
theoretical and measured Si concentrations, when negative, was attributed to the incorporation 205
of Si into a SiO2 am surface layer, whose thickness eASSL (nm) was estimated at the end of each 206
experiment according to Eq. (3): 207 (3) 208
where ∆mSi stands for the difference between the theoretical and measured mass of dissolved
209
SiO2 in solution (g), ρSiO2 is the density of ASSL approximated to that of SiO2 am (2.2 g/cm3)
210
and Sgeo is the geometric surface area (cm2) of the sample exposed to the fluid.
211 212
2.4.2 Surface topography measurements with VSI
213
At each sampling time, the sample was removed from the solution. The RTV mask 214
was pulled off and the sample topography was measured with VSI in stitching mode 215
(magnification: ×5) to evaluate average changes in height between the unreacted reference 216
surface and the reacted mineral surface (Figure 2). Surface imaging was also performed at 217
higher magnification (×100) in order to follow the nucleation of etch pits. The data were 218
analyzed with the Metropro software. 219
After each VSI analysis, a new RTV glue spot was cautiously placed on the non-220
dissolved area of the surface. After 24 hours (required for the glue to be completely dried), the 221
11 sample was rinsed in ultrapure water and re-immersed for five more days. This procedure was 222
repeated until the experiment was completed. It was previously shown that the drying-wetting 223
cycles to which the samples were submitted following this protocol do not impact the 224
dissolution rate of the dissolving phase (Pollet-Villard et al., 2016a). As shown below, the 225
observed linear increase of the mean surface retreat with time for most samples supports this 226
assertion for oligoclase dissolution. 227
228
2.4.3 Calculation of dissolution rates
229
Equivalent thickness calculations and surface retreat measurements allowed for the 230
determination of dissolution rates at the internal (Rint) and external (Rext) interfaces (mol/m2/s)
231
following Eq. (4) (e.g., Smith et al., 2013). Because the release of Si and Al in the fluid is the 232
result of several processes such as the formation/dissolution of the ASSL concomitantly to the 233
dissolution of the pristine mineral, Na was chosen as a tracer specific to the dissolution at the 234 internal interface. 235 (4) 236
where ∆Eth(Na) is the variation of equivalent thickness (m) based on Na release in solution, 237
∆h is the average height difference (m) between the reacted and the non-reacted surface, ∆t is
238
the experiment time (s) and Vm is the molar volume of oligoclase mineral/glass, which is
239
equal to 1.0×10⁻⁴ and 1.1×10⁻⁴ m3/mol, respectively. 240
Uncertainties on cation concentrations were considered as 10% of the analytical data 241
values and are represented on the corresponding plots as error bars. 242
243 244 245
12
2.5 Molecular dynamics calculations
246
To better understand the discrepancies between the glass and crystal reactivities (i.e., 247
dependence of the dissolution rate on pH and on the formation of ASSLs), molecular 248
dynamics (MD) calculations were performed, aimed at providing quantitative constraints on 249
the structure of the two solids. 250
251
2.5.1. Computational details
252
Classical molecular dynamics force fields as detailed in Deng and Du (2016) were 253
used to simulate vitreous and crystalline albite (whose composition is close to the oligoclase 254
used in the present study: 74.4 mol% SiO2 – 12.7 mol% Na2O – 12.9 mol% Al2O3) systems.
255
Buckingham type potentials were used: 256 (5) 257
where rij refers to the distance between the atoms i and j, and qi and qj refer to their atomic
258
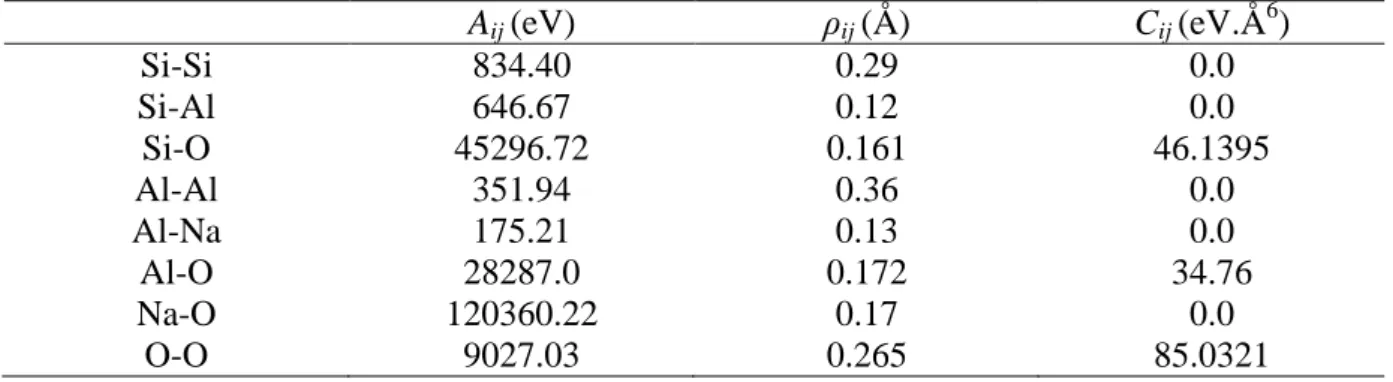
charge. The adjustable parameters (Aij, ρij and Cij) are given in Table 2. The charges are
259
respectively equal to 1.89, 1.4175, 0.4725 and –0.945 for the Si, Al, Na and O species. 260
The Coulombic interactions were treated with the complete Ewald summation with a 261
precision of 10-5 and the cutoff radius for the pair terms was equal to 10Å. 262
A simulation box containing 10,000 atoms has been prepared. It has been shown 263
recently that 10,000 atoms are largely sufficient to represent the short and medium – range 264
orders in silicate glasses (Deng and Du, 2018; Tilocca, 2013). The glass was prepared using 265
the following method: A liquid was first equilibrated at 4,000K during 100,000 time steps. 266
After this, a first quench was applied at 1.1012 K/s until 3,000K in the NVT ensemble 267
(constant number of atoms (N), constant volume (V) and constant temperature (T)). 268
Practically, a stepwise decrease of the temperature was applied in several 20,000 time step 269
stages with a temperature difference (ΔT) equal to 20K between two successive stages. A 270
13 second quench was applied at 1011K/s between 3,000K and 300K. For this second quench, 271
each stage lasted 200,000 time steps and the ΔT was equal to 20K. A 100,000 time step final 272
equilibration was applied at 300K in the NVE ensemble (constant number of atoms (N), 273
constant volume (V) and constant energy (E)) to accumulate 21 intermediate configurations 274
(separated each by 5,000 time steps). The structural analysis described in this article 275
corresponds to averages performed on these 21 configurations. The time step was equal to 1 fs 276
for all stages of the glass preparation. A density of 2.38 g/cm3 was imposed during the glass 277
preparation, and the pressure was fixed at 1 atm. 278
Using the same interatomic potentials, the structure of crystalline albite was also 279
simulated. The crystalline structure was considered as initial configuration and a 10,000-time 280
step relaxation was applied to release the local stresses. 281
282
2.5.2. Interstitial site distributions
283
As in Malavasi et al. (2006), Kerrache et al. (2014) and Mansas et al. (2017), the 284
interstitial site distributions were calculated for the glass and crystalline systems. The 285
interstitial site distributions were calculated using a code provided by Pedone et al., 2006. 286
This code identifies all the Delaunay tetrahedra present in a structure and calculates the free 287
volumes inside each of them. Briefly, Delaunay’s tessellation consists in paving the total 288
space by tetraedra formed by four adjacent atoms. An interstitial site is associated to each 289
Delaunay tetrahedron. The volume of an interstitial site, V free, is determined by subtracting
290
the volume occupied by the four atoms to the volume of the tetrahedron. Then,
V
free is 291converted into an equivalent radius req:
292
(7)
293
The atomic radii considered were equal to 0.41 Å, 1.10 Å, 0.50 Å, and 0.95 Å for Si, O, Al, 294
and Na atoms respectively. The Si radius corresponds to the values proposed by Shannon et 295
14 al. (1969) or Pauling (1947). The O radius corresponds to half the distance between O atoms 296
in O2 molecule. This value was chosen to guarantee that the sum of the radii of two
297
neighboring atoms remains lower than the distance between them. For the same reason, the Al 298
radius was slightly reduced to 0.50 Å (instead of 0.53Å for the Pauling radius) to guarantee 299
that each Al-O distance remains larger than the sum of their radii. 300
301
3. Results
302303
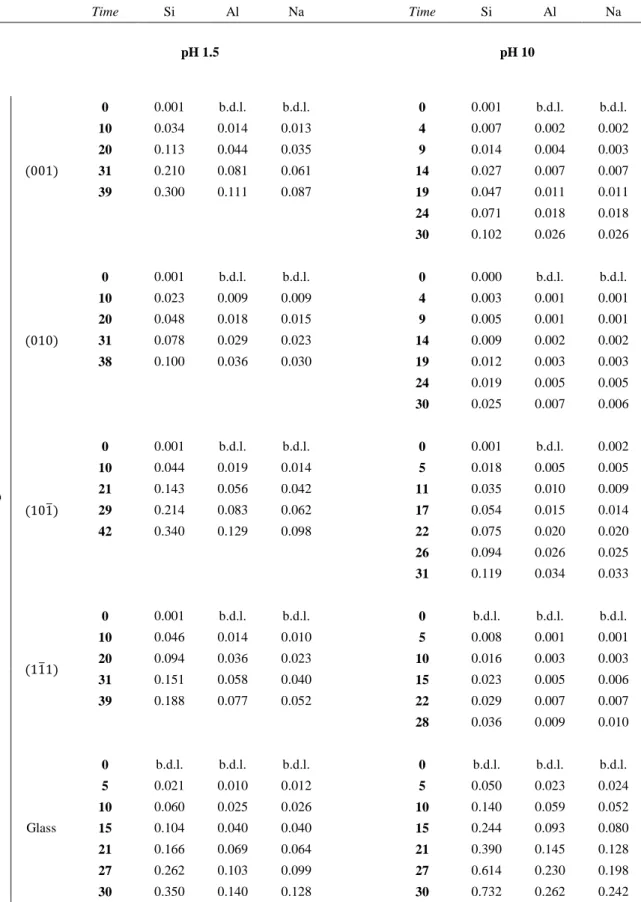
The elemental concentrations measured in the reactors along all dissolution experiments 304
are reported in Table 3. 305
The CHESS code (van der Lee and De Windt, 2002) was used to determine the 306
saturation indices with respect to oligoclase and secondary phases. The thermodynamic 307
database used was Chess (http://chess.ensmp.fr), which is derived from the Lawrence 308
Livermore National Laboratories EQ3/6 database (version 8; release 6). All solutions at pH 309
1.5 (Si-rich and low concentration) and at pH 10 (Si-low concentration) were undersaturated 310
with respect to oligoclase and secondary products. Experiments at pH 10 in Si-rich solutions 311
were given saturated with respect to petalite and spodumene, which are two Li-rich 312
aluminosilicates. Such minerals were not observed in our systems, as they are unlikely to be 313
formed via an aqueous synthesis at low temperature (as an example, Li et al. (2013) showed 314
that temperature as high as 570 °C was required for the crystallization of spodumene from 315
aqueous solutions). 316
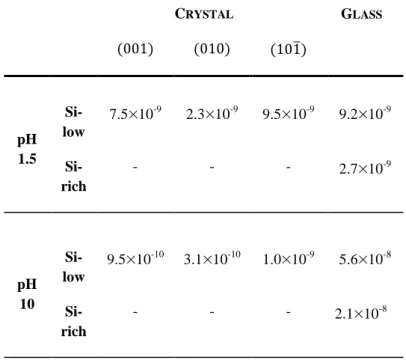
Surface retreat measurements and normalized mass losses (Si, Al, Na) are depicted in 317
Figures 3 to 10 for all crystalline and amorphous samples, and the associated dissolution rates 318
are listed in Tables 4 and 5. 319
15 Because of the multiplicity of experimental parameters investigated in this study, the 320
results are organized below considering the pH of the solutions as the primary parameter, and 321
the saturation index with respect to amorphous SiO2 as the secondary parameter. The results
322
regarding the glass sample are systematically described in comparison to those obtained on 323
the four oriented surfaces of the crystal. 324
325
3.1. Oligoclase dissolution at pH 1.5
326 327
3.1.1. Experiments conducted in Si-low solutions
328
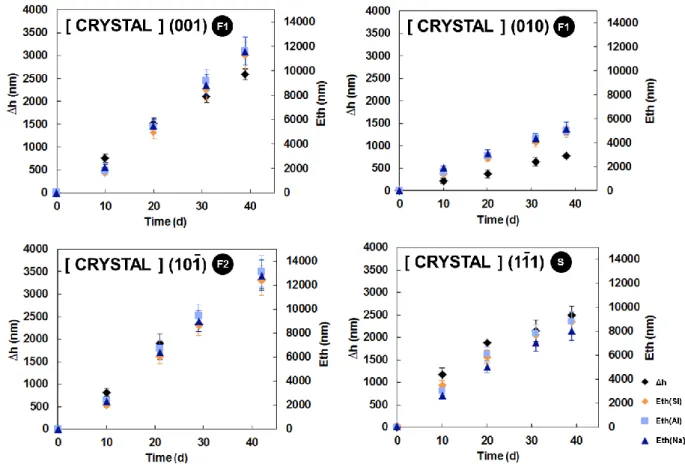
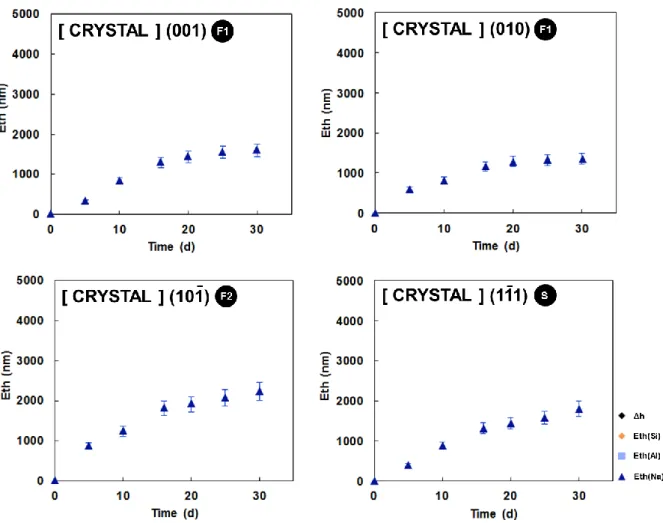
The temporal evolution of surface retreat and corresponding altered thickness are 329
depicted in Figure 3 for Si-low experiments conducted at pH 1.5 on the four oriented surfaces 330
of the oligoclase crystal. Overall, the dissolution rates reported in Table 4 bracket the 331
dissolution rates that can be calculated based on the oligoclase dissolution rate parameters 332
provided by Palandri and Kharaka (2004) at acidic pH conditions (4.8×10⁻⁹ mol/m²/s). 333
The retreat of the selected flat (F1, F2) faces appears to increase linearly with time. In 334
contrast, the stepped (S) face exhibits a non-linear surface retreat with time. From day 335
0 to 20, the dissolution of the stepped face at the external interface is characterized by the 336
highest dissolution rate among all the studied faces. However, after 10 days, the reactivity of 337
the surface gradually decreases down to a dissolution rate equivalent to those calculated for 338
the slower flat faces (<1.0×10⁻⁸ mol/m2/s, see Table 4). Surface retreat data also show the 339
surprisingly high reactivity of the F1 face, expected to be one of the slowest dissolving 340
face according to the PBC theory. The surface appears to dissolve 3 times faster than 341
the other selected F1 face (Table 4), at a rate equivalent to the one calculated for the F2 342
face. 343
16 These discrepancies are also evidenced in the fluid data (Eth data plotted in Figure 3 344
and dissolution rates at the internal interface given in Table 5), which are characterized by the 345
same trends. 346
The dissolution of the 4 faces appears to be congruent within uncertainties: the 347
normalized concentrations are virtually superimposed for all datasets (Figure 3). 348
These results obtained for the crystal can be compared to those obtained by dissolving 349
the glass in identical experimental conditions (Si-low solution at pH 1.5 and 90°C; Figure 4). 350
Here again, the surface retreat and Eth values increase linearly with time. Both VSI and fluid 351
data suggest that the glass dissolves at a rate intermediate to that of the fastest and slowest flat 352
faces of the crystal (see Tables 4 and 5). The glass dissolution is incongruent: the and
353
ratios in solution are ~ 1.5 times higher than the ratios calculated according to the 354
composition of the glass. Finally, a systematic difference between the Eth and ∆h values is 355
evidenced for each crystallographic orientation, as well as for the glass sample. This 356
observation is further discussed in section 4.1. 357
358
3.1.2. Experiments conducted in solutions saturated with respect to SiO2am
359
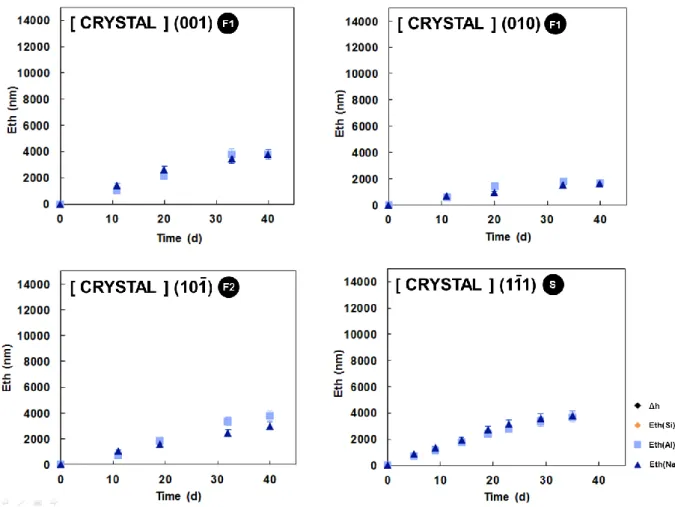
In the experiments conducted on crystalline samples at pH 1.5 in solutions saturated 360
with respect to SiO2 am, the surface retreat is below the vertical detection limit of VSI (~ 3
361
nm). Moreover, in such solutions characterized by high concentrations of Si, slight variations 362
in Si concentrations resulting from oligoclase dissolution could not be properly quantified. As 363
a consequence, only the evolution of the normalized concentrations of Al and Na with time is 364
plotted in Figure 5, for the four selected orientations of the crystal. 365
The Eth values globally follow a linear trend with time, for all the selected faces. The 366
trends might be slightly curved in these experimental conditions compare to experiments 367
carried out in Si-low systems. The release of Na and Al is congruent, within uncertainties, and 368
17 the calculated dissolution rates at the internal interface range between 4.0×10⁻⁹ and 9.0×10⁻⁹ 369
mol/m2/s (Table 5). As observed in Si-low solutions, the face is characterized by the 370
slowest dissolution rate (Table 5). 371
These face-specific results can be compared to those obtained for the glass in the same 372
experimental conditions and are depicted in Figure 6. 373
The reported surface retreat data enable the calculation of a dissolution rate at the external 374
interface of the glass sample in saturated conditions. External and internal dissolution rates 375
are ~ 4 times lower than those determined for the glass in Si-low solution (Figure 6, Table 5). 376
The glass dissolution is incongruent: as observed in Si-low experiments, Na is released 1.5 377
times faster than Al. 378
379
3.2. Oligoclase dissolution at pH 10
380 381
3.2.1. Experiments conducted in Si-low solutions
382
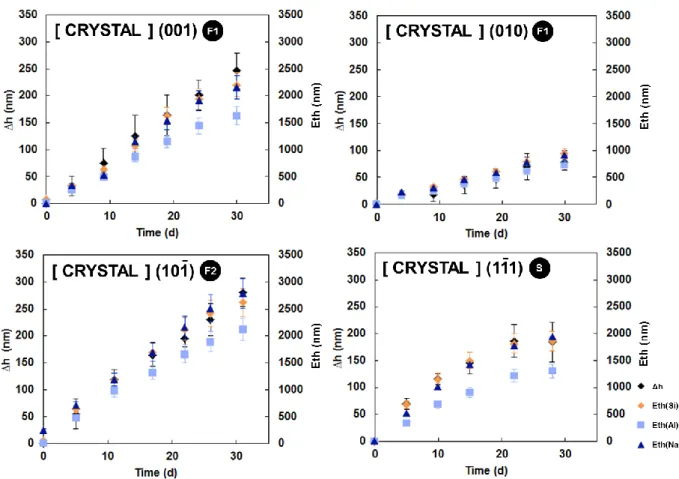
The temporal evolution of the surface retreat and normalized Si, Na and Al 383
concentrations in the fluid are shown in Figure 7 for the 4 selected faces of the crystal at pH 384
10 and 90°C. In a general manner, surface retreats and Eth values follow the trends depicted 385
at pH 1.5 (Figures 3). The data suggest that the internal and external dissolution rates of the 386
, , flat surfaces are constant, whereas the dissolution of the stepped 387
surface is characterized by a decrease in both external and internal dissolution rates with time. 388
The F1 surface dissolves at external and internal rates equivalent to those calculated for 389
the F2 face (~ 1.0×10⁻⁹ mol/m2/s and ~ 8.0×10⁻⁹, respectively), whereas the F1 390
face is the slowest dissolving face, with dissolution rates at the external and internal interfaces 391
3 times lower than those obtained for the F1 face. 392
The oligoclase crystal dissolves more slowly at pH 10 than at pH 1.5. The calculated 393
dissolution rates at the external and internal interfaces are almost 10 times lower than those 394
18 determined at pH 1.5 (Tables 4 & 5). Moreover, the
ratio in solution is stoichiometric. In
395
this case, no Si-rich surface layer is suspected to form. 396
These results obtained for the crystal can be compared to those obtained by dissolving 397
the glass in identical experimental conditions (Si-low solution at pH 10 and 90°C). They 398
reveal a drastic change (Figure 8). According to both surface retreat and Eth values, the glass 399
dissolution rate is 10 to 20 times (depending on the considered oriented surface) greater than 400
its crystalline equivalent. 401
The surface retreat data and Eth values follow a linear evolution with time. The 402
dissolution of the glass is congruent throughout the experiment. 403
As a final observation, systematic differences between the Eth and ∆h values are 404
evidenced for each crystallographic orientation, as well as for the glass sample, similarly to 405
the results obtained at pH 1.5 in Si-low solutions. This observation is further discussed in 406
section 4.1. 407
408
3.2.2. Experiments conducted in solutions saturated with respect to SiO2am
409
As observed for experiments carried out at pH 1.5, no surface retreat was detected on 410
samples dissolved at pH 10 in solutions saturated with respect to SiO2 am. As a consequence,
411
only the evolution of the normalized concentrations of Al and Na with time in such Si-rich 412
solutions is shown in Figure 9, for the four selected orientations of the crystal. 413
These results show that Al concentrations are below the detection limit of the ICP-414
AES, in all experiments. Na is the only detected element. A progressive decrease in Na 415
release rates is observed with time. While the solution is undersaturated with respect to any 416
phases that may be prone to precipitate at high temperature, such as aluminum 417
(oxy)hydroxides or phyllosilicates, the collected aqueous samples are oversaturated with 418
respect to boehmite and pyrophillite at ambient temperature, if one supposes a congruent 419
19 release of Al and Na. As suggested in previous studies (e.g., Verlaguet and Brunet, 2007), the 420
lack of Al may therefore be related to the quench phase of the experiment, when the 421
temperature is decreased from 90 °C (where Al is soluble) to room temperature (where Al is 422
no longer soluble). 423
As a comparison, dissolution measured at the internal and external interfaces are 424
plotted in Figure 10 for the glass sample. The evolution of surface retreats and Eth values with 425
time exhibit a curved shape. Here again, the glass appears to dissolve much faster than the 426
crystalline oligoclase at both external and internal interfaces (from 10 to 20 times faster, 427
depending on the considered crystallographic orientation, see Tables 4 & 5). In addition, the 428
Al and Na cations are not released congruently. 429
430
4. Discussion
431432
4.1. Apparent inconsistencies between VSI and fluid data
433
Strikingly, the dissolution rate calculated based on cation release is systematically 434
greater than that calculated using VSI data, by a ~1.3 to ~7 fold-factor (see Figures 3, 4, 7, 8). 435
Several explanations may account for this observation: first of all, the surface retreat was 436
calculated based on VSI data purposely acquired in the direct vicinity of the mask (see Figure 437
2), which was roughly centered on the surface of the considered crystal face. As emphasized 438
in previous studies (e.g., Saldi et al., 2017), such measurements miss the contribution of edge 439
and corner dissolution, where the density of steps and kinks dramatically increases compared 440
to the flat surface of a crystallographic plane (note that as reported in Robin et al. (2018), the 441
difference of hardness between the sample and the epoxy resin results in crystals being 442
slightly above the level of the resin after polishing, so that their edges and corners may still 443
contribute to the dissolution). While edges and corners participate in the total flux of 444
20 dissolved matter, including their contribution in the present analysis is poorly relevant to 445
discuss the dissolution anisotropy of oligoclase, as their respective contribution depends on 446
the ratio of the total edge length to the flat surface area, which is not an intrinsic feature of 447
oligoclase, but a specific aspect of the geometry and dimensions of the crystals selected to 448
conduct the experiments. For this reason, the discussion of dissolution anisotropy detailed in 449
the subsequent section 4.2 is based on the dissolution rates calculated from VSI data, rather 450
than those calculated from the fluid data. 451
More generally, several studies emphasized that the dissolution rate of minerals is 452
heterogeneous, and is dramatically impacted by defects and/or discontinuities such as 453
polishing scratches, twinings and grain boundaries (e.g., Burch et al., 1993; Emmanuel and 454
Levenson, 2015; Fischer et al., 2015; Fischer and Luttge, 2017). Beyond the mean surface 455
retreat reported in the present study, specific hotspots of reactivity may be highlighted using 456
the “rate spectra” concept (Fischer et al., 2012). An illustration of this assertion for the (010) 457
face is reported in Figure 11a. Whereas the dissolution rate of the overall surface is 458
reasonably well explained by a single mode in locations devoid of polishing scratches, their 459
contribution to oligoclase dissolution is responsible for the appearance of a second mode with 460
greater reactivity (Figure 11b). The consideration of the whole surface of the crystal (i.e., 461
including polishing scratches) almost doubles the mean dissolution rate of the (010) face 462
dissolved at pH 1.5, partly filling the gap between the fluid and VSI data. Finally, the 463
progressive development of internal porosity such as microchannels and microtubules (e.g., 464
Fisk et et al., 1998, Fisk et al., 2013), impossible to probe with surface-sensitive techniques, 465
may also contribute to the difference between VSI-derived and ICP-AES-derived rate data. 466
Overall, the apparent inconsistencies between VSI and fluid data may be attributed to 467
the dissolution of crystal edges and corners, as well as polishing scratches, which we 468
21 purposely ignored in the treatment of our data to better capture the intrinsic dissolution of a 469
crystallographic plane in a considered direction. These results are discussed below. 470
471
4.2. Dissolution anisotropy
472
The results obtained for the crystal at both pHs strongly suggest that atomic ordering 473
primarily impacts solid reactivity. First of all, the shape of the Δh(t) and Eth(t) relations varies 474
depending on crystallographic orientation. The face-specific dissolution experiments are 475
characterized by a linear increase of surface retreat/equivalent thickness with time for the 476
, , flat faces. In contrast, the dissolution of the stepped face exhibits 477
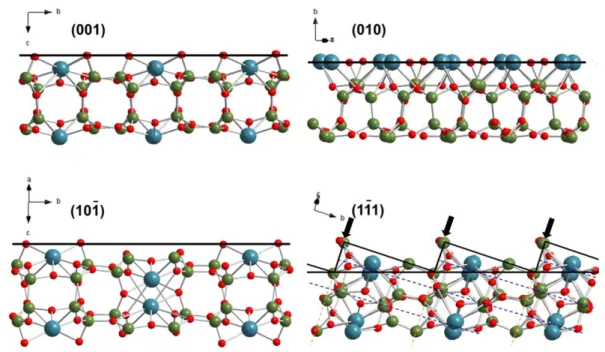
a parabolic trend. 478
On a crystal surface, steps are formed by the interception of two stable planes (Figure 479
12). The atoms located at the steps have a lower coordination number. As a consequence, they 480
represent high energy sites on a mineral surface and are potentially more likely to be released 481
in solution. As dissolution progresses, the density of steps should decrease, exposing larger 482
areas of more stable planes, characterized by a lower surface energy. Such observations have 483
been made in several studies on the dissolution of fluorite (Godinho et al., 2013; Godinho et 484
al., 2014a; Godinho et al., 2014b; Maldonado et al., 2013) and calcite (Smith et al., 2013). 485
This scenario is consistent with the obtained results for oligoclase crystal, which show an 486
initially fast dissolution period characterized by the highest dissolution rate among all the 487
studied faces (e.g., 1.5 × 10⁻⁹ mol/m2/s at pH 10), followed by a dissolution at a rate 488
equivalent to those calculated for the flat faces (7.3 × 10⁻¹⁰ mol/m2/s at pH 10). This suggests 489
that (i) the evolution of the surface topography of a stepped face may control its long-term 490
dissolution rate and (ii) the most stable surfaces of oligoclase, which dissolve slower, tend to 491
persist during the dissolution process. 492
22 Secondly, the differences in the face-specific dissolution rates can in part be explained 493
in terms of the crystallographic bonding structure. Our measurements verify that the face 494
reactivity is correlated with the strength of the bonds they contain, as expected from the PBC 495
theory. The and surfaces, containing the strongest bonds (Si-O and Al-O only), 496
are the less reactive surfaces among the selected faces of oligoclase. The low reactivity of the 497
and/or faces was previously evidenced by Zhang and Lüttge (2009) and Pollet-498
Villard et al. (2016a). The face, containing weaker bonds (Si-O, Al-O but also Na-O), 499
appears to dissolve faster than the two F1 faces. Finally, during the first stages of experiments 500
(about 10-20 days), the stepped face is the fastest dissolving face. 501
If one admits that, as predicted by the PBC theory, the initial reactivity of the selected 502
faces decreases following the order S > F2 > F1, then the F1 face dissolves 503
anomalously faster than the F1 face. This divergence between the reactivity of the 504
and faces is also reflected by the microstructure of the different surfaces 505
revealed at pH 10: The flat surface is characterized by a high density of etch pits, 506
contrasting with the flat surface, on which the pit density is much lower (Figure 13). 507
Mineral dissolution has been shown to be strongly linked to the formation of etch pits
508
(Pollet-Villard et al., 2016a; Pollet-Villard et al., 2016b; Arvidson et al., 2003; Beig and 509
Luttge, 2006; Lasaga and Luttge, 2001; Kurganskaya and Lüttge, 2013). In their “dissolution 510
stepwave model”, Lasaga and Lüttge (2001) underlined that etch pits contribute to the total 511
dissolution rate not only by locally enhancing the dissolution of the surface, but also by the 512
generation of “stepwaves” emanating from the nucleated pits. These stepwaves would lead to 513
a global retreat of the crystal surface by dissolving the material layer by layer. In our case, the 514
correlation between the density of etch pits and the retreat rate could explain the difference in 515
terms of reactivity between the two F1 faces and, in the same time, strengthen the hypothesis 516
that pit nucleation is a major driver of oligoclase crystal dissolution. 517
23 An explanation for these discrepancies in terms of pit density may rely on the 518
anisotropic distribution of dislocations in the oligoclase structure. In minerals, dislocations are 519
characterized by their Burgers vectors, which represent the magnitude and direction of the 520
distortion resulting from a dislocation in a crystal lattice. Dislocations oriented following the 521
Burgers vectors with the shortest length are generally favored, due to energetics reasons. In 522
the case of feldspars, dislocations following the direction are particularly abundant 523
(Tullis, 1983), which is in strong agreement with our observations: while screw dislocations 524
with [001] Burgers vectors may outcrop at the (001) surface, they do not outcrop at the (010) 525
surface, possibly accounting for the observed different pit density between these two faces. 526
Another interesting result is that the surface retreat of these two flat faces evolves 527
linearly with time (Figure 3 & 7), whereas etch pits continuously nucleate on their surface, 528
generating pit walls, which represent additional surface area exposed to the fluid. Moreover, 529
considering that the and faces are among the least reactive faces of the crystal, 530
the generated facets would be expected to be as/more reactive as/than the face on which the 531
pits nucleate, according to the PBC theory. For all these reasons, one could expect an increase 532
in dissolution rates of these 2 flat faces with time. Pollet-Villard et al. (2016b), who also 533
measured constant dissolution rates for F faces of a K-feldspar, observed and demonstrated 534
that the exposure to the solution of pit walls with a reactivity greater than that of the face on 535
which they nucleate, was responsible for an initial increase of the dissolution rate, which 536
eventually reaches a steady-state after a short transient period. As a consequence, the initial 537
increase of the dissolution rate was out of reach of their measurements conducted on longer 538
durations. A similar explanation may be proposed in the present study. This result contrasts 539
with our observations for the S face, which offers much more initial reactive sites: in this 540
case, the evolution of the topography of the surface has a clear impact on the dissolution rates 541
after a few days of experiment. 542
24
4.3. Formation and impact of ASSLs
543
4.3.1 Formation of surface layers inferred from fluid and SEM data
544
Amorphous layers of variable thicknesses are generally found to cover the surface of 545
altered silicate minerals/glasses. In the present study, the direct observation of such layers on 546
crystalline samples reacted in Si-low solution was out of reach of the analytical techniques we 547
used (SEM). In contrast, the formation of Si-rich layers was confirmed for all (crystalline and 548
amorphous) samples reacted in Si-rich solutions at pH 1.5, as revealed by EDX analyses, 549
where the Al/Si ratio of the surface of reacted samples was systematically lower than that of 550
the pristine samples (see Supplementary Data). 551
Whereas no Si-rich layers were suspected to form on crystalline samples reacted at pH 552
10 (see section 3.2), the slight but systematic lack of Si released in the fluid for pH 1.5 553
experiments may be attributed to the formation of thin Si-rich layers, since the solutions were 554
not supersaturated with respect to any secondary Si-bearing solid neither at high, nor at 555
ambient temperature in these experiments. The calculated thickness of these layers ranges 556
from ~0 to 200 nm after 30 days of experiments (Table 6), in good agreement with the results 557
reported by Hellmann (1995) for albite under similar conditions. 558
Similarly, the formation of altered layers on glass surface was inferred from the fluid 559
data at pH 1.5. However, because the aqueous Al/Na ratio was not stoichiometric, the ASSLs 560
do not have the chemical composition of pure SiO2(am). Consequently, it cannot be
561
considered that the density of these ASSLs corresponds to that of SiO2(am), and their
562
thicknesses could not be calculated using Eq. (3). 563
4.3.2 Impact of ASSL on oligoclase dissolution rate
564
Recent studies underlined the potential effect of surface layers on the dissolution rates, but 565
some divergences remain with respect to the formation mechanisms of these layers and the 566
impact of surface layer formation on the dissolution rates of silicate minerals (Oelkers, 2001; 567
25 Hellmann et al., 2003; Daval et al., 2009a; Daval et al., 2009b; Daval et al., 2013; Saldi et al., 568
2013; Saldi et al., 2015; Maher et al., 2016; Wild et al., 2016) and glasses (Cailleteau et al., 569
2008; Geisler et al., 2010; Verney-Carron et al., 2011; Geisler et al., 2015; Gin et al., 2015; 570
Hellmann et al., 2015; Collin et al., 2018a; Collin et al., 2018b; Gin et al., 2018). In particular, 571
the part of the interfacial zone between the surface of the silicate and the fluid (internal or 572
external interface) that controls the dissolution reaction has long been debated (Zhu et al., 573
2006). Two theories can be put forward: (a) the dissolution process is driven by the 574
thermodynamic properties of a leached layer, defining the chemical affinity with respect to 575
the ASSL (external interface) or (b) an ASSL is formed by an interfacial 576
dissolution/precipitation process and, when the layer is not passivating, the fluid can access 577
the pristine surface of the silicate (internal interface), where the rate-limiting reactions may 578
take place. 579
At pH 1.5, several lines of evidence suggest that the ASSL formed on the crystalline 580
oligoclase are non-passivating: 581
(i) If the layers were passivating, one could have expected that the dissolution rate of a 582
given face would correspond to the dissolution rate of the ASSL. The clear dissolution 583
anisotropy rules out this assertion, suggesting that oligoclase dissolution is not controlled by a 584
same unique surface layer. Therefore, the rate-limiting reactions are located at the internal 585
ASSL/pristine solid interface, suggesting that aqueous species can access the pristine surface; 586
(ii) In spite of the stabilization of the ASSLs in Si-rich solutions (inferred from the 587
absence of surface retreat measured by VSI in the corresponding experiments), oligoclase 588
keeps dissolving, as evidenced by the linear release of Na for all faces (except the (001) face, 589
for which the release is more parabolic). These results indicate that oligoclase dissolution 590
proceeds with little to no transport limitation of the reactive species within the ASSL, 591
suggesting that the surface layers are intrinsically porous. This result is consistent with those 592
26 obtained by Wild at al. (2016) on labradorite altered at 80 °C, where passivation was not 593
observed for pH < 2.5. The switch of layers transport properties for a threshold pH value may 594
explain why in natural settings -where pH ranges from mildly acidic to slightly basic- 595
passivation may occur (Nugent et al., 1998; Daval et al., 2018). 596
At pH 10, no ASSL was formed on the crystalline oligoclase surface in silica-low 597
solutions as revealed by (i) the clear observation of etch pits (as mentioned by Ruiz-Agudo et 598
al. (2012), the nucleation and growth of etch pits require a stoichiometric release of all ions to 599
the solution), (ii) the stoichiometric Na/Si release, in agreement with previous dissolution 600
studies conducted on alkali feldspars in alkaline media (e.g., Hellmann et al., 1997; Pollet-601
Villard et al., 2016a), (iii) the absence of any secondary phases revealed by SEM analyses. 602
Note that the slight lack of Al in solution was attributed to an experimental artifact resulting 603
from Al precipitation after sampling and before ICP analyses, as verified from duplicate 604
experiments which revealed that the release of Al was strictly stoichiometric (see 605
Supplementary Data.). In contrast, ASSLs did develop in silica-rich solutions, as suggested by 606
the absence of surface retreat measured by VSI. Similarly to the pH 1.5 experiments, such 607
layers are non-passivating, as suggested by the release rate of Na, which is similar in silica-608
low and silica-rich solutions (see Table 5). The transport properties of these layers are 609
therefore even better than those developed at pH 1.5 on oligoclase surface in silica-rich 610
solutions. 611
To summarize, the formation and stabilization of ASSLs on crystalline oligoclase has 612
little to no impact on the release rate of Al and Na, suggesting that such ASSLs do not prevent 613
the solution to reach the pristine crystalline surface, whatever the pH. Because this result does 614
not depend on the crystallographic orientation, we can further suggest that the transport 615
properties of ASSLs are isotropic, in agreement with the results of Wild et al. (2016) for 616
labradorite feldspar at pH 1.5 and 80 °C. 617
27 Finally, the fluid data clearly indicate that the chemical composition of ASSLs formed 618
on the oligoclase glass differs from that formed on crystalline oligoclase. The linear release of 619
the three cations in low-Si solution at pH 1.5 and 10, even though the dissolution is not 620
congruent, clearly indicates that the alteration layers are not passivating. 621
Conversely, in Si-rich solutions, a progressive decrease of the dissolution rate is 622
observed, suggesting that a dense and transport-limiting layer builds up. The difference in 623
chemical composition of the surface layers may explain why those formed on the glass keep 624
dissolving in Si-rich solutions (see VSI data listed in Table 4), as opposed to the ASSLs 625
formed on crystalline oligoclase. This observation questions the existence of a mechanistic 626
continuum between the dissolution of glass and crystal of identical chemical composition, 627
resulting in the discussion detailed in the next section. 628
629
4.4. Impact of amorphous/crystalline structure
630
At pH 1.5, oligoclase glass dissolves at a rate similar to that of the fastest studied faces 631
of the crystal (Figure 14a). This observation indicates that under acidic pH conditions, and for 632
this particular composition, the absence of long-range order only weakly impacts the 633
dissolution rate of the solid. Notwithstanding, the fluid data suggest that the ASSLs do not 634
have the same chemical composition on oligoclase glass and crystal. This result is particularly 635
intriguing: if one assumes that both solids dissolve following an interfacial dissolution-636
reprecipitation mechanism, then the chemical composition of the interfacial precipitate should 637
be the same, as long as the chemical composition of the fluid and solid phases are the same in 638
all experiments, and provided that the nature of the substrate does not favor the nucleation of 639
one phase at the expense of another. As a consequence, one of the simplest explanations to 640
untie this knot is to assume that oligoclase glass and crystalline oligoclase do not dissolve 641
following the same interfacial dissolution-reprecipitation mechanism. While the data collected 642
28 above for crystalline oligoclase are consistent with an interfacial dissolution-reprecipitation 643
mechanism, ASSLs formed on the oligoclase glass may at least partly be formed by leaching. 644
To explore this idea, molecular dynamics simulations of crystal and glass structures 645
have been performed. Figure 15 shows that the structure of the glass is more open than that of 646
the crystal, with a small fraction of interstitials allowing water molecules to diffuse in (radius 647
> 1.3 Å). In the crystal, such voids do not exist. As a consequence, crystal dissolves only by 648
surface reactions, whereas glass may undergo both ion-exchange following water diffusion in 649
the solid, as well as surface reaction. 650
At pH 1.5, the linear release of sodium with time from glass may either be explained 651
by dissolution-reprecipitation (because this model assumes that the release of ions is not 652
transport-limited) or by preferential leaching, because the classical ion-exchange between 653
network modifiers and hydronium ions, which occurs following (Bunker, 1994): 654
SiO-…Na+ + H3O+ SiOH + Na+ + H2O
655
and results in a square root time-dependent release of Na (Doremus, 1979; Boksay, 1979) is 656
unlikely here, since sodium ions do not act as glass modifiers. Instead, the vast majority of 657
them charge compensate AlO4- units forming a strong ionic bond with O. Because of the
658
difference in the chemical bonding between Na+ and H+ with O, H+ cannot charge compensate 659
AlO4- (Uchino et al., 1993). Therefore, it is not surprising that in our study — but also for
660
jadeite and nepheline glasses, which both have an Al/Na ratio of 1 — the Na release under 661
acidic pH conditions is not parabolic but linear and almost congruent with Al release 662
(Hamilton et al., 2001). As a consequence, under acidic conditions, oligoclase crystal and 663
oligoclase glass may dissolve following either the same or slightly different mechanisms due 664
to the more open glassy structure. This difference remains small because of the absence of 665
non-bridging oxygen (NBO) in the glass. 666
29 At pH 10, the oligoclase glass dissolves 10 to 20 times faster than its crystalline 667
equivalent (Table 5, Figure 14b). The altered layers formed on glass contain Si and Al, 668
whereas no surface layers were formed on the various crystal faces. 669
In order to explain the effect of pH on the behavior of the two solids, let us first 670
consider that the rate-limiting steps of aluminosilicate dissolution are pH-dependent. In acidic 671
conditions, hydrolysis of Si-O-Al dominates network dissolution (Xiao and Lasaga 1995), 672
whereas in basic conditions, either hydrolysis of deprotonated silanol groups or direct 673
nucleophilic attack of Si by OH- are responsible for network dissolution. The density of 674
critical bonds (Si-O-Si in alkaline pH, Si-O-Al in acidic pH) is then a key factor controlling 675
matrix dissolution. At basic pH, the preferential attack of Si results in a majority of residual 676
with no connectivity with the other Al. Then, two scenarios may be envisioned,
677
depending on the structure of the considered solid: regarding oligoclase crystal, the absence of 678
interstitials limits the reaction front at the mineral/water interface, and the removal of the 679
remaining Al is required for dissolution to go on. This is consistent with the step retreat 680
mechanism that was invoked to explain oligoclase dissolution anisotropy (which implies a 681
sequential, congruent removal of the atomic planes), and with the absence of surface layers in 682
the Si-low experiments. On the other hand, water percolation in the more open glassy 683
structure may result in surface layers that contain Al, as reported in the present study. As a 684
consequence, the oligoclase glass dissolves in basic pH as a SiO2 polymorph does, i.e., much
685
faster than the crystal because of the structural disorder of the glass. These simple 686
considerations are in agreement with Hamilton et al (2001), who studied the dissolution of 687
albite (Al/Si: 1/3), jadeite (Al/Si: 1/2) and nepheline (Al/Si: 1/1) glasses between pH 1 and 12. 688
They showed that the higher the Al/Si ratio in the glass, the greater its dissolution rate in 689
acidic pH, whereas the rates are very close at pH 12, at least for albite and jadeite glasses. 690
30 To summarize, supposing that oligoclase glass and crystalline oligoclase do not 691
dissolve following the same mechanisms also helps explain the apparent contradiction 692
between the reactivity of the solids for the considered pH. 693
694
5. Conclusions
695Investigating the dissolution of oligoclase glass and crystalline oligoclase under 696
identical chemical composition of the solutions enabled us to reach the following conclusions 697
regarding the impact of atomic ordering on silicate dissolution rates and mechanisms: 698
(i) The dissolution of crystalline oligoclase is anisotropic, and the face-specific 699
dissolution rate is in reasonable agreement with the periodic bond chain theory, both at acidic 700
and basic pHs. 701
(ii) Si-rich ASSLs developed on the surface of crystalline oligoclase at acidic pH are 702
non-passivating, and most likely formed by an interfacial dissolution-reprecipitation 703
mechanism. 704
(iii) The dissolution rate of oligoclase glass is similar to the fastest dissolving face at 705
acidic pH, and is more than an order of magnitude greater at basic pH. 706
(iv) The abovementioned discrepancy, coupled to the inferred difference of chemical 707
compositions of ASSLs between oligoclase crystal and oligoclase glass, and the results of 708
molecular dynamics support the idea that oligoclase glass may not dissolve according to the 709
exact same mechanisms as crystalline oligoclase, as oligoclase glass may undergo preferential 710
leaching of Al-Na moieties. 711
Taken together, these results question the existence of a mechanistic continuum 712
between the dissolution of silicate minerals and glasses, at least as basic pH. Further detailed 713
characterizations of the surface layers will help to unravel this assertion. 714
31
Acknowledgements:
716
The authors thank Gilles Morvan (LHyGeS), Rémy Saint-Lys (LHyGeS) and René Boutin 717
(LHyGeS) for performing EBSD, providing supplementary data and helping with ICP-AES 718
measurements, respectively. The author also thank the ECOS-MinCyT program for allowing 719
the venue of Mélanie Vital in Strasbourg for several months. The authors are grateful to 720
Thibault Charpentier (CEA Saclay) and Frédéric Angeli (CEA Marcoule) for the NMR 721
analyses. The precious advices of Patrick Jollivet (CEA) were also particularly appreciated. 722
Finally, the present paper benefited from the insightful comments and suggestions of 723
Lawrence Anovitz (AE) and three reviewers including Jonathan Icenhower, which greatly 724
improved an earlier version of the manuscript. This work was funded by Andra. 725
32
References
727
Arvidson RS and Lüttge A (2010) Mineral dissolution kinetics as a function of distance from 728
equilibrium – New experimental results. Chem. Geol 269, 79-88. 729
Bandstra JZ and Brantley SL (2008) Surface evolution of dissolving minerals investigated 730
with a kinetic Ising model. Geochim. Cosmochim. Acta 72, 2587-2600. 731
Bouyer F, Geneste G, Ispas S, Kob W and Ganster P (2010) Water solubility in calcium 732
aluminosilicate glasses investigated by first principles techniques. J. Solid State Chem. 183, 733
2786-2796. 734
Bunker BC (1994) Molecular mechanisms for corrosion of silica and silicate glasses. Journal 735
of Non-Crystalline Solids 179, 300-308.
736
Burch TE, Nagy KL, Lasaga AC (1993) Free energy dependence of albite dissolution kinetics 737
at 80°C and pH 8.8. Chem Geol 105, 137-162. 738
Cailleteau C, Angéli F, Devreux F, Gin S, Jestin J, Jollivet P and Spalla O (2008) Insight into 739
silicate-glass corrosion mechanisms. Nature Materials 7, 978-983. 740
Casey WH (2008) Glass and mineral corrosion dynamics and durability. Nature Materials 7, 741
930-932. 742
Collin M, Fournier M, Frugier P, Charpentier T, Moskura M, Deng L, Ren M, Du J and Gin S 743
(2018a) Structure of International Simple Glass and properties of passivating layer formed in 744
circumneutral pH conditions. Npj Materials Degradation 2, article n°4. 745
Collin M, Fournier M, Charpentier T, Moskura M and Gin S (2018b) Impact of alkali on the 746
passivation of silicate glass. Npj Materials Degradation 2, article n°16. 747
Daval, D, Calvaruso C, Guyot F, Turpault MP (2018) Time-dependent feldspar dissolution 748
rates resulting from surface passivation: Experimental evidence and geochemical 749
implications. Earth Planet Sc Lett 498, 226-236. 750
Daval D, Martinez I, Corvisier J, Findling N, Goffe B and Guyot F (2009a) Carbonation of 751
Ca-bearing silicates, the case of wollastonite: experimental investigations and kinetic 752
modelling. Chem. Geol. 265, 63-78. 753
Daval D, Martinez I, Guigner JM, Hellmann R, Corvisier J, Findling N, Dominici C, Goffe B 754
and Guyot F (2009b) Mechanism of wollastonite carbonation deduced from micro- to 755
nanometer length scale observations. Am. Mineral. 94, 1707-1726. 756
Daval D, Hellmann R, Corvisier J, Tisserand D, Martinez I and Guyot F (2010) Dissolution 757
kinetics of diopside as a function of solution saturation state: Macroscopic measurements and 758
implications for modeling of geological storage of CO2. Geochim. Cosmochim. Acta 74, 759
2615-2633. 760